


Malnutrition is prevalent in adults and children with chronic liver diseases (CLD) and ranges from 11 % to 51 % depending on the anthropometric parameter used for assessment(Reference Kouassi, Bagny and Kaaga1–Reference da Silva Fink, Daniel de Mello and Daniel de Mello5). Causative factors of malnutrition in CLD include reduced energetic intake, anorexia, early satiety due to organomegaly and/or ascites, restricted diets, malabsorption, abnormalities in the metabolism of macronutrients, increased resting energy expenditure, hypermetabolism and increased pro-inflammatory cytokines(Reference Kirby and Danner6–Reference Kelly10). Undernourished children with cirrhosis have an increased rate of complications with increased morbidity and mortality(Reference Wayman, Cox and Esquivel11,Reference Utterson, Shepherd and Sokol12) . Growth deficit also influences pre- and post-liver transplant (LT) outcomes(Reference Saito, Mizuta and Hishikawa4,Reference Baker, Stevenson and Dhawan13,Reference DeRusso, Ye and Shepherd14) . Identifying malnutrition based on anthropometry is difficult in children with CLD because of the presence of ascites and/or pedal oedema(15). There are several nutritional assessment scores used and validated in the paediatric age group(Reference Joosten and Hulst16–Reference Hulst, Zwart and Hop19). Most of these tools have been tested in settings other than childhood liver disease(Reference Joosten and Hulst16,Reference Gerasimidis, Keane and Macleod18,Reference Hulst, Zwart and Hop19) . In the setting of childhood liver diseases, there is a lack of consensus on the definition of malnutrition, usage of screening methods and nutrition as part of patient care. These factors are responsible for the under-recognition of malnutrition and its impact on clinical outcomes in children with CLD(Reference Wayman, Cox and Esquivel11–Reference DeRusso, Ye and Shepherd14).
Subjective global nutritional assessment (SGNA) proposed in 1982 and validated later in children is a comprehensive, organised, simple and non-invasive tool with provision of age-related questionnaires to aid history taking and physical examination. SGNA has been shown to be a highly sensitive tool for assessing nutritional status and to identify children at risk of developing undernutrition with good inter-observer reliability and for prediction of post-operative complications(Reference Mahdavi, Ostadrahimi and Safaiyan20). We hypothesised that SGNA could identify malnutrition in children with CLD and predict nutrition-associated morbidity and mortality. The primary objective of this study was to assess SGNA as a tool of nutritional assessment in comparison with standard anthropometric parameters in children with CLD. Secondary objective was to assess SGNA as a predictive tool for poor outcome (death/liver transplant) at 1-year post-enrolment. Additional secondary objectives were to compare between the various nutritional categories: the length of hospital stay over the 1-year follow-up period, proportion requiring hospital readmission, number of hospital readmissions and proportion with complications of CLD.
Methods
This was a prospective observational study, in which two nutritional assessment tools were concomitantly applied to children and adolescents aged 3 months to 18 years, with CLD, attending the indoor services of the department of Pediatric Hepatology from January 2016 to October 2018 and parents/guardians consented to participate in the study. The work was approved by the institute’s scientific review board (NCT02802761). Exclusion criteria included children with deformities not allowing anthropometric measurements, metabolic or endocrinal disease, history of receiving total parental nutrition and absence of written consent. All children underwent a detailed evaluation regarding baseline clinical features, demographic characteristics as well as aetiology of CLD and individualised standard treatment for CLD. The patients were followed up at 1, 3, 6, 9 months and at 1 year after enrolment or till death/LT. All patients were counselled and followed up by a trained dietitian regarding home-cooked food as per the recommended daily intake for CLD (120–150 kcal/kg per d and 2–2·5 g/kg per d of protein intake). In case of inadequate weight gain, parents of the children under-3 years of age were home-trained for nasogastric feeds and rest of the children were encouraged to eat. The outcome was noted in the form of infectious and non-infectious complications of CLD, hospital admissions and length of hospital stay, and survival with native liver, death or LT at 1 year. Grading of HE was done using West Haven criteria for patients aged 5–18 years(Reference Ferenci, Lockwood and Mullen21), and as per the modified encephalopathy assessment scale for children under-5 years(Reference Squires, Shneider and Bucuvalas22). Acute kidney injury was defined as per Kidney Diseases – Improving Global Outcomes guidelines(Reference Kellum and Lameire23). Ascites and spontaneous bacterial peritonitis (SBP) were defined as per International ascites club definition(Reference Moore, Wong and Gines24,Reference Rimola, García-Tsao and Navasa25) . Only grade 2 and 3 ascites were included as complication. Definition of cholangitis in infants and children with biliary atresia was used as previously defined(Reference Luo, Hao and Zhang26). The details of the anthropometric assessment are presented in online Supplementary digital file 1. All anthropometric parameters were classified based on WHO standards, and z scores for weight for age (WFA), height for age (HFA), BMI and weight for height were calculated by the WHO Anthro, version 3.2.2 for <5 years and WHO Anthroplus personal computers software computer programmes for 5–19 years, respectively (WHO; 0–19 years)(15,27–30) . For mid-upper arm circumference, triceps skinfold thickness and subscapular skinfold thickness, z scores were calculated using WHO anthro version 2 software(31).
Assessment of malnutrition by SGNA on this cohort was performed independently by first and fourth authors (A. P. and M. S.) within 24 h of admission who were trained for this function. The fourth author (M. S.) was blinded to the results of SGNA categorisation by the first author to evaluate inter-observer reliability. The SGNA questionnaire was used as published before(Reference Secker and Jeejeebhoy32) (Fig. 1). While performing SGNA, seven specific features of a nutrition-focused medical history and three features of a nutrition-focused physical examination for signs of inadequate energy and/or protein intake were considered. Age-specific questionnaire was used to evaluate medical history and physical examination including the patient’s appropriateness of current HFA and weight for height, unintentional changes in body weight, adequacy of food intake, frequency and duration of gastrointestinal symptoms, functional capacity and history of metabolic stress, loss of subcutaneous fat, muscle loss and presence or absence of oedema. Based on these, each participant was assigned a rating of well-nourished (group A), moderately malnourished (group B) or severely malnourished (group C) according to the guidelines provided on the SGNA rating form(Reference Secker and Jeejeebhoy32). In case of development of any complication, the parent/guardian reported to the first author (A. P.) either personally or telephonically either in between or during follow-up visits. Hospital stay was considered as days spent in hospital within 1-year follow-up period after enrolment. Hospital readmission was considered if there was a period of >72 h from the last admission.

Fig. 1. Subjective Global Nutritional Assessment (SGNA) questionnaire.
Statistical analysis
Taking the agreement (kappa statistics) between SGNA and anthropometric measures as 33·6 % as per Mahdavi et al. (Reference Mahdavi, Ostadrahimi and Safaiyan20), assuming the prevalence of malnutrition in childhood CLD to be 30 %, with an α of 5 % and a power of 80 %, we needed to evaluate eighty-three cases. Statistical analysis was performed using SPSS version 22.0. Categorical/discrete variables were compared between groups using χ 2 test or Fisher’s exact test, whereas continuous variables were compared using paired and unpaired t tests, Mann–Whitney U test and Kruskal–Wallis test (for skewed data). ANOVA was used to see the association between multiple continuous variables followed by post hoc Tukey tests. Correlations between SGNA and anthropometric parameters were assessed using Kendall’s tau correlation coefficient for ordinal data and Spearman’s coefficient for continuous data. Agreement between SGNA and anthropometric measurements was assessed by Kappa coefficient and ANOVA statistics(Reference Elia and Stratton33). Survival analysis was done with Kaplan–Meier analysis.
Results
Flow diagram in Fig. 2 depicts the enrolment of subjects. One hundred children were initially enrolled, out of which eight children had to be excluded as mid parental height was not available. Twenty-seven (29 %) of the cohort was younger than 1 year with median age of the sample population 23·5 (3–216) months and majority being males (77 %). According to the SGNA, 47 patients (51·1 %) were classified as group A, 26 patients (28·3 %) as group B and 19 patients (20·6 %) as group C. Seven children (four from group A and three from group B) were lost to follow-up within the first month after enrolment due to remote area of residence (n 5) and refusal to continue in the study (n 2). Therefore, follow-up analysis was done in eighty-five patients: forty-three in group A, twenty-three in group B and nineteen in group C. SGNA identified more undernutrition (groups B and C) in the infantile age group in comparison with the older children (19/27 v. 26/65, OR = 1·436, 95 % CI 1·084, 1·903, P = 0·011). However, the same was not true for the identification of severe malnutrition (group C) (6/27 v. 13/65, OR = 1·098, 95 % CI 0·517, 2·333, P = 0·785). The median duration of hospital stay was 15 (6–21) d over 1-year follow-up period, amongst the whole cohort.
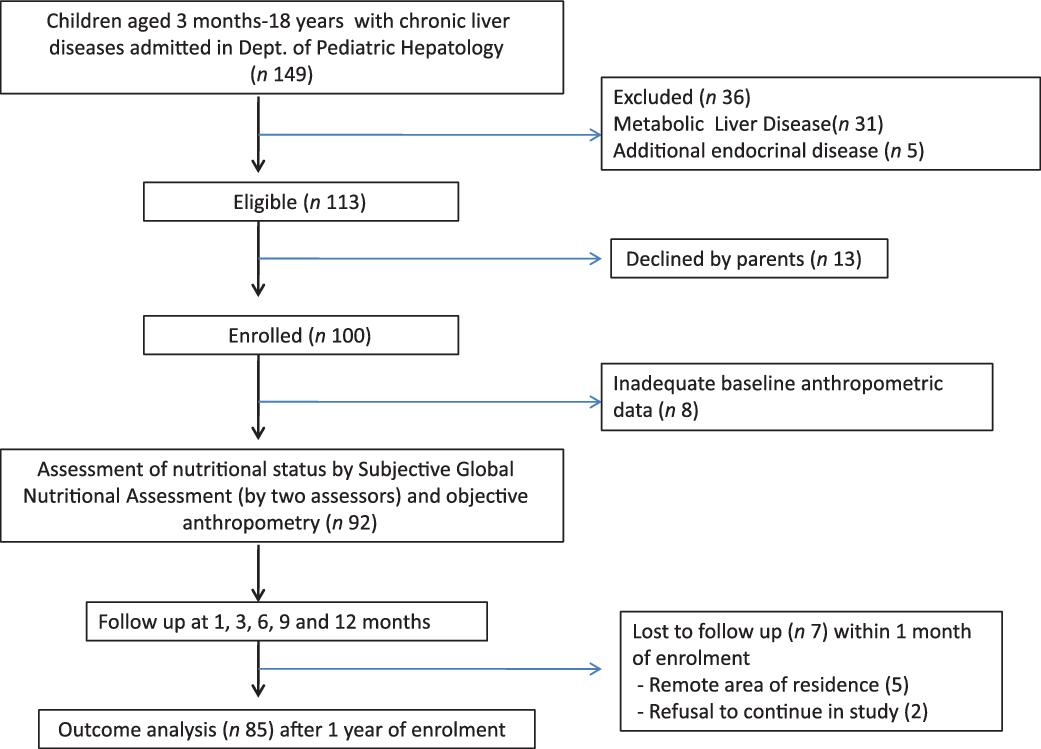
Fig. 2 Subject enrolment, nutritional assessment and follow-up plan.
Supplementary digital file 2 describes the distribution of the aetiological profile of the cohort: biliary atresia (n 32, 34·8 %) and progressive familial intrahepatic cholestasis (n 21, 22·8 %) constituted the commonest aetiologies. It also shows nutritional categories as per SGNA in various aetiologies of liver disease. Table 1 shows baseline laboratory values in different nutritional categories as per SGNA. We found significant difference between categories with respect to bilirubin levels and INR. Moreover, bilirubin and aspartate transaminase levels showed positive correlation with worsening nutritional status as per SGNA (Kendall coefficients = 0·348, P < 0·001 and 0·207, P = 0·013).
Table 1. Comparisons of nutritional status as per subjective global nutritional assessment v. biochemical parameters and anthropometric z scores
(Mean values and standard deviations)
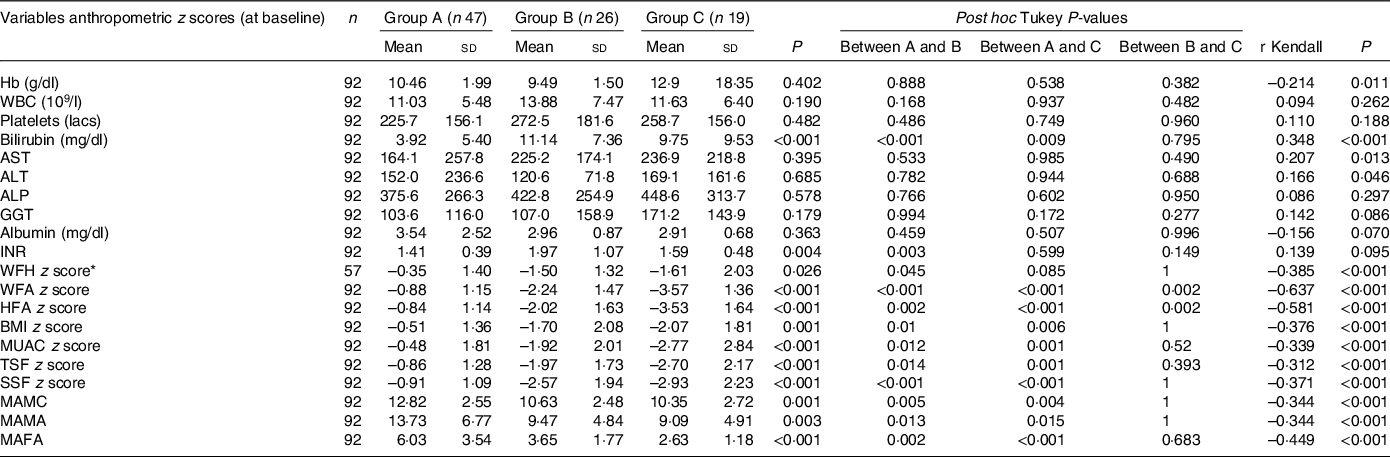
Group A, Well-nourished; Group B, Moderately malnourished; Group C, Severely malnourished; ALP. alkaline phosphatise; ALT, alanine transaminase; AST, aspartate transaminase; GGT, gamma-glutamyl transpeptidase; HFA, height for age; INR, International normalised ratio for prothrombin time; MAFA, mid-arm fat area; MAMA, mid-arm muscle area; MAMC, mid-arm muscle circumference; MUAC, mid-upper arm circumference; SSF, subscapular skinfold thickness; TSF, Triceps skinfold thickness; WFA, weight for age; WFH, weight for height.
* WFH z scores available only till 5 years of age, hence children under 5 years were included (n 57).
SGNA v. anthropometric measures
SGNA classified a higher proportion (48·9 %) of patients with malnutrition as compared with weight for height (33·3 %), WFA (42·4 %), HFA (36·9 %), BMI for age (31·5 %), mid-upper arm circumference (39·1 %), triceps skinfold thickness (35·9 %) and subscapular skinfold (38·0 %). Table 1 shows that there were significant differences between the groups (ANOVA with post hoc Tukey test) – Group A as per SGNA showed significantly higher values of the anthropometric indices than the other two (groups B and C). However, among the groups B and C, the difference was only significant in relation to HFA and WFA (P = 0·002). Kendall coefficients disclosed significant association of SGNA groups with all anthropometric measurements; the greatest association of SGNA groups was seen with WFA (r = –0·637) followed by HFA (r = –0·581) and mid-arm fat area (r = –0·449). Other objective parameters showed weak to regular associations with SGNA (Table 1).
Analysis by kappa statistic showed that there was significant agreement between the classification of nutritional status by SGNA and by other anthropometric z scores (P < 0·05 for all). Agreement between the two evaluation methods was strong for WFA (k = 0·82, P < 0·001, i.e. 64–81 % of data were reliable), and moderate for HFA (k = 0·67, P < 0·001, i.e. 35–63 % of data were reliable). Rest of the objective measures had only fair agreement. SGNA showed the best performance with WFA, with a sensitivity of 94·9 %, a specificity of 84·9 % and positive predictive value and negative predictive value of 82·2 % and 95·7 %, respectively, with corrected accuracy of 89·1 %. Subscapular skinfold showed the lowest sensitivity (74·3 %), while weight for height had the lowest specificity (55·3 %) and diagnostic accuracy (64·9 %) (Table 2).
Table 2. Performance and agreement of subjective global nutritional assessment (SGNA) for detection of malnutrition as compared with various anthropometric parameters
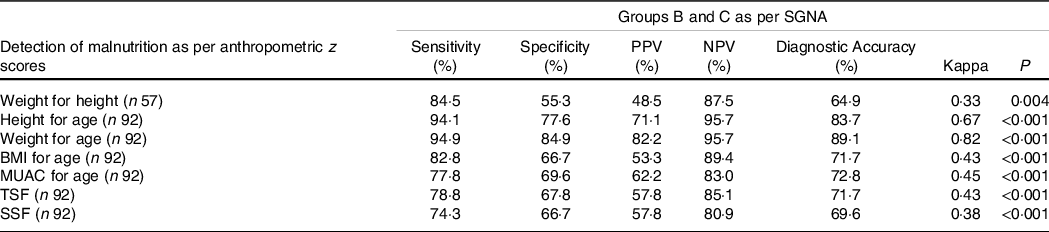
Group B, Moderately malnourished; Group C, Severely malnourished; MUAC, mid upper arm circumference; n = Number of subjects; NPV, negative predictive value; PPV, positive predictive value; SSF, sub-scapular skinfold thickness; TSF, Triceps skinfold thickness.
Prediction of complications of chronic liver disease and poor outcome by subjective global nutritional assessment
The percentage of children requiring readmission within 1 year after enrolment was 34·1 % (29 of 85 cases). When the groups B and C were grouped together, the risk of hospital readmission was increased 12·2 times in them as compared with group A (27/41 v. 6/44, OR 12·2 (95 % CI 4·60, 35·88), P = 0·001). As is evident in Fig. 3, the number of hospital admissions and length of hospital stay significantly increased with the increasing severity of malnutrition. Using one-way ANOVA and post hoc comparison by Tukey test, nutritional status classification by SGNA was found to be significantly associated with length of hospital stay (P = 0·003) and number of hospital admissions (P < 0·001) within 1-year post-enrolment. Mean number of hospital admissions was 0·72 (sd 0·74), 1·54 (sd 1·65) and 2·58 (sd 1·46) d in groups A, B and C (P < 0·05 for all inter-group comparisons), respectively. In the 1-year follow-up period, twenty children died and four received LT. A significantly higher number of children with malnutrition (groups B and C) had poor outcome (death/LT) 1-year post-enrolment (19/41 v. 5/44, OR 6·74 (95 % CI 2·21, 20·55), P = 0·001) as compared with group A. No significant differences in outcome (death/LT or survival with native liver) were seen between groups B and C. The median survival with native liver in days was significantly higher in the group A v. group B + C as seen in the Kaplan–Meier Analysis (Log rank < 0·001) (Fig. 4).
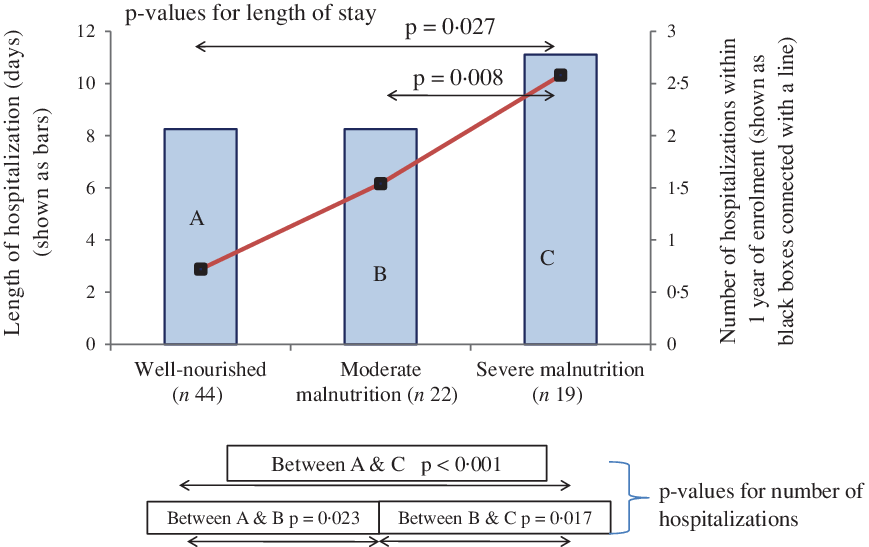
Fig. 3. Length of hospital stay and number of hospitalisations within 1 year related to subjective global nutritional assessment categories of nutritional status in children with liver disease using one-way ANOVA post hoc Tukey.
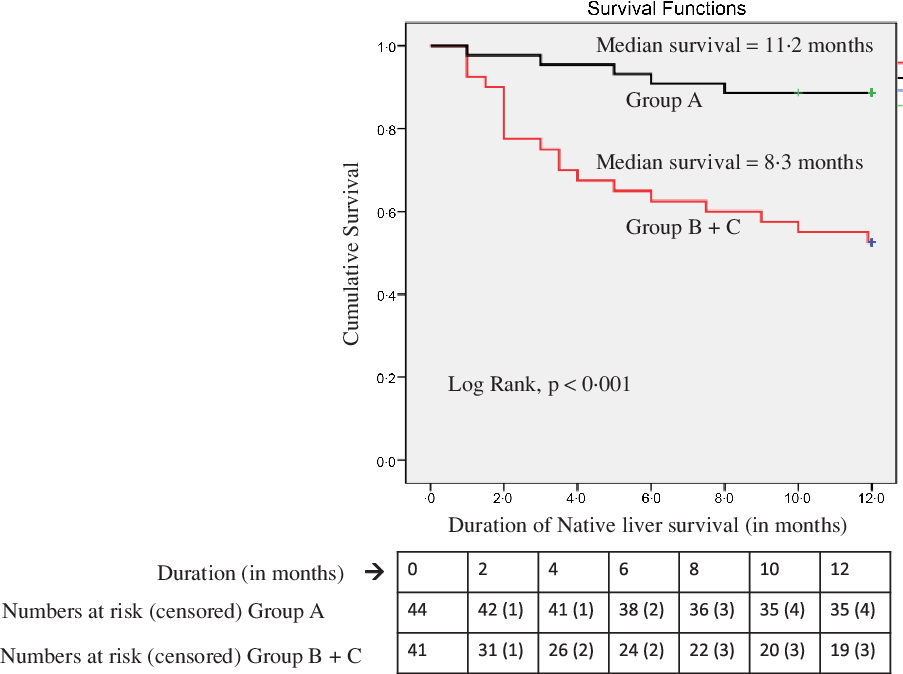
Fig. 4. Kaplan–Meier Survival Analysis of Well (group A) v. Undernourished children (group B + C) as per Subjective Global Nutritional Assessment (SGNA).
Figure 5 depicts the distribution of complications in the eighty children experiencing 147 complications in total. Out of total 147 complications, majority were infectious (44) in origin ((pneumonia (27), cholangitis (8), urinary tract infections (4, culture-proven), diarrhoea (3), pyoderma (1), paronychia (1)) accounting for 29·9 % of all complications. Other complications included ascites (31, 21·1 %), hepatic encephalopathy (28, 19·0 %), SBP (24, 16·3 %), gastrointestinal bleed (9·5 %, melena in 10, haematochezia in 4) and acute kidney injury (6, 4·1 %). The incidence of ascites, hepatic encephalopathy, SBP as well as other infectious complications was significantly increased in groups B and C as compared with group A (P < 0·05 for all) (Fig. 5). The episodes of cholangitis when evaluated independently among the operated cases of biliary atresia (n 19, 2 episodes in 12 group A and 6 episodes in 7 groups B and C) were significantly more in latter (P = 0·024). No difference was noted between nutritional status for the occurrence of gastrointestinal bleed and acute kidney injury. Compared with group A, groups B and C had significantly increased risk of development of ascites (3/44 v. 28/41, OR 29·4 (95 % CI 7·6, 112·8), P < 0·001), hepatic encephalopathy (3/44 v. 25/41, OR 21·3 (95 % CI 5·65, 80·71), P < 0·001) and SBP (3/44 v. 21/41, OR 14·4 (95 % CI 3·82, 53·86), P = 0·0001) in that order. Groups B and C experienced a higher rate of infectious complications (other than SBP) compared with group A (35/41 v. 9/44, OR 22·68 (95 % CI 7·29, 70·53), P < 0·0001).
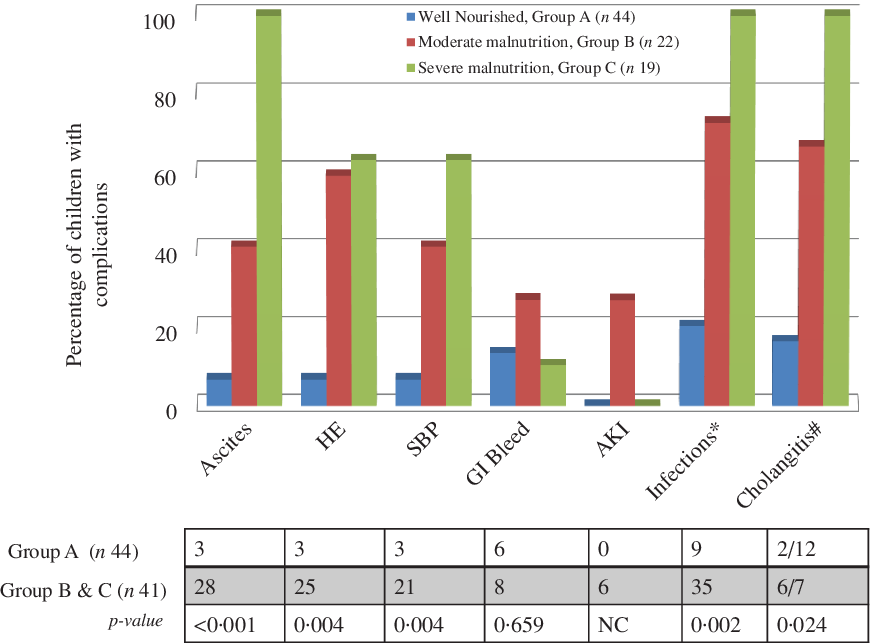
Fig. 5. Distribution of complications in the cohort for 1-year follow-up period. AKI, acute kidney injury; GI, gastrointestinal; HE, hepatic encephalopathy; SBP, spontaneous bacterial peritonitis. Group A = Well-nourished, Group B = Moderately malnourished, Group C = Severely malnourished. *Infections = Other than SBP, #Cholangitis = In children with biliary atresia after Kasai portoenterostomy.
Reliability of subjective global nutritional assessment
There was good inter-observer agreement in 90·2 % (83 of 92) of duplicate assessments of SGNA, thus indicating good reproducibility between the two assessors.
Discussion
In the present work, SGNA was used for the first time in children with CLD and its agreement, predictive ability and inter-observer reliability were assessed. In the present work, we validated SGNA for the first time for usage in children with CLD through the psychometric properties: concurrent and predictive validity and inter-observer reliability. Concurrent validity of SGNA was determined by comparing it with anthropometric z score. This study showed that SGNA classified higher proportion (49 %) of patients with malnutrition as compared with all other anthropometric methods (33·1 % to 42·4 %) and so is a reliable and non-invasive nutritional assessment tool in childhood CLD. SGNA showed significant association and correlated well with commonly used objective measurements, which was moderate with WFA and fair with HFA. The results are consistent with studies in adult and paediatric populations with various other pathologies(Reference Mahdavi, Ostadrahimi and Safaiyan20,Reference Secker and Jeejeebhoy34–Reference Shirodkar and Mohandas41) . Recent studies among Brazilian and Iranian children showed weak-to-regular and fair-to-moderate correlation, respectively, between SGNA and anthropometric methods(Reference Carniel, Santetti and Andrade35,Reference Mahdavi, Safaiyan and Ostadrahimi42) .
Anthropometric z scores of SGNA-classified malnourished children were significantly lower than those of well-nourished children. However, except for WFA and HFA, there was no difference in the anthropometric parameters between moderately and severely malnourished children. This may reflect better capability of SGNA to classify children into a severely malnourished category and to guide for timely and appropriate nutritional intervention. The results of this study are congruent to results obtained by Mahdavi et al. among 140 hospitalised children where SGNA identified a higher proportion of malnutrition (70·7 % by SGNA v. 48·5 % by anthropometry)(Reference Mahdavi, Safaiyan and Ostadrahimi42). In our study, SGNA classified more undernutrition in under 1 year as against older children but the same was not seen for severe malnutrition, possibly due to smaller sample size of the subgroups. Over-estimation of weight in patients with CLD due to ascites, visceromegaly and/or sub-clinical oedema and associated stunting consequent to chronicity of illness can be the reasons for better identification of nutritional risk children with SGNA. As SGNA considers additional subjective variables like recent changes in appetite, functional capacity and metabolic stress, the high-risk categories are identified much earlier before apparent changes in anthropometric measures. Moreover, SGNA allows the assessor to capture the dynamic nature of malnutrition through consideration of subtle patterns of change in variables, such as the direction and duration of weight changes rather than absolute values(Reference Secker and Jeejeebhoy32).
Predictive validity assesses the extent to which a screening tool can predict the risk of future complications and clinical outcomes. In the present study, duration of hospital stay and number of hospital admissions within 1 year of follow-up significantly increased as the severity of malnutrition by SGNA increased. There was 12 times likelihood of readmission and a 6-fold risk of death/LT in the malnourished children as per SGNA. Well-nourished children had significantly higher native liver survival as compared with malnourished children. There is no study on SGNA in childhood CLD. However, in adults with cirrhosis, severe malnutrition by SGNA has been shown to be a predictor of mortality(Reference Bunchorntavakul, Supanun and Atsawarungruangkit3). Malnourished children identified by SGNA have been previously shown to have a longer duration of post-operative stay(Reference Secker and Jeejeebhoy34,Reference Mahdavi, Safaiyan and Ostadrahimi42) . Another study in critically ill children in intensive care unit has reported no association of SGNA with the duration of hospital stay(Reference Vermilyea, Slicker and El-Chammas39). CLD cohort differs from non-CLD patients in terms of varied morbidities due to end-stage liver disease causing readmissions and mortality, thus explaining results of the present study. In adults, SGNA categorisation before LT in one study has been shown to be associated with more intra-operative blood product requirements and longer post-operative stay(Reference Stephenson, Moretti and El-Moalem38), but the results were not corroborated by another study(Reference de Luis, Izaola and Velicia43).
We also showed that SGNA classified nutritional categories are more prone to develop liver-related and infectious complications. Ascites, hepatic encephalopathy, SBP and other infections increased in these children by 29-, 21-, 14- and 23-fold, respectively. The results are accordant with the previous reports of increased post-operative complications in such patients(Reference Secker and Jeejeebhoy34,Reference Stephenson, Moretti and El-Moalem38) . In a Brazilian study, however, SGNA was inferior to hand-grip strength for detection of malnutrition (28 % v. 63 %) and could not predict the development of liver-related complications(Reference Alvares-da-Silva and Reverbel da Silveira44). This difference can be explained by the meticulous detail in paediatric history taking in contrast to the adult counterpart.
In the present study, there was good inter-observer reliability (Kappa 0·74, P < 0·001), which is similar to results by Carniel et al. (Kappa 0·74) and Vermilyea et al. (Kappa 0·67), and was higher than that the studies by Secker (Kappa = 0·28) and Mahdavi (Kappa 0·33)(Reference Secker and Jeejeebhoy34,Reference Carniel, Santetti and Andrade35,Reference Vermilyea, Slicker and El-Chammas39,Reference Mahdavi, Safaiyan and Ostadrahimi42) . Performance and agreement of SGNA in terms of ability to predict malnutrition were strongest with WFA and good with HFA. Results from another cohort of 140 children from Iran showed comparable sensitivity (88·2 %), specificity (45·8 %), positive predictive value (60·6 %) and negative predictive value (80·4 %) of the SGNA method for screening undernutrition with weak to fair level of agreement between SGNA and objective nutritional assessment (Kappa 0·336)(Reference Mahdavi, Safaiyan and Ostadrahimi42).
This is the first study to validate SGNA in childhood CLD. The limitations of this study are small sample size and predominantly cholestatic study cohort, and hence, these results cannot be generalised to all children with CLD. Further, about 7·6 % children were lost to follow-up which is another limitation, but it did not affect the study power. In 2018, the European Association for Study of Liver Diseases has recommended performance of a rapid nutritional screen in all patients with cirrhosis to confirm the presence and severity of malnutrition(45). The current work using and validating SGNA as a systematic nutritional assessment tool proves to be one of the first steps in childhood CLD. Wider use of SGNA as a nutritional assessment tool in childhood CLD for early identification of patients at risk of malnutrition will probably ensure timely appropriate nutritional intervention. We conclude with the present work that SGNA is a useful nutritional assessment tool in childhood CLD; it correlates well with anthropometric measurements and predicts morbidity (hospital admissions and length of hospital stay) as well as overall transplant-free survival in children with CLD.
Acknowledgements
None declared.
S. A., R. K. and A. P. equally contributed to the conception of the research; all authors contributed to the study design; A. P. and M. S. contributed to the acquisition of the data; S. A., R. K., A. P. and G. K. contributed to the analysis of the data; S. A., R. K., A. P., J. B., V. S. and G. K. contributed to the interpretation of the data and S. A., R. K. and A. P. drafted the manuscript. All authors critically revised the manuscript, agree to be fully accountable for ensuring the integrity and accuracy of the work, and read and approved the final manuscript.
None stated.
Supplementary material
For supplementary material referred to in this article, please visit https://doi.org/10.1017/S0007114521001604


