


Heat treatment of food induces the Maillard reaction with formation of flavour and aroma compounds responsible for the characteristics of fried, roasted and baked foods. However, the progression of the Maillard reaction also leads to the formation of advanced glycation end products (AGE), which are protein adducts derived from sugar, lipids and dicarbonyl compounds via non-enzymatic reactions( Reference Henle 1 , Reference Poulsen, Hedegaard and Andersen 2 ). Potential contributions of dietary AGE to the endogenous load of AGE is of significant magnitude( Reference Henle 3 ), which have led to investigations of potential adverse effects of dietary AGE on inflammation and glucose metabolism( Reference Tessier and Birlouez-Aragon 4 ). In addition, the expression of the pro-inflammatory receptor for AGE (RAGE) and the anti-inflammatory AGE receptor 1 (AGER1) has been investigated in relation to intake of dietary AGE, and both receptors seem to be susceptible to a change in the dietary AGE intake( Reference Vlassara and Striker 5 ).
Milk is a common source of protein in human diets supplying in early life all protein and other nutrients, but in adult life typical Northern European total milk protein intakes are about 10 g/d comprising 10–20 % of protein intakes. Heating of milk powder as well as long-term storage lead to browning reactions where AGE are formed. Depending on the amino acid and protein composition of food, AGE formed during heat treatment of food range from free low molecular weight (LMW) to protein-bound and aggregated high molecular weight (HMW) AGE. The absorption of AGE is thought to be approximately 10 %( Reference He, Sabol and Mitsuhashi 6 , Reference Koschinsky, He and Mitsuhashi 7 ), but some HMW AGE are absorbed more slowly and less efficiently than LMW AGE( Reference Finot and Magnenat 8 , Reference Foerster, Kuhne and Henle 9 ). The importance of these different forms of dietary AGE in relation to in vivo bioactivity is not well investigated. In the present study, we investigated and compared the effects of HMW and LMW dietary AGE on expressions of RAGE, AGER1 and TNF-α and on insulin sensitivity, F2-isoprostaglandins (isoPGF2α ), body composition and food intake in rats over a 2-week period to allow build-up of AGE from the diets and to allow time for a biochemical or physiological response. Most previous studies in this area have been conducted with highly AGE-modified proteins potentially hampering proteolysis during their gastrointestinal passage. The present study is the first to test the effect of supplementation with a defined food having a relatively low degree of AGE modification and its proteolysis product on AGE excretion and inflammation.
Methods
Animals
In all, thirty-six male Sprague–Dawley rats (200 g, 10–11 weeks old) were obtained from Taconic maintaining a diurnal rhythm with a 12 h light–12 h dark cycle. Cage temperature was maintained at 22°C (range 20-24°C), relative humidity at 50 % and the air was exchanged at 75 h−1. Wooden chips (Tapvei Oy) were used as bedding material. Bite bricks (Tapvet®), Enviro-dri® nesting materials (Shepherd Specialty Papers) and cardboard houses (Brogaarden) were used for environmental enrichment. The animals were single housed with free access to food and water, unless otherwise stated. Before study start, all animals were acclimatised for a minimum of 5 d on a standard powder chow (Altromin 1311; Brogaarden) followed by 7 d of acclimatisation to the control diet. The animals were randomised, stratified by body weight and fat mass, to five groups (n 6–8) receiving different concentrations (control, low or high) and forms (HMW or LMW) of AGE in the diet: control, low AGE (L-AGE), high AGE (H-AGE), control LMW and high AGE LMW (H-AGE LMW) (Table 1). Ethics approval for the study was obtained from the Animal Experiments Inspectorate under the Danish Ministry of Food, Agriculture and Fisheries (license number 2012-15-2934-00054) and the rats were handled in a facility fully accredited by the Association for Assessment and Accreditation of Laboratory Animal Care.
Table 1 Overview of the diets fed to the rats in the five treatment groups

AGE, advanced glycation end product; LMW, low molecular weight.
* All diets contained 20 % milk powder, this column shows the fraction that was heated at 70°C for 7 d.
Diets
The diets were Western-type powder diets modified with 20 % skimmed milk powder (approximately 34 % protein) and total protein, fat and fibre contents of 31, 21 and 4 %, respectively (Altromin). The milk powder (Arla skimmed milk powder; Arla Foods) in the diets was used as a vehicle of AGE by heat treating the powder at 70°C for 7 d. The content of heat-treated milk powder (percentage of total milk powder) in the diet was 0 % for the control group, 40 % for the L-AGE diet and 100 % for the H-AGE diet. To produce the LMW diets, the milk powder was enzymatically hydrolysed with pepsin (CAS no. 9001-75-6; Sigma Aldrich) and trypsin (NS 43003, CAS no. 9002-07-7; Novozymes) followed by spray drying. To confirm that hydrolysis of the peptide bonds had occurred in the milk proteins, absorption was measured in diluted, dissolved milk powder at 220 nm (peptide bond absorption maximum), and a decrease in absorbance of the hydrolysed milk powder was observed. The diets are summarised in Table 1. All diets were maintained at 4°C during the study.
Study design and sample collection
The animals were kept on the experimental diets for 2 weeks. Food and water intake was automatically measured every 15 min throughout the study (ManiFeedWin system; Ellegaard Systems). Body weight was measured continuously throughout the study, and body composition was measured on day 0, 7 and 14 using an MRI scanner (Echo Medical Systems).
Half way through the intervention (day 7 or 8), the rats were placed in single-housed metabolic cages for 24 h, and urine samples were collected and analysed for AGE and isoPGF2α . On day 11, an intra-peritoneal glucose tolerance test with a glucose dose of 1·5 g/kg body weight was carried out after an overnight fast (12–14 h). Blood samples for glucose and insulin measurements were taken at −30, 0, 15, 30, 60 and 120 min after the glucose injection. Blood was collected in vacutainer tubes with EDTA as the anticoagulant. The samples were centrifuged at 3000 g for 10 min at 4°C, and plasma samples were stored at −80°C. Blood glucose levels were determined immediately using an Ascensia Contour Glucometer (Bayer), and plasma insulin concentrations were measured using a rat-specific ELISA kit (cat. no. 10-1250-01; Mercodia AB) according to the manufacturer’s instructions. Total ghrelin was measured on day 7 or 8 in the fed condition and on day 11 after an overnight fast (12–14 h). Concentration of total ghrelin in plasma was measured using a rat-/mouse-specific ELISA kit (cat. no. EZRGRT-91K; Millipore A/S) according to the manufacturer’s instructions. On day 14, the animals were killed by CO2 anaesthesia followed by decapitation and collection of blood. About 1 ml of blood was collected into a PAXgene Blood RNA Tube for purification of RNA from whole blood (PreAnalytiX). According to the manufacturer’s instructions, the tubes were incubated at room temperature for 2 h before they were transferred to −20°C for 24 h and then finally stored at −80°C. The rest of the blood samples were collected in vacutainer tubes with heparin as the anticoagulant. The samples were centrifuged at 3000 g for 10 min at 4°C, and plasma samples were stored at −80°C. The liver and pancreas were removed and immediately frozen in liquid N2. The intestine was removed and divided into segments of duodenum, jejunum, ileum and colon. Each segment was rinsed with PBS, and a sample from the mucosa was collected by scraping the inside and immediately freezing it in liquid N2. All organ and tissue samples were stored at −80°C until grinding and RNA isolation.
RNA isolation and real-time PCR
Total RNA was isolated from the liver, pancreas and the intestinal mucosa using TRI Reagent (TRI Reagent cat. no. TR 118; Molecular Research Center Inc.) according to the manufacturer’s instructions. Total RNA was isolated from whole blood using PAXgene RNA Blood kit for silica membrane-based RNA isolation and purification in a spin-column format (cat. no. 762174; PreAnalytiX) according to the manufacturer’s instructions. The concentration and purity of RNA were determined by measuring the ratio of absorbance at 260/280 and 260/230 nm with a NanoPhotometer (Implen). The synthesis of complementary DNA was carried out with SuperScript II Reverse Transcriptase (Invitrogen) according to the manufacturer’s instructions. Relative mRNA expression was quantified by real-time PCR on a 7900 HT Fast Real-Time PCR System (Applied Biosystems). PCR amplification for each target gene was performed in triplicate, and 18S was used as an internal normalisation standard. Data were expressed as fold difference in gene expression relative to a calibrator within each tissue. Target-specific TaqMan Gene Expression Assays (Applied Biosystems) used were RAGE (Rn00584249_m1), AGER1 (Rn01518759_m1) and TNF-α (Rn00562055_m1).
Measurement of advanced glycation end products
N ε -carboxymethyl-lysine (CML), N ε -carboxyethyl-lysine (CEL) and methylglyoxal-derived hydroimidazolone-1 (MG-H1) were determined in food and CML and MG-H1 were determined in urine by liquid chromatography (LC)-MS/MS as described previously( Reference Poulsen, Bak and Andersen 10 ). Food samples were acid hydrolysed as described elsewhere( Reference Jongberg, Rasmussen and Skibsted 11 ), with the minor modification that evaporation was performed under N at 60°C. The food samples were analysed without any further purification, whereas the urine samples were cleaned by solid phase extraction (SPE) using an HLB LP 96-Well Plate (60 mg; Waters). The SPE cartridges were pre-conditioned with 1 ml of methanol, followed by two times with 1 ml of water. A total volume of 100 µl urine together with 10 µl of isotope-labelled internal standards (30 µg/ml of each of CML-d2, ε-N-carboxy[2H2]methyl-l-lysine and MG-H1-d3, (2S)-2-amino-5-(5-[2H3]methyl-4-oxo-4,5-dihydro-1H-imidazol-2-ylamino)-pentanoic acid; PolyPeptide Group) were loaded onto the SPE cartridge and eluted with 300 µl of 20 % methanol/water. The loading and the eluate were combined and the solvent was evaporated. The samples were then re-dissolved in 200 µl 26 mm-ammonium formate. The samples were analysed on a 2·1 mm×15 cm Hypercarb Column (Thermo Scientific) with 3 μm particle size using ultra-performance LC with a triple quadrupole detector system (Waters) operated in the multiple reaction mode. The gradient used was from 26 mm-ammonium formate (A) to acetonitrile (B), going from 0 to 20 % B (0−3 min) and 20 to 60 % B (3–10·2 min) and then back to 100 % A with a re-equilibration delay of 3·8 min before the next injection. This was carried out with a flow rate of 0·1 ml/min. The transitions used for quantification and qualification for CML were 205>130 and 205>84, for MG-H1 229>166 and 229>114 and for CEL 219>130. The isotope-labelled standards used were CML-d2 with the transition 207·2>130·2, MG-H1-d3 with the transition 232>169 and CEL-d4 with the transition 223>134. The retention times were 6·22 min for CML, 6·24 min for CEL and 7·01 min for MG-H1. Acetonitrile and methanol Optima® LC/MS Grade were purchased from Fisher Chemical. Water used for all solutions was purified using Millipore ultra-pure water system. The intra- and inter-assay CV for CML were 2·1 and 5·9 %, for MG-H1 3·0 and 5·2 % and for CEL 5·7 and 14·2 %, respectively.
In addition, the milk powder was analysed for the dicarbonyls and AGE precursors 3-deoxyglucosone, glyoxal and methylglyoxal. The content of dicarbonyls in the milk powder was determined according to a method previously described( Reference Degen, Hellwig and Henle 12 ) with the modification that a Kinetex 5 μm Phenyl-Hexyl (100 Å) column from Phenomenex was used.
Measurement of isoprostanes
IsoPGF2α was analysed using a method developed by Zhang et al. ( Reference Zhang, Il’yasova and Sztaray 13 ) with minor modifications in stock standard solutions: 8-isoPGF2α (4 µg/ml), 2,3-dinor-8-isoPGF2α (4 µg/ml) and isotope-labelled 8-isoPGF2α -prostaglandin F2α -d4 (5 µg/ml). Intra-assay CV for 2,3-dinor-8-iso-PGF2α was 14·1 % (no inter-assay CV was available as all samples were analysed in the same batch). The CV for 8-isoPGF2α was not calculated as this compound was non-detectable in the samples.
Statistical analysis
Differences in means were analysed using ANOVA followed by post hoc pair-wise comparisons using Tukey adjustments. With the purpose of comparing all aspects of the diets, all five groups were included in the same analysis. In order to do that, we tested for homogeneity of variance between groups. Homogeneity of variance and normal distribution were inspected for all outcome variables using Levene’s test, residual plots and normal probability plots. All outcome variables that deviated from model assumptions were transformed logarithmically. AUC for glucose and insulin responses to the glucose tolerance test were calculated and compared between groups. Correlations between outcomes were examined by the Pearson’s correlation coefficient. Statistically significant difference was defined as a P value<0·05. Reported P values are based on two-sided tests. All analyses were performed in SAS version 9.2 (SAS Institute Inc.). One animal (in the control group) was excluded completely from the analysis due to apparent illness. One animal (in the H-AGE LMW group) had irregular food and water intake at the beginning of the study, and food and water data from this animal were excluded.
Results
CML content of the diets was clearly related to the proportion of heat-treated milk powder in the respective diets (Table 2). CEL showed a pattern similar to that of CML, but with smaller differences between the diets. The content of MG-H1 in the diets was below the limit of quantification for the method applied. The content of dicarbonyls in the milk powder increased when the milk powder was heated, but also the process of hydrolysis led to a limited increase in dicarbonyls (Table 3).
Table 2 Advanced glycation end product (AGE) content of the diets (Mean values with their standard errors; n 2)
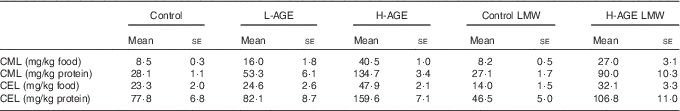
L-AGE, diet lower in AGE; H-AGE, diet higher in AGE; LMW, low molecular weight; CML, N ε -carboxymethyl-lysine; CEL, N ε -carboxyethyl-lysine.
Table 3 Dicarbonyl content (µg/g) of the milk powder (Mean values with their standard errors)
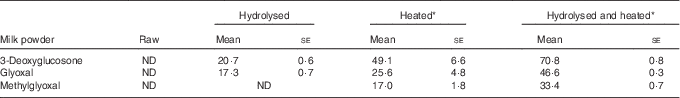
ND, not detected.
* 70°C for 7 d.
The content of CML in 24-h urine was higher in L-AGE, H-AGE and H-AGE LMW groups compared with control and control LMW groups (Fig. 1). The content of MG-H1 in 24-h urine was higher in control LMW and H-AGE LMW compared with control (Fig. 1).

Fig. 1 N ε -carboxymethyl-lysine (CML) and methylglyoxal-derived hydroimidazolone-1 (MG-H1) in urine (values are means, with standard errors) of rats fed the intervention diets for 7 d. * P<0·05 v. control and control low molecular weight (LMW). § P<0·05 v. control. L-AGE, diet lower in advanced glycation end products; H-AGE, diet higher in advanced glycation end products.
Gene expressions of RAGE and AGER1 in whole blood were different between groups; the H-AGE LMW group had higher levels compared with control, L-AGE and H-AGE groups (Fig. 2). In pancreas, the control LMW group had higher gene expression levels of AGER1 compared with the control group (P<0·05, data not shown). For the liver, duodenum, jejunum, ileum and colon, there was no difference in gene expressions between the groups. In the pancreas, duodenum and jejunum, the expression of TNF-α was not detectable in the majority of samples and analysis of data was not possible. There was a significant correlation between gene expressions of AGER1 in whole blood and urinary excretion of MG-H1 (Fig. 3). RAGE was not significantly correlated to excretion of MG-H1.

Fig. 2 Gene expression mRNA levels (values are means, with standard errors) of gene for receptor for advanced glycation end products (RAGE) and gene for advanced glycation end product receptor 1 (AGER1) in whole blood in rats fed the intervention diets for 14 d. * P<0·05 v. diet higher in advanced glycation end products (H-AGE) low molecular weight (LMW). RQ, relative quantitation; L-AGE, diet lower in advanced glycation end products.

Fig. 3 Correlations between urinary concentrations of methylglyoxal-derived hydroimidazolone-1 (MG-H1) and gene expression mRNA levels (relative quantitation) of gene for receptor for advanced glycation end products (RAGE) and gene for advanced glycation end product receptor 1 (AGER1) in whole blood.
The content of 2,3-dinor-8-isoPGF2α in 24-h urine was not different between the groups (Fig. 4). Furthermore, there was no difference in food intake, water intake, body weight or body composition between the groups (Table 4). Concentrations of total plasma ghrelin were different between the fasted and fed conditions within each group, but there was no difference between the groups (data not shown). Insulin sensitivity, measured by the glucose tolerance test, was not different between the groups (data not shown).

Fig. 4 2,3-Dinor-8-isoprostaglandin F2 in urine (values are means, with standard errors) of rats fed the intervention diets for 7 d. H-AGE, diet higher in advanced glycation end products; L-AGE, diet lower in advanced glycation end products; LMW, low molecular weight.* P<0·05 compared with control.
Table 4 Total food intake, water intake, body weight gain, lean mass gain and fat mass gain of rats fed the intervention diets for 14 d (Mean values with their standard errors)
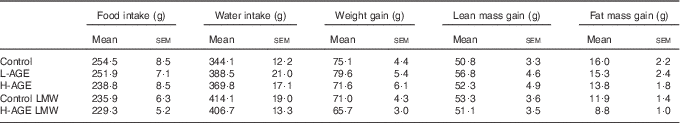
L-AGE, diet lower in advanced glycation end products; H-AGE, diet higher in advanced glycation end products; LMW, low molecular weight.
Discussion
The lysine-derived CML is a widely used marker for AGE in both food and biological samples and as such representative of formation of AGE from lysine( Reference Ames 14 ). The content of CML in the diet corresponded with the proportion of heat-treated milk powder in each diet. The amount of CML recovered in urine was independent of molecular weight of the milk powder, indicating that HMW and LMW CML are absorbed and excreted to a comparable extent. The higher urinary excretion of MG-H1 in both the LMW diets suggests some changes in the AGE content of the diets induced by the hydrolysis. This is confirmed by the dicarbonyl content of the different forms of milk powder; the dicarbonyls were formed not only by heating but also by hydrolysis followed by spray drying. As dicarbonyls are AGE precursors, they could potentially induce AGE formation in the food or endogenously if absorbed. They have been found in commonly consumed food( Reference Degen, Hellwig and Henle 12 ), but knowledge of their bioavailability and importance is scarce. A recent study suggested a limited absorption of methylglyoxal( Reference Degen, Vogel and Richter 15 ).
We found an increased expression of RAGE and AGER1 in whole blood in the H-AGE LMW group compared with the control, L-AGE and H-AGE groups. As RAGE and AGER1 are players in opposing pathways, this finding is consistent with the unchanged physiological and biochemical responses observed. It has been suggested that long-term exposure to a H-AGE diet will lead to depletion of AGER1 and consequently compromise the body’s innate defences( Reference Vlassara and Striker 5 , Reference Cai, He and Zhu 16 , Reference Vlassara, Cai and Goodman 17 ); however, direct evidence for the independent interactions of specific AGE with these receptors and proof of their downstream effects have long remained a point of controversy( Reference Thornalley 18 ) and are still unresolved( Reference Poulsen, Hedegaard and Andersen 2 ). Some authors have only observed inflammatory responses of AGE-modified proteins when they were combined with endotoxins( Reference Valencia, Mone and Koehne 19 ). Whether longer-term exposure to the H-AGE LMW diet would lead to depletion of AGER1 and subsequently increased low-grade inflammation and oxidative stress is therefore an open question that needs to be tested in a well-controlled setting. On the basis of dietary and urinary content, CML seems to be unrelated to our findings, which is consistent with the limited evidence for a pathogenic role of CML( Reference Thorpe and Baynes 20 ). The H-AGE LMW group had the highest urinary excretion of MG-H1, although only significantly different from the control group. The urinary excretion of MG-H1, but not CML, was significantly correlated with the expression of AGER1 as well as RAGE. That MG-H1 may be among the more bioactive AGE in vivo has been indicated in studies where mice fed highly methylglyoxal-modified bovine serum albumin (BSA) had increased circulating markers of oxidative stress and insulin resistance( Reference Cai, He and Zhu 21 , Reference Cai, Ramdas and Zhu 22 ); however, evidence with methylglyoxal-modified proteins more similar to those encountered in human foods are needed to support our findings. The higher urinary excretion of MG-H1 following enzymatic hydrolysis of the food proteins may be explained by MG-H1 being formed from precursors activated by the process of hydrolysis or by LMW AGE being absorbed from the food to a larger extent, or both.
The effects observed in the study may clearly relate to other factors affected by heating the milk powder component, including loss of nutrients on heating or formation of non-AGE pyrolysis products. As the diet contained 80 % standardised chow with a fairly high content of all nutrients, we find it unlikely that vitamin or mineral losses affected our results. However, it is well documented that many other products than AGE form upon heating of food and this may have affected our findings.
Previous studies have shown that RAGE and AGER1 expression in the liver, kidney, spleen, heart, vascular tissue, skeletal muscle and white adipose tissue are influenced by heated foods or by highly AGE-modified proteins( Reference Cai, He and Zhu 16 , Reference Cai, He and Zhu 21 – Reference Lin, Choudhury and Cai 24 ). In the present study, it was observed that RAGE and AGER1 were up-regulated in whole blood after only 2 weeks of dietary intervention with heat- and protease-treated milk powder. No changes were observed in any of the other tissues investigated, except small differences in the pancreas. In the intestine, the expression of RAGE is low( Reference Brett, Schmidt and Yan 25 ). However, RAGE-mediated signal transduction in Caco-2 cells has been shown by incubation with CML-modified proteins having a high degree of modification( Reference Zill, Gunther and Erbersdobler 26 ). Thus, as the intestine is exposed to large amounts of dietary AGE or to a very highly modified AGE-protein preparation, an increased expression of RAGE in the intestinal mucosa due to dietary AGE could potentially contribute to an inflammatory response. We did not find such a change in intestinal expression, neither of RAGE nor of AGER1 between the groups, and RAGE expression was very low in all segments of the intestine of all groups. This may be related to low endotoxin levels in the standard chow, to the short duration of the study or to the lower and probably more natural level of AGE modification used in our study. The modification was approximately 250–500-fold lower – that is, 125–250 mg total CML+CEL/kg protein in our study v. 65 400 mg CML/kg protein in the Caco-2 study( Reference Lin, Choudhury and Cai 24 ) and even twice as much in the studies by Cai et al.( Reference Cai, He and Zhu 21 , Reference Cai, Ramdas and Zhu 22 ). High modification levels may decrease enzymatic degradation of AGE proteins in the large intestine leading to lower uptake and increased excretion but it may also lead to LMW products that are dissimilar from those encountered in normal heat-treated foods and that may therefore have other biological actions.
Previous animal studies have found adverse effects of H-AGE diets on insulin sensitivity, inflammation and oxidative stress( Reference Cai, He and Zhu 16 , Reference Cai, He and Zhu 21 , Reference Cai, Ramdas and Zhu 22 , Reference Hofmann, Dong and Li 27 , Reference Sandu, Song and Cai 28 ); all of these studies were of considerably longer duration than our study and all but one( Reference Hofmann, Dong and Li 27 ) used highly modified AGE proteins. We found no effect of the intervention on measures of insulin sensitivity, inflammation or oxidative stress, which might reflect that our study examined short-term effects. These previous studies either heat-treated the whole diet or added methylglyoxal-modified BSA to the diet, which differs from our method of supplementing the diet with heated milk powder. Similar to our results, a long-term study in diabetic rats found no adverse effects of dietary AGE on oxidative stress( Reference Chuyen, Arai and Nakanishi 29 ). These rats were given a diet consisting of 20 % glycated casein and soya proteins with about 50 % of lysine residues modified( Reference Chuyen, Arai and Nakanishi 29 ) – that is, an extremely high level of modification. CML is a major AGE formed from the lysine residues in casein, as was also seen when heating the milk powder (containing casein) in our study. The high intake of CML in that long-term study as well as in our short-term study did not result in any noticeable physiological changes, which underlines the above discussion indicating a limited biological importance of CML as such despite its widespread use as a marker of the Maillard reaction( Reference Thorpe and Baynes 20 ). For other specific AGE, there is no enough evidence to evaluate their specific actions. As already mentioned, this is a point of controversy that needs to be addressed by experiments with well-defined diets containing specific AGE-modified proteins with modification levels more realistic to those in human diets.
As AGE are related to formation of flavour and aroma compounds by the Maillard reaction, we investigated the food intake closely in all the groups, but we did not observe any differences. Neither did we find a difference in plasma ghrelin concentrations postprandially nor during fasting, which is consistent with the similar food intake in all the groups. Some studies have found that mice and rats on H-AGE diets gain more body weight than controls on a L-AGE diet, despite similar food intake( Reference Cai, He and Zhu 16 , Reference Cai, Ramdas and Zhu 22 , Reference Hofmann, Dong and Li 27 , Reference Sandu, Song and Cai 28 , Reference Sebekova, Hofmann and Boor 30 ), but this is not supported by all studies( Reference Lin, Choudhury and Cai 24 , Reference Chuyen, Arai and Nakanishi 29 , Reference Feng, Hou and Liang 31 , Reference Peppa, He and Hattori 32 ). In the short course of our study, we did not find any differences in body weight or body composition between the groups.
In conclusion, the H-AGE LMW diet increased excretion of MG-H1 and was most efficient in up-regulating the expression of AGER1 in whole blood after 2 weeks. However, this 2-week intervention did not affect expression in any other organs or affect markers of inflammation, insulin sensitivity or oxidative stress. Thus, the effects of dietary AGE and especially of CML seem to be limited under short-term conditions and may also depend on the degree of protein modification by AGE in the food.
Acknowledgements
The authors thank personnel at Rodent Metabolic Phenotyping Center for technical assistance. This study was carried out as a part of the research programme of the UNIK: Food, Fitness & Pharma for Health and Disease (see www.foodfitnesspharma.ku.dk).
The authors contributed to this publication as follows: M. W. P., J. M. A., R. V. H., A. N. M., J. N., B. H., L. H. S., L. H. L. and L. O. D. planned the study; J. M. A., M. W. P., J. N. and L. O. D. developed and performed the AGE analyses; R. V. H. and L. H. S. developed the study foods; M. W. P., A. N. M., B. H. and L. O. D. conducted the animal study; B. N. K., M. W. P. and M. J. B. performed the gene expression analyses; R. M. and L. O. D. performed the isoprostane analyses; M. W. P. drafted the manuscript; all authors critically read and approved the final manuscript.
The UNIK project is supported by the Danish Ministry of Science, Technology and Innovation. Additional samples for collaboration are stored in the Copenhagen University Biobank for Experimental Research (see www.cube.ku.dk).
The authors declare that they have no conflicts of interest.


