


Few studies have attempted to establish the validity of tools that directly measure food intake. The use of an ad libitum buffet-style meal has previously been validated to measure energy intake (EI) inside a laboratory setting(Reference Arvaniti, Richard and Tremblay1). This method has been shown to have a very high reliability with an intraclass correlation (ICC) of 0·97 and a within-subject CV (CVws) of 10 % for total EI between two identical experimental sessions in fourteen men(Reference Arvaniti, Richard and Tremblay1). Another study later tested the reproducibility of a slightly different method in fifty-five men who were given ad libitum access to one meal item (a mixed hot-pot meal containing pasta, vegetables, minced meat and cream) at lunch time on two separate occasions in a controlled laboratory setting(Reference Gregersen, Flint and Bitz2). A slightly lower ICC (r 0·86) with similar CVws (8·9 %) to those reported by Arvaniti et al. (Reference Arvaniti, Richard and Tremblay1) was noted. In a study using refrigerated vending machines to measure ad libitum EI inside a laboratory setting(Reference Silverstone, Fincham and Brydon3), CVws for EI over 1·5 h at lunch time on four separate occasions was found to be 6·3 % in five women(Reference Silverstone, Fincham and Brydon3). While each one of these methods has shown a good reproducibility, they have only investigated the measurement of energy and macronutrient intakes over a short period of time (one meal) and they do not offer a very large variety of hot meal-type foods, which may be encountered by the participants under free-living conditions.
Although these methods employed to directly measure EI have been shown to be reproducible under controlled laboratory conditions, they have not been evaluated outside of the laboratory setting. Food records have previously been validated in order to measure EI outside of the laboratory setting(Reference Bingham, Cassidy and Cole4). However, the complexity and inconvenience related to the description and measurement of each food and beverage consumed is often associated with a poor compliance, and thus may lead to a certain degree of under-reporting and/or under-eating(Reference Schoeller5). To make matters more complex, under-reporting has also been found to be associated with many factors, such as adiposity level, body size, dietary restraint and socio-economic status(Reference Lichtman, Pisarska and Berman6–Reference Lafay, Basdevant and Charles9). As such, the limitations associated with self-reporting of energy and macronutrient intakes(Reference Schoeller5, Reference Johnson10) warrant the investigation of tools that are able to capture the volatility of food intake more accurately outside of the laboratory setting. One study has previously attempted to validate and measure ad libitum protein intake under free-living conditions in sixty-five obese men and women who were given access to a food store that offered 900 food and beverage items(Reference Skov, Toubro and Raben11). This study did demonstrate a high level of agreement in protein intake between the first and second half of the intervention. However, even if it was assumed that carbohydrate and dietary fat intakes did not vary much between the two parts of the intervention, this study only objectively captured protein intake.
The objectives of the present study were thus twofold. The first objective was to evaluate the reproducibility of a food menu to measure food intake over several meals (two meals and snacks over 5 h). The second objective was to compare the reproducibility of this food menu between in-laboratory sessions (ILS) and out-of-laboratory sessions (OLS). A secondary objective was to evaluate sex differences in energy and macronutrient intakes because not many studies have investigated the reproducibility of tools that may be used for the measurement of total EI in men and women together. We hypothesised that energy and macronutrient intakes over several meals (two meals and snacks over 5 h) would be reliable and reproducible in men and women.
Experimental methods
Participants
A total of eight women and eight men completed three ILS and three OLS testing sessions. Participants were individually interviewed to evaluate whether they met the study's inclusion criteria: (1) over the age of 18 years; (2) stable weight ( ± 2 kg) within the past 6 months; (3) non-smokers; (4) no drug and alcohol abuse. Women were tested during the follicular phase of the menstrual cycle and at least 7 d separated each testing session. The study was conducted according to the guidelines laid down in the Declaration of Helsinki and all the procedures involving human participants were approved by the University of Ottawa Ethics Committee. Written informed consent was also obtained from all participants.
Body composition
Body weight was measured to the nearest 0·1 kg using a BWB-800AS digital scale and standing height was measured to the nearest centimetre using a wall stadiometer, Tanita HR-100 height rod, without shoes (Tanita Corporation of America, Inc.) before the start of each testing session, when participants were fasting. Body composition was measured using dual-energy X-ray absorptiometry (GE-LUNAR Prodigy module; GE Medical Systems) on one occasion, once all testing sessions were completed. The CV and correlation for the percentage of body fat measured in twelve healthy participants tested in our laboratory were 1·8 % and r 0·99, respectively.
Design and procedure
Participants were asked to come to the laboratory for six sessions divided into three ILS and three OLS. The order of the sessions was not randomised. In fact, when we started the study, we had initially decided to test our food menu for two consecutive sessions in the laboratory only. Soon after we had begun testing, we slightly modified the study design to include a third ILS and also decided to add the three OLS as well. This is the reason why the sessions were not randomised. It should be noted that no differences in EI were noted across all sessions based on the session at which participants started the study (results not shown). During the ILS, participants were in a room with a desk and a chair, a television and most participants brought and used their own laptop computer. They were allowed to perform any type of sedentary activities while in that room. As for the OLS, no restrictions were given with regard to the amount and types of activities that the participant could perform. However, they were instructed to only eat items that were found in the lunch boxes throughout the 5 h session. The participants arrived at the laboratory following a 12 h overnight fast. They had been instructed not to consume any alcohol or to engage in any type of structured physical activity (e.g. playing sports or training) for at least 24 h before the start of testing.
Energy intake assessment – in-laboratory and out-of-laboratory sessions
Total energy and macronutrient intakes were measured by the use of an ad libitum food menu (Appendix 1). A total of sixty-two items were provided on the menu in order to ensure that a sufficient amount of hot meals, breakfast items, snacks, fruits, vegetables and beverages were made available to the participant. This menu was mainly based on the items provided in the Arvaniti et al. (Reference Arvaniti, Richard and Tremblay1) buffet, while some breakfast and hot-meal items were added in order to study the reproducibility of this tool over 5 h. During the ILS, this food menu was presented to the participants every hour, for 5 h (08.00–13.00 hours). Every hour, the participants could choose the types of foods and beverages from the menu that they wanted to consume at that time. During the OLS, the participants were given the same food menu at 08.00 hours and were asked to choose the types of foods and beverages that they wanted to consume over the next 5 h (until 13.00 hours). The food items were then packed into plastic containers, while the beverages were packed into plastic bottles. These containers and bottles were then placed into a portable cooler for the participants to bring with them. They were also asked to bring back all leftovers, wrappings and peels and to put them into their original containers when applicable. In both cases, two portions of each of the food and beverage items selected were prepared and served or packed into the portable cooler for the participants. The specific quantity (portions) of each food and beverage item provided/served to the participants is presented in Appendix 1. The participants were then given the instructions to ‘eat as little or as much as you want’. The chosen and prepared food items were weighed to the nearest gram before serving (ILS) or before being put into coolers (OLS) using an electronic scale (Scout Pro SP2001; Ohaus Corporation), and after the allocated 30 min time period (ILS) or after the coolers were brought back to the laboratory (OLS). The macronutrient composition of foods and beverages consumed was determined and analysed with Food Processor SQL software (version 9.6.2; ESHA Research).
Pleasantness of the foods
During the three OLS, all participants were asked to draw a vertical line on a 150 mm visual analogue scale, reflecting their appreciation for all foods and beverages that they consumed during these experimental sessions. The question asked on each visual analogue scale was: ‘How pleasant is the taste of this food?’ The pleasantness rating of each item on the food menu was performed in order to determine whether the participants enjoyed/liked the foods and beverages consumed. Lastly, these ratings also served in determining whether items on the food menu should be removed and/or replaced due to low pleasantness ratings for future studies.
Statistical analyses
Statistical analyses were performed using SPSS software (version 17.0; SPSS, Inc.). An independent t test was done in order to determine whether any significant differences in participant characteristics existed between men and women. A two-way repeated-measures ANOVA was used (PROC MIXED) to determine the main effects of the sessions (ILS and OLS) and sex on the components of dietary intake (total amount of energy (kJ), protein (kJ), carbohydrate (kJ) and dietary fat (kJ) during the ILS, the OLS as well as for the combination of the six sessions). In addition, a repeated-measure ANOVA was used (PROC MIXED) to determine the main effects of the session on the distribution of total EI (main meal, snack and beverage intakes) over the course of the ILS, OLS and the combination of the six sessions. ANOVA and Bonferroni tests were also used to evaluate where significant differences existed when looking at the distribution of total EI. ICC and CVws were calculated for energy and macronutrient intakes for the ILS, OLS as well as the combination of all six experimental sessions. The pleasantness ratings of the foods consumed are presented as the mean obtained for all foods and beverages chosen and consumed during the OLS sessions for all sixteen participants. Values are presented as means and standard deviations. Differences with P values < 0·05 were considered statistically significant.
Results
Characteristics of participants
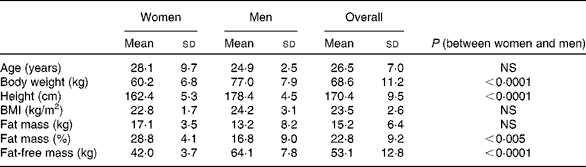
The characteristics of the participants are shown in Table 1. As expected, there was a significant difference in body weight, height, percentage of fat mass and fat-free mass between women and men. No significant differences were, however, found between men and women with regard to their age, BMI and fat mass (kg). Body weight was also stable across the six experimental sessions in men (77·0 (sd 7·9), 77·4 (sd 8·4), 76·8 (sd 8·9), 77·5 (sd 8·6), 77·4 (sd 8·5), 77·0 (sd 8·8) kg; P = NS) and women (60·0 (sd 6·7), 60·1 (sd 6·4), 60·0 (sd 6·7), 60·1 (sd 6·5), 59·4 (sd 6·3), 59·4 (sd 6·1) kg; NS). Although it is understood that energy balance can be substantially altered before any changes in energy reserves and body weight can actually be picked up, body weight measured at the beginning of each session was used as a gross proxy of weight stability and energy balance.
Table 1 Characteristics of women (n 8), men (n 8) and all participants (n 16)
(Mean values and standard deviations)
Energy and macronutrient intakes
Table 2 presents the results for energy and macronutrient intakes across the three ILS and three OLS. No significant differences were noted for total EI, carbohydrate, dietary fat and protein intakes between the three ILS and three OLS. When all six sessions were analysed (three ILS and three OLS), no significant differences were observed for energy and macronutrient intakes. The power for the analyses of energy, carbohydrate, dietary fat and protein intakes over two meals and snacks over 5 h was 0·24, 0·16, 0·33 and 0·11, respectively. Additionally, the estimate of effect size was extremely low for the same analyses (estimate of effect size = 0·05, 0·03, 0·06 and 0·02 for energy, carbohydrate, dietary fat and protein intakes, respectively).
Table 2 Energy (EI) and macronutrient intakes for each session in all participants (n 16)
(Mean values and standard deviations)
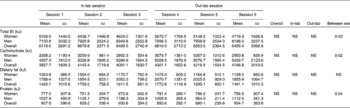
In-lab, in-laboratory; out-lab, out-of-laboratory.
No significant interactions were noted between sessions and sex for EI, carbohydrate and dietary fat intakes (data not shown). However, a significant interaction was noted between sessions and sex for protein intake (P < 0·05) only. As expected, the present results also revealed that total energy, carbohydrate and protein intakes were significantly higher in men when compared with women (Table 2). However, no significant difference was noted for dietary fat intake between sexes.
Distribution of energy intake over the course of the six sessions
The distribution of EI across the experiment was also investigated. We subdivided the foods and beverages found on the menu into main meals, snacks, energy beverages and water. The categorisation of each item is presented in Appendix 1 and is based on the type of food or beverage, and does not take into account the time at which the foods were consumed since participants were able to choose any item on the food menu, at any time. As shown in Fig. 1, no significant differences were noted for EI (kJ) of main meals and snacks during the three ILS, three OLS and all six sessions. However, a significant difference in energy beverage intake was noted across the six sessions (P < 0·01), even though no significant differences were noted in the latter between the three ILS and three OLS. Indeed, significant differences were found between session 3 of the ILS and sessions 2 (P < 0·05) and 3 (P < 0·05) of the OLS. A significant difference was seen for water consumption (g) across the sessions (565·1 (sd 270·0), 517·1 (sd 289·7), 626·7 (sd 356·6), 524·1 (sd 300·0), 528·2 (sd 317·2), 370·8 (sd 271·2) g; P < 0·01). More specifically, this difference was observed between the last sessions of the ILS and OLS (P < 0·05). Additionally, a significant difference in water consumption was noted during the OLS (P < 0·05).

Fig. 1 Distribution of energy intake (EI, kJ) as main meals (■), snacks (![]() ) and energy beverages (□) over the course of each session. Values are presented as means for eight women and eight men, with standard errors of the mean represented by vertical bars. * Mean values were significantly different in energy beverage intake between session 3 and sessions 5 (P < 0·05) and 6 (P < 0·05). In-lab, in-laboratory; out-lab, out-of-laboratory.
) and energy beverages (□) over the course of each session. Values are presented as means for eight women and eight men, with standard errors of the mean represented by vertical bars. * Mean values were significantly different in energy beverage intake between session 3 and sessions 5 (P < 0·05) and 6 (P < 0·05). In-lab, in-laboratory; out-lab, out-of-laboratory.
Intraclass correlations and CV
The ICC observed for total EI during the ILS, OLS and over the course of the six sessions are r 0·77 (P < 0·0001), r 0·85 (P < 0·0001) and r 0·82 (P < 0·0001), respectively (Table 3). However, when excluding two participants (one man and one woman) who were outliers based on their high CVws (+2 sd from the mean), the calculated ICC (n 14) for total EI increased to r 0·82 (P < 0·0001) for the ILS, r 0·89 (P < 0·0001) for the OLS and r 0·86 (P < 0·0001) for the six sessions. As for macronutrient intake (n 14), the ICC for carbohydrates, dietary fat and protein intakes were r 0·85 (P < 0·0001), r 0·56 (P < 0·0001) and r 0·86 (P < 0·0001) for the ILS; r 0·88 (P < 0·0001), r 0·77 (P < 0·0001) and r 0·81 (P < 0·0001) for the OLS; and r 0·86 (P < 0·0001), r 0·70 (P < 0·0001) and r 0·81 (P < 0·0001) for the six sessions.
Table 3 Intraclass correlations (ICC) in all participants (n 16)
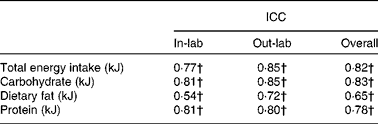
In-lab, in-laboratory; out-lab, out-of-laboratory.
† P < 0·0001.
Additionally, when the CVws were investigated, analyses revealed a CVws of 18·3 (sd 10·0) % for the ILS, a CVws of 16·1 (sd 10·3) % for the OLS as well as a CVws of 17·2 (sd 8·0) % for the combination of the six sessions for total EI. As for macronutrient intake, CVws for carbohydrate, dietary fat and protein intakes were, respectively, 17·3 (sd 8·3), 34·8 (sd 15·8) and 17·5 (sd 10·7) % for the ILS; 14·7 (sd 9·4), 34·8 (sd 22·3) and 14·7 (sd 11·4) % for the OLS; 16·3 (sd 6·8), 35·1 (sd 14·1) and 17·4 (sd 7·5) % for the six sessions. When excluding the two outlier participants, the CVws decreased to 16·5 (sd 9·3) % for the ILS, 14·9 (sd 10·0) % for the OLS and 15·8 (sd 7·6) % for the combination of the six sessions for total EI. The CVws for all components of macronutrient intake also slightly decreased after controlling for outliers, where CVws for carbohydrate, dietary fat and protein intakes were, respectively, 16·1 (sd 7·5), 32·0 (sd 14·0) and 16·2 (sd 10·9) % for the ILS; 13·7 (sd 8·0), 30·9 (sd 19·7) and 15·8 (sd 11·7) % for the OLS; 15·2 (sd 6·5), 32·0 (sd 12·1) and 17·3 (sd 8·0) % for the six sessions. Furthermore, the average pleasantness of the foods that were actually eaten and rated by all participants during the three OLS sessions was calculated to be 124 (sd 14) mm on a scale of 150 mm, which represented an average rating of 83 % (Appendix 1).
Discussion
Given the limitations associated with the measurement of food intake, we aimed to determine the reproducibility of a food menu that includes a large variety of meal-type foods, beverages and snacks (sixty-two items in total) in order to measure total energy and macronutrient intakes during breakfast, mid-morning and lunch for three ILS and three OLS. We hypothesised that the energy and macronutrient intakes over several meals (two meals and snacks over 5 h) would be reproducible in men and women. The present results show no significant differences in our three ILS and three OLS as well as for the combination of these six sessions, as far as EI and macronutrient intakes are concerned. No significant interactions were noted between sex and experimental sessions for EI, carbohydrate and dietary fat intakes, while a significant interaction was found for protein intake between sexes over time. We also reported a good ICC and a relatively good CVws for total EI, while the reproducibility for macronutrient intake, especially dietary fat, was lower. Food items on the menu were overall well appreciated as participants rated them highly on a visual analogue scale (83 %).
The present data show that there are no significant differences for energy and macronutrient intakes over the course of the ILS, OLS and all six sessions. In fact, this suggests that there is no more variation within each environment than there is between them. In addition, when investigating the present data with regard to sex, while significant differences were noted between men and women, where men consumed a larger quantity of food, no interactions, except for protein intake, were noted between sex and each experimental session. Even though a significant interaction was noted between sex and sessions for protein intake only, no significant differences were observed in protein intake over time when analysing men and women separately. This suggests that within the variations shown for this measurement, this tool can be used in men or women as well as within and outside the laboratory setting. When looking at the distribution of EI, even though no significant differences were noted in main meal and snack intakes, significant differences were indeed noted in energy beverage and water intakes across the sessions. Water intake was higher during the last session of the ILS in comparison with the last session of the OLS, while energy beverage intake was higher during the second and third OLS in comparison with the last session of the ILS. Based on these results, it may be assumed that when participants consumed more water, energy beverage intake was decreased and vice versa. Certain studies(Reference Flood, Roe and Rolls12, Reference DellaValle, Roe and Rolls13) have noted an increase in total EI when participants consumed more energy from energy beverages. However, the increases in energy beverage intakes during sessions 2 and 3 of the OLS, in comparison with session 3 of the ILS, in the present study did significantly influence total EI values. Finally, it can be hypothesised that a decrease in water intake may be related to an increase in the intake of water contained in foods. This was, however, not analysed because the quantity of water contained in each food was not available from the software that we used.
The present results also demonstrated positive and significant ICC for total EI during the ILS, the OLS and for the six sessions. The ICC values obtained in the present study are lower than the ICC of 0·97 obtained by Arvaniti et al. (Reference Arvaniti, Richard and Tremblay1) but are similar to the ICC of 0·86 presented by Gregersen et al. (Reference Gregersen, Flint and Bitz2). It could be argued that the buffet-style meal used by Arvaniti et al. (Reference Arvaniti, Richard and Tremblay1) was only presented to the participants on one single occasion and this buffet, even if it does provide a wide variety of foods, does not offer any hot food items. Along these lines, Gregersen et al. (Reference Gregersen, Flint and Bitz2) provided a mixed hot-pot meal but, in this case, the EI was only considered for one meal on two separate occasions. A novel aspect of the present study is that nine hot meal-type options were made available from the food menu (Appendix 1) along with most of the items provided in the Arvaniti et al. (Reference Arvaniti, Richard and Tremblay1) buffet. In addition, our food menu was investigated over several episodes (breakfast, mid-morning and lunch) of feeding as opposed to a single-sitting measure of EI. While we believe that the food menu that was investigated in the present study provides distinctive benefits, we must concede that it is not as reproducible and sensitive as single-sitting measures of EI.
With regard to the CVws values noted in the present study, these are slightly lower than the CVws of 23 % noted by Bingham et al. (Reference Bingham, Gill and Welch14), obtained with weighed food records over 4 d on four different occasions (total of 16 d). Studies using direct measurements with single-meal designs have reported CVws between about 6 and 10 %(Reference Arvaniti, Richard and Tremblay1–Reference Silverstone, Fincham and Brydon3). These differences are probably explained by the use of single-meal designs, a lower number of food items offered, and possibly because food intake was measured in the laboratory. Although many studies have measured appetitive and food intake responses to manipulations such as knowledge-based work(Reference Chaput, Drapeau and Poirier15, Reference Chaput and Tremblay16), exercise(Reference Pomerleau, Imbeault and Parker17) and functional foods(Reference Yoshioka, Doucet and Drapeau18, Reference Major, Alarie and Dore19) with single-meal designs, it should be noted that compensation to dietary(Reference Hubert, King and Blundell20, Reference King21) and exercise(Reference Stubbs, Sepp and Hughes22–Reference Whybrow, Hughes and Ritz24) manipulations is often delayed(Reference King21). As such, the validation of a tool that measures food and beverage intake over multiple meals including snacks may provide a more accurate image of the true effect of such manipulations on EI. It is nevertheless important to note that the measurement of energy and macronutrient intakes over the course of multiple meals and multiple days instead of two meals, as in the present study, would have probably been even more revealing. It would thus be ideal to test this food menu for a more prolonged period to determine whether its reliability would increase under such conditions. In considering such a study, it would be important to weigh the logistical aspects of administration and the cost against the added precision of this tool.
Although some studies have provided foods to participants for consumption outside of the laboratory setting(Reference Westerterp, Verboeket-van de Venne and Bouten25–Reference van het Hof, Weststrate and van den Berg28), to our knowledge, none has tried to study the reproducibility of these tools for measurements of total EI and all macronutrient intakes under free-living conditions. Moreover, the investigation of the same tool both inside and outside of a laboratory setting has never been done before, and the results in the present study indicate that the environment in which the participants consumed the foods and beverages provided to them did not greatly affect their total energy and macronutrient intakes. As such, the reproducibility of our food menu outside and inside of the laboratory setting provides convenience and ecological validity to our tool. However, this tool is accompanied by limitations when used outside of the laboratory, including the fact that it does not offer the certainty that only the foods that were provided were eaten, as is the case when it is used in the laboratory. Although not performed in the present study, adding a follow-up questionnaire to verify whether only foods from the lunch boxes were consumed could help control for this possibility. Additionally, the activities performed by the participants during the OLS were not assessed or restricted. As such, adding an objective measure of participants' physical activity participation outside of the laboratory during the measure of food intake could also help to better understand some of the observed differences.
Furthermore, although the reproducibility of carbohydrate and protein intakes from our food menu was relatively good, it was much less the case for dietary fat. As such, certain studies have found higher variation ratios for fat intake, in comparison with carbohydrate and protein intakes(Reference Beaton, Milner and McGuire29–Reference Ogawa, Tsubono and Nishino32) when measured over time. Cai et al. (Reference Cai, Shu and Hebert33) even noted a CVws of 65·3 % in fat intake (g/d) when evaluating data measured over 24 d evenly distributed over 1 year, using 24 h diet recall interviews. This CVws was also higher than the CVws for carbohydrate (29·5 %) and protein (37·5 %) intakes measured over this same time period. When comparing the mean difference in macronutrient intakes using food diaries v. food questionnaires, higher differences were also noted in fat intake (25 %), when compared with protein (5 %) and carbohydrate (4 %) intakes(Reference Roddam, Spencer and Banks34). Based on these findings, it may be safe to say that dietary fat intake seems to be more variable than other macronutrients, supporting the idea that dietary fat intake may not be as reproducible over time.
Finally, the present findings are limited to a small normal-weight population, in which case only eight men and eight women were tested. It is thus not surprising to see that the power was low for energy, carbohydrate, dietary fat and protein intakes over several meals. However, as mentioned in the results, the estimate of effect size was also very low for these analyses, indicating that increasing the number of participants would have very likely led to the same results for our primary outcomes. In addition, these results should be interpreted in light of the characteristics of the participants who took part in the present study. Future studies should look into the reproducibility of this tool in populations with different characteristics, such as age and BMI.
Overall, the present results suggest that the food menu investigated in the present study is a reproducible tool that can be used to measure energy and macronutrient intakes under the conditions described in the present study. However, these results also emphasise the difficulties in capturing a stable measure of EI, which is most probably due to the fact that this variable, although relatively stable over long periods of time, presents relatively high day-to-day variations. It is also suggested that both men and women respond similarly with regard to energy and macronutrient intakes, meaning that the reproducibility of this tool is not seemingly affected by the sex of the individual. Future studies should try to find the ideal time frame for the measurement of total EI to obtain stability of the measurement while not making the tool too cumbersome and costly for experimental use.
Acknowledgements
The authors would like to thank the participants for their devoted participation. É. D. is a recipient of a CIHR/Merck-Frosst New Investigator Award, CFI/OIT New Opportunities Award and of an Early Research Award. M.-È. R. is a recipient of the Frederick Banting and Charles Best Doctoral Award (CIHR). J. M. is a recipient of an Ontario Graduate Scholarship. É. D., M.-È. R. and J. M. designed the research; M.-È. R., J. M., S. C. and S. R. collected the data; M.-È. R. and J. M. analysed the data; M.-È. R., J. M. and É. D. wrote the manuscript. All authors critically appraised and approved the final version of the manuscript. The authors declare that they have no conflict of interest.
Appendix 1 Energy content and macronutrient composition of the items found on the food menu*

NA, no data on pleasantness rating were obtained during the out-of-laboratory sessions for these food items; BBQ, barbecue.
* Energy, protein, dietary fat and carbohydrate contents are based on information found on the food labels while fruits and vegetables are based on information found in the Food processor SQL program.
† These items were only offered during the in-laboratory sessions.
‡ 1000 ml were given in the OLS over 5 h.


