


The number of cases of dementia is increasing in both developing and developed countries and is predicted to rise from 24·3 million in 2001 to 42·3 million in 2020 and again to 81·1 million by 2040( Reference Rizzi, Rosset and Roriz-Cruz 1 ). Just over one in twelve (8·1 %) individuals aged 65 years or over has dementia and one in five (20·6 %) has cognitive impairment without dementia( Reference Prencipe, Santini and Casini 2 ). The global age-standardised prevalence of obesity doubled from 6·4 % in 1980 to 12·0 % in 2008, whereas the prevalence of overweight increased from 24·6 to 34·4 % during the same 28-year period( Reference Stevens, Singh and Lu 3 ).
In adults aged 19–65 years, cross-sectional studies suggest that the overweight perform worse on tests of semantic memory, visuospatial ability( Reference Nilsson and Nilsson 4 ) and executive function( Reference Gunstad, Paul and Cohen 5 – Reference Lokken, Boeka and Yellumahanthi 7 ) compared with normal-weight participants. Prospective studies have observed lower cognitive scores and greater cognitive decline in obese v. normal-weight participants, with fastest decline in those with both obesity and metabolic abnormality( Reference Singh-Manoux, Czernichow and Elbaz 8 ). Furthermore, a 27-year longitudinal population-based study observed that obesity in middle age increased the risk of future dementia independently of co-morbid conditions( Reference Whitmer, Gunderson and Barrett-Connor 9 ).
In older adults aged ≥65 years, the association between adiposity and cognitive function is less clear. The Neurological Diseases in Central Spain (NEDICES) study observed that obese/overweight status was associated with the lowest quartiles on cognitive testing( Reference Benito-León, Mitchell and Hernández-Gallego 10 ). Other studies reported negative associations of obesity and cognitive function in those with a mean age of 72 years( Reference Smith, Hay and Campbell 11 ) and <70 years( Reference Yoon, Choi and Yu 12 ) and a positive association in those with a mean age above 73 years and those aged 70 years and over, respectively. Conversely, better performance was shown in overweight participants with a mean age of 73 years( Reference Kuo, Jones and Milberg 13 ) and overweight oldest old (75–90 years)( Reference Nilsson and Nilsson 4 ) as compared with normal-weight older participants. Comparison between studies is problematic, as most measured specific and different cognitive domains.
The aim of this study was to determine whether adiposity, estimated by BMI and waist:hip ratio (WHR), was associated with cognitive function (as defined by Mini-Mental State Examination (MMSE) score, Frontal Assessment Battery (FAB) and a detailed neuropsychological test battery – Repeatable Battery for the Assessment of Neuropsychological Status (RBANS)).
Methods
Study population
The study population comprised participants from the Trinity Ulster Department of Agriculture (TUDA) ageing cohort study. This was a large study of community-dwelling older Irish adults (≥60 years) recruited between 2008 and 2012 and designed to investigate nutritional factors, related gene–nutrient interactions and health and lifestyle factors in the development of chronic diseases of ageing (CVD, osteoporosis and dementia). A detailed description of the study population and recruitment has been published previously( Reference McCarroll, Beirne and Casey 14 – Reference Molloy, Pangilinan and Mills 16 ). In short, there were three disease-defined cohorts: cognitive impairment (cognitive), osteopenia/osteoporosis (bone) and hypertension (hypertensive). The cognitive cohort (RBANS score ≤80) consisted of 1699 participants who were recruited from general geriatric clinics and a day hospital at the Department of Medicine for the Elderly at St James’s Hospital, Dublin. The bone cohort consisted of 1394 participants who were recruited from a specialist bone health service at the Department of Medicine for the Elderly at St James’s Hospital, Dublin, with a diagnosis of osteoporosis or osteopenia (within 3 years of recruitment) as defined by standard WHO criteria (T score of ≤−2·5 and ≤−1·0 to >−2·5, respectively)( 17 ). The hypertensive cohort consisted of 2093 participants who were recruited from general practices in the catchment area of the Western and Northern Health and Social Care Trusts in Northern Ireland with a current diagnosis of hypertension verified by their general practitioners. Of the 5186 participants recruited, all those whose MMSE scores were <24 or missing were excluded (as their cognitive performance might bias the results) as were those with a missing BMI or WHR score, leaving a total of 4439 participants for this sub-study (Fig. 1). Ethical approval was granted by the relevant authorities in each jurisdiction: the Research Ethics Committee of St James’s Hospital and The Adelaide and Meath Hospital, Dublin, and the Office for Research Ethics Committees Northern Ireland (reference 08/NI/RO3113), with corresponding approvals from the Northern and Western Health and Social Care Trusts, Northern Ireland.
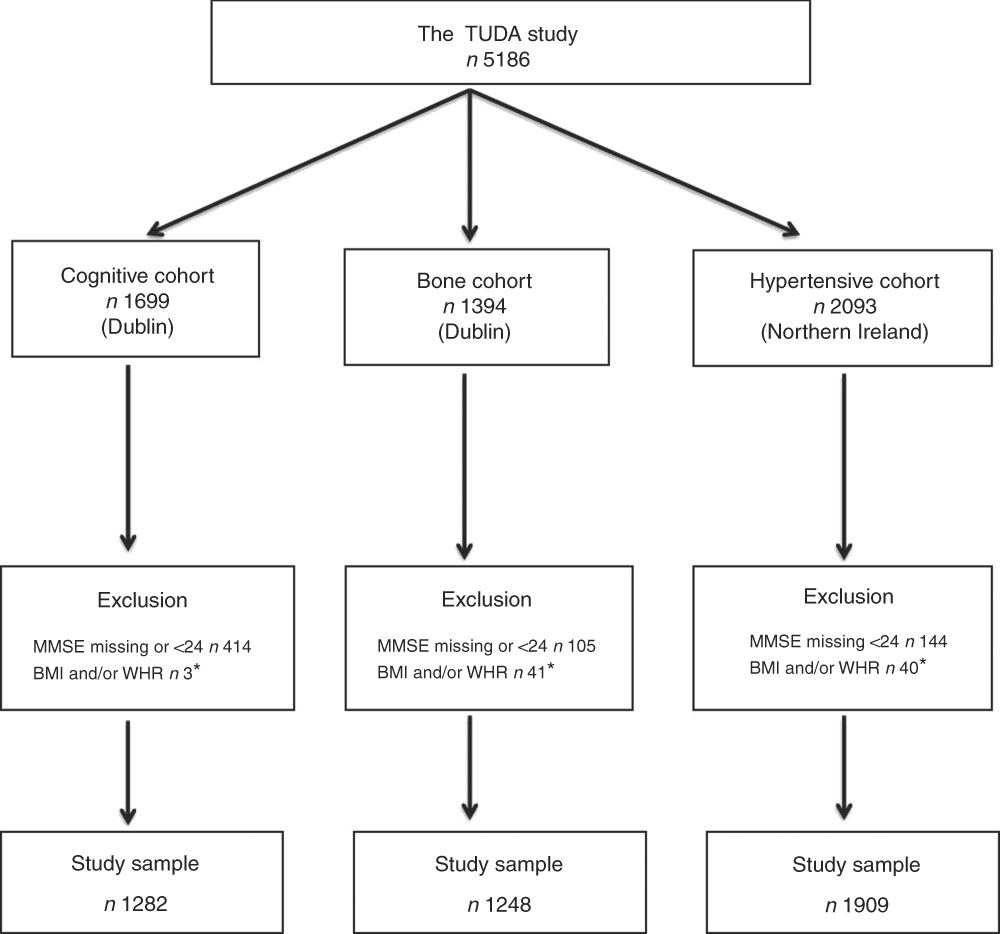
Fig. 1 The Trinity Ulster Department of Agriculture (TUDA) ageing cohort study population. MMSE, Mini-Mental State Examination; WHR, waist:hip ratio. * Missing or incomplete data.
Lifestyle and anthropometric information
Data associated with lifestyle factors were obtained by questionnaire and included sex, age, ethnicity, education and medical history (including medication use). Data that were recorded also included current smoking and alcohol intake, falls and psychosocial history. Anthropometric measurements included height to the nearest 0·01 m (using a wall-mounted stadiometer from Seca Ltd), weight to the nearest 0·01 kg (using electronic scales from Brosch Direct Ltd) and waist and hip circumference to the nearest 0·1 cm (using a flexible tape measure from Seca Ltd). BMI was calculated as weight (kg) divided by height (m2).
Cognitive and physical function measures
Cognitive assessment measures included MMSE, total FAB and RBANS. In all participants, MMSE( Reference Folstein, Folstein and McHugh 18 ) was performed. The FAB is a brief battery of six neuropsychological tasks designed to assess frontal lobe function( Reference Dubois, Slachevsky and Litvan 19 ). These include similarities (conceptualisation), lexical fluency (mental flexibility), motor series ‘Luria’ test (programming), conflicting instructions (sensitivity to interference), Go–No Go (inhibitory control) and prehension behaviour (environmental autonomy). A cut-off score of 12 on the FAB has a sensitivity of 77 % and a specificity of 87 % in differentiating between frontal dysexecutive type dementias and dementia of Alzheimer type. RBANS has five indices and a total scale( Reference Randolph, Tierney and Mohr 20 ) as follows: index I (immediate memory), index II (visuospatial/constructional ability), index III (language), index IV (attention) and index V (delayed memory). The Timed Up and Go (TUG) test( Reference Podsiadlo and Richardson 21 ) and the Lawton instrumental activities of daily living (IADL) scale( Reference Lawton and Brody 22 ) were used as measures of frailty.
Statistical analyses
Statistical analysis was performed using the Statistical Package for Social Sciences (version 23.0; SPSS UK Ltd). Demographic and cognitive variables were illustrated by descriptive statistics, including numbers and percentages, medians, ranges and mean values and standard deviations. The data were checked for normality, linear relationship, multivariate normality, multicollinearity, auto-correction, homoscedasticity and outliers, and the FAB score was log-transformed as it was skewed. Where appropriate, one-way ANOVA or the Wilcoxon signed rank test was used for continuous variables, whereas categorical variables were assessed by χ 2 analysis. Comprehensive Meta Analysis software was used to combine the results and provide a point estimate and assess heterogeneity. Multi-variable linear regression models were used for modelling the relationship between cognition and adiposity. Model 1 controlled for the covariates age, sex, education, frailty (TUG and IADL) and current and past smoking. The data were not adjusted for blood pressure, as one of our cohorts consisted of patients recruited on the basis of being hypertensive. To look at potential effect modifiers, three further analyses were pre-specified on the basis of the understanding of how adiposity might have negative consequences on cognition (i.e. insulin resistance, cerebrovascular damage and inflammation). In models 2, 3 and 4, HbA1C, cerebrovascular diseases (stroke and/or transient ischaemic attack) and C-reactive protein (CRP), respectively, were added to model 1.
Results
Interaction terms were graphed between cohorts (online Supplementary Fig. S1). There was an interaction between adiposity and cognitive tests by cohorts. Given the interaction, we analysed the data for the whole cohorts and then treated each cohort separately. Cohort characteristics are presented in Table 1. Participants in the cognitive cohort were about 10 years older than those in the other two cohorts, and were more frail with higher TUG, lower IADL and lower cognitive scores, with P<0·001.
Table 1 General characteristics of participants from the Trinity Ulster Department of Agriculture Ageing (TUDA) ageing cohort study (n 4439) (Numbers and percentages; mean values and standard deviations)

CRP, C-reactive protein; RBANS, Repeatable Battery for the Assessment of Neuropsychological Status; MMSE, Mini-Mental State Examination; FAB, Frontal Assessment Battery.
* One-way ANOVA test.
† χ 2 Test.
‡ Wilcoxon signed rank test.
§ n 4291.
Table 2 summarises the relationship between adiposity and cognitive function in all TUDA participants. WHR was negatively associated with cognitive function across all tests except FAB (log-transformed). BMI was positively associated with cognitive function across a number of cognitive tests except FAB (log-transformed). Tables 3–5 provide details regarding the results in the cognitive, bone and hypertensive cohorts, respectively.
Table 2 Association between adiposity and measures of cognitive function in the Trinity Ulster Department of Agriculture (TUDA) study (n 4439) (β-Coefficients with their standard errors)

RBANS, Repeatable Battery for the Assessment of Neuropsychological Status; WHR, waist:hip ratio; MMSE, Mini-Mental State Examination; FAB, Frontal Assessment Battery.
* Model 1: age, education (duration schooling), sex (male), BMI, WHR, current smoker, past smoker, Timed Up and Go, total instrumental activities of daily living.
† Model 2: model 1+HbA1C.
‡ Model 3: model 1+cerebrovascular diseases (transient ischaemic attack and/or stroke).
§ Model 4: model 1+C-reactive protein.
Table 3 Association between adiposity and measures of cognitive function in the Trinity Ulster Department of Agriculture (TUDA) cognitive cohort (n 1282) (β-Coefficients with their standard errors)

RBANS, Repeatable Battery for the Assessment of Neuropsychological Status; WHR, waist:hip ratio; MMSE, Mini-Mental State Examination; FAB, Frontal Assessment Battery.
* Model 1: age, education (duration schooling), sex (male), BMI, WHR, current smoker, past smoker, Timed Up and Go, total instrumental activities of daily living.
† Model 2: model 1+HbA1C.
‡ Model 3: model 1+cerebrovascular diseases (transient ischaemic attack and/or stroke).
§ Model 4: model 1+C-reactive protein.
Table 4 Association between adiposity and measures of cognitive function in the Trinity Ulster Department of Agriculture (TUDA) bone cohort (n 1248) (β-Coefficients with their standard errors)

RBANS, Repeatable Battery for the Assessment of Neuropsychological Status; WHR, waist:hip ratio; MMSE, Mini-Mental State Examination; FAB, Frontal Assessment Battery.
* Model 1: age, education (duration schooling), sex (male), BMI, WHR, current smoker, past smoker, Timed Up and Go, total instrumental activities of daily living.
† Model 2: model 1+HbA1C.
‡ Model 3: model 1+cerebrovascular diseases (transient ischaemic attack and/or stroke).
§ Model 4: model 1+C-reactive protein.
Table 5 Association between adiposity and measures of cognitive function in the Trinity Ulster Department of Agriculture (TUDA) hypertensive cohort (n 1909) (β-Coefficients with their standard errors)

RBANS, Repeatable Battery for the Assessment of Neuropsychological Status; WHR, waist:hip ratio; MMSE, Mini-Mental State Examination; FAB, Frontal Assessment Battery.
* Model 1: age, education (duration schooling), sex (male), BMI, WHR, current smoker, past smoker, Timed Up and Go, total instrumental activities of daily living.
† Model 2: model 1+HbA1C.
‡ Model 3: model 1+cerebrovascular diseases (transient ischaemic attack and/or stroke).
§ Model 4: model 1+C-reactive protein.
WHR was negatively associated with cognitive function in all three cohorts but effects attenuated across cohorts. The effect was strongest in the hypertensive cohort and less so in the older cognitive cohort. BMI was not associated with cognitive function in the bone and hypertensive cohorts, but was positively associated in the cognitive cohort. The associations were generally not attenuated by any pre-specified analysis apart from two (CRP and HbA1C) factors in the bone and cognitive cohorts for RBANS index IV (a measure of attention) from statistically significant to non-significant.
In the cognitive cohort, BMI was positively associated with immediate and delay memory, visuospatial/constructional ability, language and MMSE, and negatively with FAB (log-transformed), whereas WHR was negatively associated with attention. In the bone cohort, BMI was not associated with any cognitive domain, whereas WHR was negatively associated with visuospatial/constructional ability, attention and MMSE. In the hypertensive cohort, BMI was not associated with any cognitive domain, whereas WHR was negatively associated with immediate and delayed memory, visuospatial/constructional ability, language and MMSE and positively with FAB (log-transformed). In the cognitive and bone cohorts, the association of WHR and attention disappeared by further controlling for C-reactive protein and HbA1C.
On meta-analysis, using the three cohorts, BMI was not statistically significantly associated with cognitive function on all RBANS subsets, MMSE or FAB(log) (online Supplementary Table S1). However, WHR was statistically associated with cognitive function on all RBANS subsets, MMSE and FAB(log). There was an attenuation of results from statistically significant to non-significant on adjusting for CRP in RBANS index II only (online Supplementary Table S2). Furthermore, there was a statistically significant heterogeneity between BMI and cognitive function on RBANS index I, III and V, total scale and FAB(log) on models 1, 2, 3 and 4, with further heterogeneity on MMSE in models 2 and 4. There was a significant heterogeneity between WHR and cognitive function on RBANS index II on models 1, 2, 3 and 4.
Discussion
This large observational study showed that central adiposity was associated with poorer cognitive function in older people. We found significant and robust negative associations between a measure of central adiposity and multiple domains of cognition. In contrast, however, after adjusting for central adiposity, BMI was only associated with cognition in the oldest (cognitively impaired) cohort and that association was positive. Some associations were explained by markers of inflammation or insulin resistance. This supports that the relationship between obesity and cognition is complex and that central (rather than general) adiposity is the main driver.
Our results on the association between central adiposity, measured by WHR, and cognitive function are comparable to those of other studies. Dore et al.( Reference Dore, Elias and Robbins 6 ) reported that waist circumference (WC) and WHR were inversely related to cognitive function using the Wechsler Adult Intelligence scale, the Halstead–Reitan Neuropsychological Battery, the Wechsler Memory scale revised and the MMSE in adults with a mean age of 62·0 (sd 12·8) years even though the relationship was attenuated by adjusting for physical activity level. A study of 250 participants using MMSE reported that high adiposity, particularly central adiposity, was associated with poor cognitive performance in subjects younger than 70 years, but not in those aged 70 years and over( Reference Yoon, Choi and Yu 12 ). A large elderly population study (aged 60 years and over, with a mean age of 70·6 years) using a Chinese version of the MMSE reported that a higher WC and WHR were associated with an increased prevalence of cognitive impairment( Reference Cui, Guo and Xu 23 ).
In our study, BMI was positively associated with MMSE in the cognitive cohort, but no association was found in other cohorts. Moreover, total obesity (measured by BMI) had been found to have an insignificant effect on cognitive impairment( Reference Cui, Guo and Xu 23 ). The NEDICES study suggested that obese/overweight status, using BMI, was associated with the lowest quartiles of the 37-MMSE, Trail Making Test-A (number of errors; indeed more errors), verbal fluency, delayed free recall, immediate logical memory and pre-morbid intelligence( Reference Benito-León, Mitchell and Hernández-Gallego 10 ). In contrast, in our cognitive cohort, BMI was positively associated with immediate and delayed memory, visuospatial/constructional abilities and language. The contrasting results could be explained by the fact that we controlled for BMI and WHR rather than BMI alone.
Nilsson & Nilsson( Reference Nilsson and Nilsson 4 ) examining the oldest old (75–90 years) reported that overweight (BMI) subjects performed significantly better on visuospatial ability than those with normal weight. This is further supported by a study of 2684 individuals aged 65–94 years with a mean age of 73 years that showed that overweight (BMI) subjects had better performance in terms of reasoning and visuospatial speed of processing than normal-weight participants( Reference Kuo, Jones and Milberg 13 ). The Cardiovascular Health study( Reference Luchsinger, Biggs and Kizer 24 ), with participants having a mean age over 73 years, revealed that high adiposity (WC and BMI) and high fat-free mass in the elderly were related to slower cognitive decline measured with the modified MMSE, the Digit Symbol Substitution test and a composite of both.
BMI measures total adiposity, whereas WC and WHR measure central adiposity. Whether BMI is a good measure of adiposity in older people is unclear owing to the fact that weight does not differentiate between fat and fat-free mass and unreliable measures of height due to shrinkage and vertebral collapse( Reference Price, Uauy and Breeze 25 ). A large study of subjects aged 75 years and over (n 14 833) in the UK reported an inverse association of BMI with mortality in women and no association in men, with WHR being positively related to circulatory mortality in both men and women( Reference Price, Uauy and Breeze 25 ). Moreover, Hermsdorff et al.( Reference Hermsdorff, Zulet and Puchau 26 ) found that central adiposity-related indicators (WC/WHR) correlated better than those assessing total adiposity with plasma pro-inflammatory markers.
In the cognitive and bone cohorts, WHR and attention (digit span and coding) association disappeared by further controlling for HbA1C. HbA1C was used as a surrogate marker for diabetes mellitus/insulin resistance. Our results suggest that insulin resistance may modify the association between cognitive function and WHR. Abbatecola et al.( Reference Abbatecola, Lattanzio and Spazzafumo 27 ) reported that total fat mass and central adiposity (WC and WHR) predicted an increased risk for cognitive decline in older people with diabetes. The proposed mechanism of cognitive decline in diabetes is through hippocampal insulin resistance in addition to, or separate from, inflammation( Reference Biessels and Reagan 28 ).
The association between WHR and attention disappeared by further controlling for CRP in the bone and cognitive cohorts. This implies that inflammation may have a role in explaining attention deficits. Obesity is a pro-inflammatory state with elevated levels of cytokines including TNF-α and IL-6( Reference Greenberg and Obin 29 ). Investigation of systemic markers of inflammation revealed that higher levels of CRP and IL-6 were cross-sectionally associated with worse global cognition and executive function in the Rotterdam study while only IL-6 in the Leiden 85-plus study( Reference Schram, Euser and de Craen 30 ). Furthermore, plasma levels of inflammatory proteins are reported to be increased before clinical onset of dementia( Reference Engelhart, Geerlings and Meijer 31 ).
Even though cerebrovascular diseases did not attenuate the relationship between adiposity and cognitive function on analysis in our study, it is known to affect cognitive function. Obesity is a known vascular risk factor that predisposes individuals to Alzheimer’s disease and vascular dementia( Reference Zlokovic 32 ). The postulated mechanism is through blood–brain barrier dysfunction leading to hypoperfusion and as a result increased accumulation of β-amyloid( Reference Zlokovic 32 ). Blood–brain barrier dysfunction is associated with both Alzheimer’s disease and vascular dementia among the very elderly( Reference Skoog, Wallin and Fredman 33 ). Our failure to detect attenuation could be because of the small number of participants with cerebrovascular disease in the current study or the fact that subjects with dementia were excluded. Alternatively, cerebrovascular disease may not have been an important mechanism through which obesity affected cognitive function in our subjects.
The association between adiposity and cognitive function was not attenuated by any pre-specified covariates in the hypertensive group. Perhaps there was no attenuation owing to the fact that hypertension itself is associated with inflammation. Hypertension is associated with insulin resistance( Reference Soleimani 34 ) and inflammation, with CRP being the inflammatory marker with the strongest association( Reference Dinh, Drummond and Sobey 35 ). Singer et al.( Reference Singer, Nathan and Anderson 36 ), using the original cohort of the Framingham Heart study, reported that HbA1C was associated with hypertension. Furthermore, the ATTICA study revealed an association between pre-hypertension and inflammatory markers linked to the atherosclerotic process including CRP( Reference Chrysohoou, Pitsavos and Panagiotakos 37 ).
The major strengths of this study include the study size, the well-characterised population and a comprehensive battery of cognitive tests. We used a full neuropsychological test battery – RBANS – to measure specific cognitive performances, i.e. attention, language, visuospatial/constructional abilities and immediate and delayed memory and analyse them individually unlike other studies. In addition, the statistical analysis was able to adjust for a wide range of confounders and covariates not usually recorded. There are some limitations; this is a cross-sectional study and hence cannot explain the causal relationship. In particular, we cannot exclude reverse causation. Singh-Manoux et al.( Reference Singh-Manoux, Dugravot and Shipley 38 ) reported either an attenuated or reversed risk of dementia associated with obesity at older ages. It was not possible to adjust for physical activity even though it has been previously shown to have a positive impact on cognitive function, whereas bio-impedance tests were unavailable to accurately assess the true scale of the adiposity.
In conclusion, this is one of the largest studies of older adults to demonstrate that central adiposity is associated with subtle cognitive impairment in community-dwelling older adults. Given the high prevalence of overweight and obesity in the older population and the economic and social burden of cognitive dysfunction, reducing obesity and exposure to obesogenic risk factors could be a cost-effective and effective public health strategy for the prevention of dementia and cognitive impairment in older adults.
Acknowledgements
The authors are grateful to help received from all members of the TUDA study group.
The authors acknowledge funding from the Mercer’s Institute for Research on Ageing, the Irish Department of Agriculture, Food and the Marine and the Health Research Board (under its Food Institutional Research Measure) and the Northern Ireland Department for Employment and Learning (under its strengthening the all-Ireland research base initiative).
O. N. was involved in acquisition of data, analysis, interpretation and preparation of manuscript; K. M., E. L., A. M. M., M. W., H. M., L. H., C. F. H., J. J. S., M. C. and C. C. were associated with framing the study concept and its design and acquisition of subjects and/or data; K. M., E. L. and C. C. were involved in framing the study concept and its design, acquisition of data, analysis, interpretation of data and critical revision. All authors approved the final submitted version.
The authors declare that there are no conflicts of interest.
Supplementary material
For supplementary material/s referred to in this article, please visit https://doi.org/10.1017/S0007114518001848


