


Energy intake and utilisation are crucial preconditions for a variety of different experimental settings. In particular, rodent studies which are not focused on mainly nutritional aspects frequently declare energy contents of employed diets as gross energy (GE). The GE of rodent feed is routinely determined during the commercial production process and the food manufacturer usually provides this information along with the diet. However, for many studies more precise information about the actually ‘available’ energy would be desirable and expedient. This ‘available’ energy is termed digestible energy (DE) or metabolisable energy (ME). Subtraction of non-digested energy in faeces from the GE content of a diet gives diet-specific values for DE. Further subtraction of the remaining energy in urine or energy loss by microbial gas production from the DE value then provides the ME content. Of note, predictive equations for ME, such as the Atwater factors, usually neglect losses by microbial gas production.
In general, rodent diets can be formulated as natural or as purified diets. Natural diets are composed of mixed ingredients such as different grains or soyabean meal. In contrast, purified diets use constant manufacturing formulas and include only purified ingredients of a precisely defined composition such as casein or sucrose. This provides a precise batch-to-batch consistency and thus diets can reach a higher level of standardisation.
Obviously, knowledge about energy consumption is necessary for most dietary studies. Especially feed trials, aiming to explore mechanisms of obesity induction, are often dependent on exact estimates of energy intake and the extent to which this energy can be processed. Also studies analysing the effect of feed restriction, such as in cancer research or longevity studies(Reference Keenan, Laroque and Dixit1, Reference Christian, Hoberman and Johnson2), require knowledge about energy consumption. Pair-feeding is a particular approach to ensure that in an experimental setting all animal groups consume equal amounts of energy each day and that any effects observed are not due to differences in energy intake between experimental groups(Reference Caton, Yinglong and Burget3, Reference Bielohuby, Matsuura and Herbach4). This method works fine, as long as the applied estimations of ME, which are required for this method, produce values which are close to reality. However, to date, there are no scientifically validated methods to estimate the ME content of mixed feed for rats. ME is often predicted by Atwater factors, a factors system that was originally developed to estimate ME in human nutrition:
Given the combustion heat of nutrients these factors are obviously based on the assumption that digestibilities of 90 % or above are reached, which is true for a human Western diet, but not necessarily for all rat diets. In other single-stomached species it is well documented that the digestibility of protein, carbohydrate and even fat can vary considerably according to the source of the nutrient, its processing and the dietary fibre content of the whole diet(Reference Kamphues, Schneider and Leibetseder5). If the digestibility of one or more nutrients is 10 to 15 % below 90 %, the results of the Atwater predictive equations considerably overestimate energy. A similar issue regarding the Atwater factors arose in dog and cat feed. As a consequence, the Association of American Feed Control Officials (AFFCO)(6) modified the Atwater factors, giving somewhat lower values for all nutrients (14·65 kJ/g protein and NfE and 35·58 kJ/g fat), reflecting lower digestibilities. This approach could also be suitable for rat diets. Another commonly used method to estimate ME of rodent feed, at least in Germany, is an equation that was originally developed for pig feed(7, 8):
This equation does not assume extremely high digestibilities of nutrients; however, it has never been validated for rats. Rats, pigs and man differ in their ability to digest nutrients(Reference Bach Knudsen, Wisker and Daniel9–Reference Rutherfurd and Moughan11). Consequently both predictive equations should be validated for rats before they are used to define crucial experimental conditions.
This is especially true if such formulas are used to predict the energy yield from single nutrients. It is of particular importance for experimental settings which compare two or more experimental diets and which require clamping of single nutrients, such as a constant protein content(Reference Bielohuby, Matsuura and Herbach4), in order to demarcate observed effects from an unintended nutrient difference between two diets. Apart from those particular experimental settings, analysis of protein digestibility seems to have gained momentum again and methods or drugs modifying protein digestibility are being investigated. For example, it has recently been reported that the en vogue ‘anti-ageing’ drug DHEA (dehydroepiandrosterone) affects protein digestibility which might explain the anti-obesity properties of this substance(Reference de Heredia, Cerezo and Zamora12).
To investigate the reliability of the equation for pig feed and the Atwater formula to estimate the ME of rat diets, we experimentally determined the digestibility of sixteen mixed feeds for rats from three different manufacturers. Of the analysed diets, five were formulated as purified diets, and eleven as natural diets. We also explored the digestibility of protein and thus ME yields deriving from crude protein, and compared the present results with the predicted values. In addition we compared the digestibility of three diets before and after heat sterilisation.
Materials and methods
A total of sixteen digestion trials were carried out. Of these trials, thirteen were performed at the Max Planck Institute of Biochemistry and three were carried out at the Medizinische Klinik; therefore differences regarding the rat strain used as well as minor differences in housing conditions are present between these three and the other thirteen trials. Details about the experimental settings are indicated below.
Diets
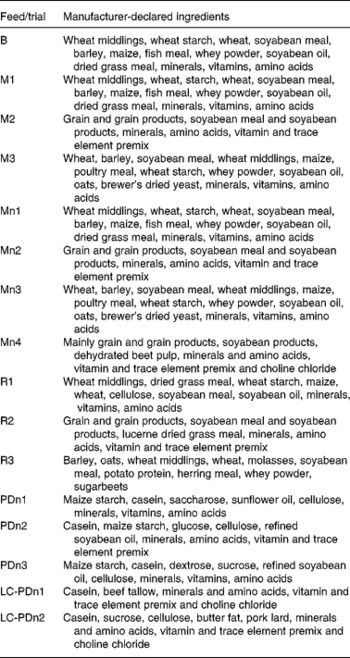
Composition of the diets is given in Table 1 and manufacturer-declared ingredients are listed in Table 2. Diets were provided by Altromin (Altromin Spezialfutter GmbH & Co. KG, Lage, Germany), Ssniff (ssniff Spezialdiäten GmbH, Soest, Germany) and by Kliba Nafag (Kliba Nafag – business unit of PROVIMI KLIBA SA, Kaiseraugst, Switzerland). Of the trials, eleven were carried out with natural diets and five trials with purified diets. Natural diets in this context are defined as feed composed of ingredients such as cereals, soyabean meal or grass meal, and purified diets as being composed of purified ingredients such as isolated starch, sugar, casein or cellulose. The natural diets were one breeding diet (B), four maintenance diets before autoclaving (Mn1, Mn2, Mn3, Mn4) and three of these maintenance diets after autoclaving for 10 min with a temperature of 124°C in the feed pellets (M1, M2, M3). In addition, three natural high-fibre reducing diets (R1, R2, R3) and five semi-purified diets (PDn1, PDn2, PDn3, LC-PDn1 and LC-PDn2) were investigated. LC-PDn1 and LC-PDn2 were experimental low-carbohydrate–high-fat diets. With the exception of diet Mn4, chromic oxide was used as a marker in the natural diets (for concentrations, see Table 2). Feeding of the marker was started at least 7 d before the digestion trial started, in order to ensure marker equilibrium. Diets which were not autoclaved carry an ‘n’ in the abbreviation.
Table 1 Experimental design, experimentally determined diet composition and gross energy (GE)*
(Mean values)

NfE, N-free extracts; N/A, not applicable.
* Feed composition is given as a percentage of DM. For details of diets and their ingredients, see Materials and methods and Table 2.
† Purified diets.
Animal husbandry
Seventy-eight male inbred Lewis rats (LEW/Crl; Charles River, Sulzfeld, Germany; six animals per trial) and twenty male Wistar rats (Hsd Cpb:Wll; Harlan Laboratories, Borchen, Germany) were used (eight animals for trials Mn4 and LC-PDn1 and four animals for trial LC-PDn2). All animals were delivered in filter boxes from specified pathogen-free breeding colonies. Microbiological status was according to Federation of Laboratory Animal Science Associations (FELASA) recommendations(Reference Nicklas, Baneux and Boot13).
Age, strain and number of animals used for each digestion trial are shown in Table 1. All animals received ad libitum access to water and standard laboratory chow for the first 14 d following delivery, to allow acclimatisation to the new environment. Rats were housed in an open system in individual Makrolon type III cages at 22 ± 1·5°C (relative humidity 55 ± 5 %, fifteen air changes per h, 100 % fresh air) and maintained on a 14 h artificial light and 10 h dark cycle throughout the study. For the three trials carried out at the Medizinische Klinik, rats were kept on a 12 h day–night cycle at 21·5 ± 1°C (artificial light, 100 % fresh air, relative humidity of 60 ± 10 %). The acclimatisation period for these three trials lasted only 10 d. Food intake was measured daily. Before the digestion trials, rats were adapted for 14 d to their new diet with the exception of diet B where adaptation lasted only 6 d. During the digestion trials, litter was removed from the cages and rats were kept on stable metal grids or plastic material with small holes to prevent wetting of the floor and contamination of faeces with urine. Faeces were collected and weighed in the morning and evening for five consecutive days. In diets PD1, PD2 and PD3, faeces were collected for 10 d because larger amounts of faeces were required for another (not the present) experiment. The collected faeces samples were stored immediately at − 20°C until analysis. In diet B, the first step was to investigate marker recovery, which amounted to 91·3 (sd 4·7) %. Second, we compared the digestibility of DM in diet B as determined either by the marker method or by the total collection method. DM digestibility analysed by the marker method amounted to 82·0 (sd 0·7) % and was only slightly higher by the use of the total collection method (83·6 (sd 0·3) %).
All procedures were performed in accordance with all German (for example, German Animal Welfare Act) and European (for example, Directive 86/609/EEC) applicable laws and regulations concerning the care and use of laboratory animals.
Analyses
Analyses of feed and faeces for crude fat, protein (i.e. N by the Kjeldahl method) and NfE (i.e. carbohydrates and soluble fibres) were carried out by the Weende method(Reference Naumann and Bassler14). Combustion heat (GE) of food and faeces was determined using an adiabatic bomb calorimeter (IKA-Calorimeter C4000; IKA-Analysentechnik Janke & Kunkel GmbH & Co., Staufen, Germany). GE was determined five times in each sample and CV were calculated. If CV exceeded 0·4 %, measurements were repeated. Chromic oxide was analysed photometrically by the method of Petry & Rapp(Reference Petry and Rapp15), in which a colour reaction is induced by adding sodium molybdate, sulfuric acid and perchloric acid. Starch was determined polarimetrically and reducing sugars were analysed by the titration method described previously by Luff-Schoorl(Reference Bassler, Naumann, Seibold, Naumann and Bassler16). All digestion trials were carried out with between four and eight rats per trial and diet, as indicated in Table 1, with the exception of diet Mn4, in which digestibility of protein and NfE was determined using four rats. Digestibilities of fibre and NfE were not determined in diets LC-PDn1 and LC-PDn2 due to the lack of sample material.
Calculations
NfE was calculated as follows:
Apparent digestibility by the total faecal collection method was calculated as follows:
Apparent digestibility by the marker method was calculated as described by Kamphues et al. (Reference Kamphues, Schneider and Leibetseder5):
Marker recovery amounted to 91·3 (sd 4·7) %. ME was predicted from experimentally determined DE by N-correction subtracting 5·2 kJ/g digestible crude protein (standard value by Rubner(Reference Rubner17), representing energy losses by urine, mainly but not exclusively as urea) using the experimentally determined digestibility of crude protein. Microbial gas production has been neglected. ME derived from crude protein was calculated as follows. First, the crude protein content of each diet was multiplied by the experimentally determined digestibility of protein. The energy per g digestible crude protein was calculated by using a standard value for GE in protein of 24 kJ/g and subtracting 5·2 kJ/g digestible crude protein for N-correction. This resulted in a ME of 18·8 kJ/g digestible crude protein.
For prediction of ME from the nutrient composition of diets we used: (i) Atwater factors (ME (MJ/kg) = 0·01 674 × protein (g)+0·03 767 × fat (g)+0·01 674 × NfE (g)); (ii) modified Atwater factors (ME (MJ/kg) = 0·01 465 × protein (g)+0·03 558 × fat (g)+0·01 465 × NfE (g)); (iii) an equation for pig feed (ME (MJ/kg) = 0·0223 × protein (g)+0·0341 × fat (g)+0·017 × starch (g)+0·0168 × sugar (g)+0·0074 × (organic matter − protein − fat − starch − sugar − fibre) (g) − 0·0109 × fibre (g)).
Statistical analysis
Non-parametric Spearman correlations, linear regressions and statistical analysis were performed using the SPSS software package (version 15.0; SPSS Inc., Chicago, IL, USA) or Microsoft Excel (Microsoft Corp., Redmond, WA, USA). Linear regressions were performed when statistics indicated that the data were distributed normally. For the statistical comparison between two groups, the Student's t test was used. P < 0·05 was considered significant. Data are presented as mean values and standard deviations.
Results
Diet composition
Analysis of macronutrient composition and GE for each diet is shown in Table 1. Of course, the sixteen different rat feeds largely varied in their macronutrient composition, according to their intended experimental usage. Contents of crude protein contents ranged from 8·1 to 39·9 % (DM), crude fat between 1·3 and 76·2 % (DM), crude fibre between 0·1 and 17·5 % and NfE between 5·5 and 70·1 %. The mean GE of the sixteen feeds was 20·1 MJ/kg, being highest in LC-PDn2 (35·3 MJ/kg) and lowest in M1 (17·6 MJ/kg).
Apparent digestibility of energy and nutrients
Table 3 shows apparent digestibility of energy and nutrients. Analysis of apparent digestibility from the eleven non-purified diets revealed a mean digestibility of energy of 71·4 % (range 53·3–83·5 % DM). Mean protein digestibility amounted to 68·7 % (range 52·2–80·9 % DM), mean fat digestibility was 73·4 % (range 56·1–87·3 % DM), mean fibre digestibility was 18·6 % (range 6·7–33·5 % DM) and mean NfE digestibility was 80·8 % (range 69·5–90·5 %). Protein, fat, fibre, NfE and GE digestibilities were higher by about 20 % in the five semi-purified diets (P < 0·0001).
Table 3 Experimentally determined apparent digestibilities of nutrients and energy*
(Mean values and standard deviations)

NfE, N-free extracts.
* All digestion trials were carried out with between four and eight rats per trial and diet, as indicated in Table 1, with the exception of diet Mn4, in which digestibility of protein and NfE was determined using four rats. Digestibilities of fibre and NfE were not determined in diets LC-PDn1 and LC-PDn2. For details of diets, see Materials and methods and Tables 1 and 2.
† Purified diets.
Effect of heat sterilisation
Data from the three maintenance diets that were analysed before and after heat sterilisation show that the digestibility of GE did not change significantly, whereas the digestibility of protein was decreased by about 2–5 % after heat sterilisation.
Experimental v. predicted values of metabolisable energy
Table 4 lists the ME contents of each diet. The first column shows the experimentally determined ME of the sixteen different rat feeds. The following three columns report predictions of ME by the equation for pig feed (second column), by the Atwater formula (third column), and by using the modified Atwater factors (fourth column). The last column shows which formula yielded best the ME estimates for the individual diets. All three predictions were significantly correlated to the experimentally determined ME. However, the equation for pig feed correlated the best, whereas the estimations using the Atwater factors showed the poorest correlation to the experimentally determined results (Atwater factors, Spearman r 0·8403, P < 0·0001; equation for pig feed, Spearman r 0·9684, P < 0·0001; modified Atwater factors, Spearman r 0·8903, P < 0·0001). When comparing data from these four columns, one can easily notice that the equation for pig feed and the modified Atwater factors were more precise for the non-purified diets, but the original Atwater factors matched quite well when used for purified diets. By applying the equation for pig feed with standard, natural diets and implementing the original Atwater formula for purified diets, much better correlation was achieved when compared with only using the Atwater factors for every diet (Spearman r 0·9772; P < 0·0001; n 16; Fig. 1(a)). Figure 1(b) shows a linear regression of logarithmised values with the equation: y = 0·997x ± 0·04 (r 2 0·981; P < 0·0001; n 16).
Table 4 Experimentally determined metabolisable energy (ME) (1) and ME estimated by the equation for pig feed (2), by the Atwater factorial system (3) and by the use of modified Atwater factors (4)*†
(Mean values)

NfE, N-free extracts.
† Equations used:(1) ME (MJ/kg) = digestible energy − 5·2 kJ per gram digestible crude protein. (2) ME (MJ/kg) = 0·0223 × protein (g)+0·0341 × fat (g)+0·017 × starch (g)+0·0168 × sugar (g)+0·0074 (organic matter − protein − fat − starch − sugar − fibre) (g) − 0·0109 − fibre (g). (3) ME (MJ/kg) = 0·01674 × protein (g)+0·03767 × fat (g)+0·01674 × NfE (g). (4) ME (MJ/kg) = 0·01465 × protein (g)+0·03558 × fat (g)+0·01465 × NfE (g).
‡ The last column (5) shows which equations predicted ME with less than 10 % error.
§ Purified diets.

Fig. 1 (a) Non-parametric Spearman correlation of experimentally determined metabolisable energy (ME) and diet-specific estimate using the equation for pig feed with natural diets or the Atwater factors for purified diets (Spearman r 0·9772; P < 0·0001; n 16). (b) Linear regression of logarithmised values (y = 0·997x ± 0·04; r 2 0·981; P < 0·0001; n 16).
Metabolisable energy yield from crude protein
Table 5 shows the % kJ deriving from protein as (a) determined experimentally or (b) predicted by the Atwater formula. The non-parametric Spearman correlation of r 0·8454 (P < 0·0001; n 16) indicates that the Atwater formula can be imprecise in predicting the % kJ from protein (Fig. 2(a)). Similar to ‘total’ ME prediction, Atwater was relatively precise in estimating the % kJ from protein in purified diets. However, in ten out of eleven natural diets, Atwater overestimated the % kJ from protein and the predicted values were up to 24 % higher than the experimentally determined results. Thus, recalculation of the correlation analysis using only the eleven natural diets resulted in a much poorer correlation between experimentally determined % kJ from protein and the estimates by Atwater (Spearman r 0·658; P < 0·05; n 11). Better correlation with the experimental results was obtained when a non-parametric correlation with the ‘crude protein content:GE of the respective diet’ ratio was performed (Spearman r 0·8719; P < 0·0001; n 16; Fig. 2(b)).
Table 5 Percentage of energy (% kJ) deriving from dietary protein, using (1) experimentally determined digestibility of protein and (2) estimates from the Atwater formula, and the crude protein:gross energy (cP:GE) ratio for each diet*†
(Mean values)

Fig. 2 (a) Non-parametric Spearman correlation of experimentally determined energy from dietary protein (%) and energy from dietary protein estimated by the Atwater formula (%) (Spearman r 0·8454; P < 0·0001; n 16). (b) Non-parametric Spearman correlation of experimentally determined energy from dietary protein (%) and the crude protein:gross energy (cP:GE) ratio (Spearman r 0·8719; P < 0·0001; n 16). Using this ratio resulted in a better correlation when compared with the correlation with the estimates for energy from dietary protein derived from the Atwater formula.
Discussion
The present study shows that digestibility of energy and protein varies considerably between differentially composed mixed feeds for rats. Therefore, the prediction of ME by a singular factor system implying similar (high) digestibilities for all nutrients will result in inaccurate estimates. In the present study, calculation of ME in natural diets by the Atwater formula clearly yielded the worst estimates. However, in reverse conclusion, such a singular factor system can be applied to diets in which nutrient digestibilities are actually nearly uniform, like in synthetic diets. This was also true for the present study, in which usage of the Atwater factors resulted in rather accurate estimates for the purified diets. It should be noted that estimates obtained by the modified Atwater formula matched well with the experimental results for some natural maintenance and breeding diets. Although the modified Atwater factors were superior to the ‘original’ Atwater factors in natural diets, the equation for pig feed was the most reliable formula for these diets.
Strikingly, already 15 years ago, replacement of the Atwater factors by newer systems has been requested, since the initial empirical system of food groups used by Atwater does not reflect today's food formulations for rats(Reference Moe18). Nevertheless, many commercial manufacturers for rodent feed still calculate the energy of natural diets by using the Atwater formula (so-called physiological fuel values). As shown in the present study, application of the modified Atwater factors would give better estimates than the unmodified factors for natural rat diets. The pig equation, however, gives better results for natural diets than the modified Atwater factors. Given the fact that the pig equation takes the percentages of starch and sugar in the NfE fraction into account and has a slightly negative factor for fibre, this equation is likely to be more robust to changes in diet compositions than the modified Atwater factors. Since fibre has a negative effect on digestibility of energy and protein in rats(Reference Jorgensen, Zhao and Theil19), the use of modified Atwater factors should be limited to natural diets with a low to moderate content of fibre. In the present study, crude fibre in DM correlated negatively to energy digestibility in natural diets (energy digestibility (%) = 85·1 − 1·81 × crude fibre in % DM; r 2 0·80). In principle this regression equation could also be used to estimate digestibility of energy. GE can be calculated from the combustion heat of crude nutrients. In a second step the regression equation can be used to predict digestibility. The digestibility is then multiplied by the GE content to estimate DE and finally a protein correction can be done. Such a system has previously been developed for dogs and cats(20). From our data in rats we found that the pig equation was slightly superior to this system (data not shown). In addition, the equation for pig feed might be an easier approach than a prediction using the crude fibre contents.
The present results demonstrate once more that – even across species – dietary factors such as ingredients, nutrient content and processing are major determinants of digestibility of energy and protein. Predictive equations will only fit to a certain type of diet. In order to avoid biases in any dietary experiment it is of crucial importance to carefully consider which equation can be applied for a given diet. However, the possibility of errors in predictions of energy can never be fully excluded. A similar conclusion has been drawn in a study conducted in Japan which analysed the digestibility of ten commercial diets(Reference Suzuki, Shimizu and Ishibashi21).
In addition there are factors affecting the digestibility of diets that are related to the experimental design. For instance, the feeding of different amounts of food has a direct effect on the digestibility of energy(Reference Larsen, Ostergard and Hansen22). In that study, in which daily food intake was varied, the investigators found a significant and negative relationship between daily food intake and digestibility of energy(Reference Larsen, Ostergard and Hansen22). In another study, an increased energy digestibility was found in rats, after environmental temperatures had been increased from 18°C to 28°C(Reference Zhao, Jorgensen and Gabert23). Amongst others, these two examples highlight the need for determining the digestibility of energy for individual scientific questions in cases for which exact values of ME are required for an unbiased performance of experiments.
The same holds true for the prediction of the percentage of energy deriving from protein. Protein digestibility is an important determinant of the percentage of energy deriving from protein.
Similar to the digestibility of total energy, the digestibility of protein is dependent on many variables such as the source of protein, processing of feed, fibre content or even diet-derived anti-nutritional factors such as trypsin inhibitors or tannins(Reference Eggum, Pedersen and Jacobsen24–Reference Gilani, Cockell and Sepehr26). Rutherfurd & Moughan found a true average protein digestibility of 96·1 % in rats with purified diets(Reference Rutherfurd and Moughan11). This is in good agreement with our own data on apparent protein digestibilities of purified diets which were 89 % or higher. In natural diets, however, protein digestibility was considerably lower.
In the purified diets studied, the Atwater factors could be used to predict % kJ from protein, since the digestibility of protein and energy was above 90 %. By contrast, the prediction of % kJ by Atwater provided inaccurate results for most non-purified diets (Table 5). Modified Atwater factors did not give more accurate results in natural diets (data not shown), apparently because they also – like the original Atwater factors – have similar ratios between factors for nutrients. Correlation analysis using all diets revealed that protein digestibility significantly correlated to energy digestibility (r 2 0·93); however, no significant correlation occurred when analysing diets only within the same diet type (i.e. natural maintenance, reducing or purified diets). Therefore it is possible that the Atwater factor calculation of percentage energy deriving from protein adds up to the relative overestimation of energy digestibility or the relative underestimation of protein digestibility, respectively. For a rough comparison of relative protein contents between two different diets, the calculation of the crude protein:total GE content ratio seems to be more useful than the Atwater factor-based calculation of percentages of energy deriving from protein. This can clearly be demonstrated when applying both methods to our data and comparing the results with the ones obtained for the two standard diets of the American Institute of Nutrition (AIN): the AIN-93G and AIN-93M diets(27). Both diets are formulated as purified diets. While diet AIN-93G was designed to meet the nutritional demands of growing rats, diet AIN-93M gives reference values of feed composition for maintenance of rats. Diet AIN-93G contains 17·86 % crude protein with a GE content of 18·06 MJ/kg, while the maintenance diet AIN-93M contains less crude protein, which then amounts to 12·58 %(Reference Reeves, Nielsen and Fahey28). Diet AIN-93M also has a slightly lower GE content (17·05 MJ/kg) when compared with the AIN diet designed for growing rats. The crude protein contents in these two diets translate to 19·1 and 14·1 % of energy deriving from protein (calculated by Atwater factors).
The crude protein:GE ratio of the two AIN diets amounts to 9·9 and 7·4 g/MJ, respectively. By comparison of the ‘crude protein:GE’ ratio from AIN diets with the ratios from experimental diets, one can easily identify protein-deficient diets. In the present study, diet R1 had a crude protein:GE ratio below 9·9 and diet LC-PDn2 was even below 7·4 g/MJ. This means that diet R1 is marginally deficient for growth but not for maintenance, and diet LC-PDn2 would be clearly deficient for all purposes. Calculating the percentages of energy from protein by Atwater factors did not pick up the marginal protein deficiency of diet R1, but only the obvious low protein content of diet LC-PDn2.
In conclusion, for the prediction of ME in mixed rat feed, we propose to use the equation for pig feed for natural diets and the Atwater factors for purified diets. If the equation for pig feed cannot be applied, for example, due to the unavailability of crude fibre data of a specific natural diet, we suggest to rather use the modified Atwater factors than the ‘original’ Atwater factors to estimate ME of a diet. In order to compare the protein content on an energy basis, we propose using the crude protein:GE ratio. Choosing an inappropriate predictive equation for ME results in considerable error. Special diets or experimental conditions may render any predictive equation unsuitable. Therefore, if ME really matters for the experiment in question and/or if diet composition deviates from standard purified or natural diets, or the experimental design includes unusual feeding conditions, it is strongly recommended that the digestibility of energy is determined experimentally by digestion trials.
Acknowledgements
We thank the working group on nutrition of the Society for Laboratory Animal Science (GV-SOLAS) and its members for initiating the present study and for their support. We would like to thank Juliane Ramisch (Medizinische Klinik – Innenstadt), Christian Overdiek, Verena Hohenester and Werner Hesselbach (Chair of Animal Nutrition and Dietetics, Department of Veterinary Sciences) for excellent technical assistance.
The present study was funded in part by the German Society for Laboratory Animal Science (GV-SOLAS). Furthermore, the study was supported financially and technically by the following companies: Altromin Spezialfutter GmbH & Co. KG; Charles River Laboratories Germany GmbH; ssniff Spezialdiäten GmbH; Kliba Nafag (a business unit of PROVIMI KLIBA SA).
M. Bielohuby conducted the study and wrote the manuscript, K. B. conducted the study and corrected the manuscript, H. B. conducted and designed the study, M. Bidlingmaier designed the study and corrected the manuscript, E. K. designed the study and wrote the manuscript. All authors read and approved the findings of the study.
All authors have no conflicts of interest.


