


The WHO estimates that over two billion people worldwide may be zinc deficient (World Health Organization, 2002). This assessment is based on food availability data not on zinc status, which is difficult to assess because of the lack of reliable status markers (Hambidge, Reference Hambidge2003). Several diagnostic markers of zinc status have been evaluated, including levels of plasma zinc, plasma alkaline phosphatase, plasma thymulin and hair/nail zinc (McKenzie, Reference McKenzie1979; Wood, Reference Wood2000). All of these markers have proven unsatisfactory for various reasons, but the greatest disadvantages seem to be that they are not specific for zinc deficiency and they have limited sensitivity. Metallothionein (MT) was proposed as a marker of zinc status many years ago (Grider et al. Reference Grider, Bailey and Cousins1990; King, Reference King1990) due to the sensitivity and magnitude of its induction by zinc. Zinc-deficient rats had substantially lower plasma levels of MT (Sato et al. Reference Sato, Mehra and Bremner1984) and MT levels in human erythrocytes decreased in experimental zinc deficiency (Grider et al. Reference Grider, Bailey and Cousins1990; Thomas et al. Reference Thomas, Bailey, Kauwell, Lee and Cousins1992). The problem with measuring plasma MT was the lack of available immunoassays with sufficient sensitivity and specificity. Analysis of erythrocyte MT was confounded by the observation that most of the MT was concentrated in the reticulocyte fraction, and that changes in erythropoesis could therefore influence total erythrocyte MT levels (Robertson et al. Reference Robertson, Morrison, Wood and Bremner1989). Mononuclear cell (MNC) MT mRNA levels measured by competitive RT–PCR methods have been shown to be positively correlated with zinc status (Allan et al. Reference Allan, Hawksworth, Woodhouse, Sutherland, King and Beattie2000; Cao & Cousins, Reference Cao and Cousins2000), and the development of real-time RT–PCR has improved the ease with which this target can be quantified.
There are several dietary factors that can affect zinc absorption, among the most notable being phytate and calcium, which decrease absorption (Krebs, Reference Krebs2000; Lonnerdal, Reference Lonnerdal2000). Molar ratios of >20 for the phytate:Zn content and >200 for the phytate × Ca:Zn content of diets have been recognized as likely to induce zinc deficiency (Ruz et al. Reference Ruz, Cavan, Bettger, Thompson, Berry and Gibson1991), and the diets of some population groups throughout the world exceed these threshold ratios. Indeed, mean values of 40 and 400 have been recorded for phytate:Zn and phytate × Ca:Zn ratios, respectively, in the diets of rural Koreans (Lee et al. Reference Lee, Kwak, Yoon, Kwon, Beattie and Kwun2004). Plasma alkaline phosphatase levels in 176 volunteers at risk of zinc deficiency according to their zinc, phytate and calcium intakes, were found to be considerably lower than the reference range, although plasma zinc was not lower than the respective reference range. Although the utility of quantifying T-lymphocyte MT-2A mRNA for the assessment of zinc status had been demonstrated in a controlled intervention study (Allan et al. Reference Allan, Hawksworth, Woodhouse, Sutherland, King and Beattie2000), its application to the assessment of zinc status in population groups has not been evaluated. We proposed therefore to measure MT-2A mRNA levels in mononuclear leucocytes from rural Korean subjects who were likely to show a range of zinc intakes and status. Taking advantage of samples from an on-going large study relating nutritional status to health in different Korean localities, we identified a sub-group of individuals suitable for the present study. Our major objectives were two-fold: (1) to investigate the range and variation of MT gene expression in MNC from subjects in a population and to relate the MT levels to variable factors such as age and sex, and (2) to investigate whether dietary zinc intake and plasma zinc is related to MNC MT expression.
Methods and materials
Volunteer recruitment
Subjects were recruited as part of the Public Medical Center Health Promotion Program Project, from fifteen rural localities in the Andong area of South Korea. Recruitment was achieved by sending an information postcard to the residents of each area and those wishing to join the project were accepted, subject to meeting the inclusion criteria. The final number of volunteers recruited to the study was around 1700, and they were assumed to be representative of the whole population. Subjects were aged 50–80 years with a BMI within the normal range (18–26). A sub-sample of 110 volunteers from seven localities were selected for the present study on the basis of their zinc intake. This sub-population was representative of the range of zinc intakes found in the larger study group and contained both male and female volunteers. Exclusion criteria included any clinical signs of chronic disease or infections and any long-term medication or supplementation. Ethical permission for the present study was granted by the Andong Public Medical Center Ethical Committee.
Body weight ranged from 58 to 66 kg for men and 51 to 59 kg for women. Height ranged from 162 to 167 cm and from 146 to 155 cm for men and women, respectively, and BMI from 21·94 to 24·40 for males and from 23·90 to 25·61 for females. BMI was calculated by dividing body weight in kg by (height)2 in m. The volunteer age and sex for each locality are presented in Table 1.
Table 1 Age, zinc intake, plasma zinc and mononuclear cell MT-2A mRNA (MT mRNA) in subjects according to rural locality (see p. 248) and gender. Zinc intake is also expressed as a proportion of lean body mass (Zn/LBM), as a molar ratio with dietary phytic acid (Phy:Zn) and as a molar ratio index with dietary calcium and phytic acid (Phy x Ca:Zn)† (Mean values with their standard errors)

F, female; LBM, lean body mass; M, male; MT, metallothionein; ND, not determined.
* Statistical significance (P ≤ 0·05) when comparing males and females for all localities.
† For details of procedures, see pages 248 and 250.
Health status and dietary assessment
For screening medical status a general questionnaire was used to obtain information on the medical history of subjects and their family history, including the nature of any disease and its duration. A routine physical examination was also made by medical examiners of the Andong Public Medical Center Health Promotion Program.
A FFQ was used for estimation of the intakes of zinc, calcium, phytate and other nutrients. The FFQ, which contained thirty-eight food items, included the major food sources and major zinc-containing food items which are commonly consumed by Koreans during the four seasons of each year. FFQ data were correlated with 24 h recall information to validate the FFQ method.
Nutrient intakes were calculated using Computer Aided Nutritional Analysis Program, version 2.0 (CAN Pro 2.0, Korea Nutrition Society, Seoul, South Korea). Intake for zinc and phytate, which are not included in the CAN Pro 2.0 program, were analysed using food composition tables, databases, a cross-referenced index and various values from the literature (Korean Food & Drug Association, 1996; Korean Food and Drug Safety Section, 2002; Kwun & Kwon, 2000). The procedure for calculation of zinc, calcium, phytate and phytate:Zn molar ratio has been described previously (Kwun & Kwon, 2000). Nutrient intakes were compared with the Korean Recommended Dietary Allowance (Korean Nutrition Society, 2000).
Blood sampling and processing
A fasted blood sample was collected from subjects in the early morning, and plasma, erythrocytes and MNC were separated by layering the blood sample on to Histopaque 1077 (Sigma Aldrich, St Louis, MO, USA), and centrifuging at 400 g for 30 min. Plasma was removed and frozen at − 80°C while the MNC at the Histopaque interface were removed and centrifuged at 250 g for 10 min to obtain a cell pellet. The pellet was washed with saline and the cells re-centrifuged and frozen at − 80°C in 1 ml RNALater (Ambion, Austin, TX, USA).
RNA isolation
The MNC samples were defrosted on ice and centrifuged at 3000 g for 15 min at 4°C (MR 1822 Jouan centrifuge; Thermo-Electron, Basingstoke, UK) in order to pellet them. The RNALater supernatant was discarded and RNA was extracted using TRIzol according to the instructions of the manufacturer (Invitrogen, Paisley, UK). The RNA pellet was briefly dried for 5–10 min and then dissolved in 10 μl RNase-free water. Each sample was diluted × 1000 and quantified by absorbance at 260 nm using an Eppendorf Biophotometer (Eppendorf UK Ltd, Cambridge, UK). The samples were stored at − 80°C.
cDNA synthesis by reverse transcription of RNA
The RNA samples were diluted to a final concentration of 1 μg/μl. A mastermix containing 2 μl 10 × concentrated RT buffer, 4·4 μl 25 mm-MgCl, 4 μl 10 mm-DNTP (with dTTP) and 1 μl 50 μm-random hexamers was prepared by mixing, and 0·4 μl RNase inhibitor (20 units/μl) and 1 μl Multiscribe RT (50 units/μl) (Applied Biosystems, Warrington, UK) were subsequently added, also with mixing. To obtain a 20 μl reaction mix, 5 μl RNA sample and 2·2 μl water were added to 12·8 μl of the mastermix. The reaction mixes were put into a thermal cycler (Hybaid Omn-E, Ashford, UK) and were heated at 30°C for 10 min, then at 48°C for 30 min and finally at 95°C for 5 min. The samples were frozen at − 80°C until required for the human MT-2A PCR.
Real-time PCR for human metallothionein-2A
After reverse transcription, MT-2A cDNA was amplified by real-time PCR using the TaqMan system (Applied Biosystems). PCR reaction mixes were prepared in a PCR workstation and reagents were dispensed using positive-displacement pipettes with autoclaved, UV-irradiated tubes and tips. cDNA samples were defrosted in ice and a premix of 50 μl/tube of TaqMan Universal Master Mix (Applied Biosystems), 35 μl RNA-free water and 6 μl and 3 μl/tube MT-2A for the forward–reverse primers and probe, respectively, were prepared. The purified primers were obtained from MWG-Biotech AG (London, UK) and the probe from Applied Biosystems. The sequences of the probes and primers for MT-2A were:
Forward primer: 5′-GCA CCT CCT GCA AGA AAA GC-3′
Reverse primer: 5′-TGG AAG TCG CGT TCT TTA CAT CT-3′
Probe: 5′-FAM-CTC CTG CTG CCC TGT GGG CTG T-TAMRA-3′
A single PCR product of 154 bp was consistently obtained, with no evidence of genomic DNA amplification, which would yield a product of 359 bp. 18S ribosomal RNA (TaqMan Ribosomal RNA Control Reagents VIC Probe Protocol; Applied Biosystems) was used as a reference.
In each plate one non-template control and seven standards were run with the samples. Since the objective was to measure relative rather than absolute concentrations, standards were made by diluting a selected sample, according to the protocols supplied by Applied Biosystems. The concentration of reverse-transcribed RNA in the top standard was 250 ng/μl, and six serial dilutions were made to give the following additional standard concentrations: 62·5, 15·62, 3·9, 0·97, 0·24 and 0·04 ng/μl; and for 18S: 10, 2·5, 0·625, 0·156, 0·039, 0·010 and 0·003 ng/μl. The samples were diluted to 50 ng/μl. To each microcentrifuge tube, 51·8 μl premix and 2·2 μl of water, standards or sample cDNA were added. The tubes were vortexed and then centrifuged for 1 min at high speed using a Sigma 1–13 centrifuge. Then 2 × 25 μl of control, standards and samples were dispensed into duplicate wells of a PCR ninety-six-well plate. To remove any bubbles in the wells, the plate was sealed and centrifuged for 1 min in a Sigma 3–15 centrifuge. The plate was then analysed for target transcript levels by real-time PCR using an Applied Biosystems PRISM 7700 instrument. Standard operating conditions of 50°C for 2 min (for Uracil N-glycosylase activity), 95°C for 10 min (for hot-start taq polymerase activation) and forty cycles of 95°C for 15 s (denaturation) and 60°C for 1 min (annealing and extension) were used.
Additional blood analyses
Blood haematocrit was measured by the microhaematocrit method using heparinized capillary tubes and a dedicated centrifuge. Hb, plasma protein, albumin, glucose and HDL were measured using commercial assay kits (Asan Pharmaceuticals, Seoul, South Korea), and LDL was calculated using the Friedwald formula. Plasma thiobarbituric acid reactive substances were determined by the method of Yagi (Reference Yagi1984) and plasma α-tocopherol was measured by the method of Bieri et al. (Reference Bieri, Tolliver and Catignani1979) using reversed-phase HPLC (Shimadzu Corporation, Kyoto, Japan). Plasma zinc was determined on duplicate samples using atomic absorption spectrophotometry (Solaar SP9, Unicam, UK) after 5-fold dilution with 0·1 m-HCl and centrifugation. The accuracy of zinc determination was verified by frequent analysis of a standard reference material (Trace Elements, Serum Level 1; Seronorm, Sero, Norway) which was prepared by dissolving the freeze-dried powder in ultrapure water, as instructed and diluting 5-fold with 0·1 m-HCl followed by centrifugation. Plasma homocysteine levels were analysed by an isotope dilution GC–MS technique (Calder et al. Reference Calder, Garden, Anderson and Lobley1999).
Statistical analysis
A correlation-based principal component analysis was performed on the study variables and the relationship between the variables was then visualized in a corresponding bi-plot (Fig. 4). Correlations were calculated using the Pearson correlation coefficient. For the multiple regression analysis, a stepwise regression method was used to find the appropriate model. The ‘Stepwise’ procedure of the computer program S-Plus 2000 (1999, MathSoft Inc., Cambridge, MA, USA) which is based on the Efroyson-algorithm (Miller, Reference Miller1979), was used with default settings.
Results
Zinc intake
The mean zinc intake for males and females in all rural localities studied was estimated to be 7·0 and 6·5 mg/d, respectively (Table 1). However, when corrected for lean body mass, zinc intake was significantly higher in females than males (Table 1). The range of zinc intake was very wide, being 1·7–20·6 mg/d, although over 75 % of all subjects had an intake of between 4 and 8 mg/d (Fig. 1). The phytate:Zn ratio was in excess of 20, and the phytate × Ca:Zn ratio was in excess of 200 for most localities (Table 1).

Fig. 1 Zinc intake frequency distribution profile of volunteers (□, males; ■, females) from all localities. For details of procedures, see p. 248.
Plasma zinc and mononuclear cell metallothionein-2A mRNA
As with zinc intake, plasma zinc showed a wide variation ranging from 6·5 to 20·4 μm (Fig. 2). The overall mean for 110 subjects was 12·1 μm, with males having slightly higher levels (12·7 μm) than females (11·6 μm). The levels of MNC MT-2A mRNA were 1·5-fold higher in females than in males (P = 0·05). There was considerable locality-related variation in MT-2A mRNA levels (Table 1) and they tended to increase with age for both male and female subjects, although this trend was not statistically significant (Fig. 3(A)). There was a significant negative association between MT-2A mRNA and plasma zinc (Fig. 3(B)).
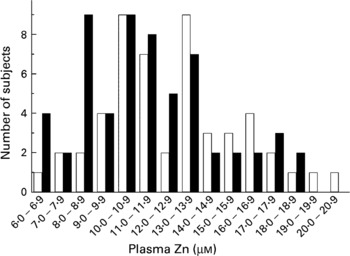
Fig. 2 Plasma zinc frequency distribution profile of volunteers (□, males; ■, females) from all localities. For details of procedures, see p. 250.

Fig. 3 Levels of mononuclear cell (MNC) metallothionein-2A (MT-2A) mRNA related to volunteer age (A; ■, males; □, females) and plasma zinc (B). For details of procedures, see pp 248 and 250. Values are means with their standard errors depicted by vertical bars. Regression of plasma zinc with MNC MT-2A mRNA gave a correlation coefficient (R) of − 0·296 (P = 0·004) but there was no significant correlation of MT-2A mRNA with age (P = 0·111).
Principal component analysis
Figure 4 shows the bi-plot of the principal component analysis of all the study variables and highlights and summarizes all interactions in one figure, including those mentioned earlier. Notable positive associations were between plasma zinc and plasma glucose, and dietary zinc intake and plasma glucose. Negative associations included dietary zinc intake and phytate:Zn ratio. A highly significant positive correlation (R 0·53, P < 0·001) between dietary zinc intake and phytate intake was observed (data not shown).

Fig. 4 Principal component analysis of study variables. The central point from which all lines radiate represents a score of zero for both principal components. Lines radiating in a similar direction are made by variables that show positive associations whereas those radiating in opposite directions are made by variables that are negatively correlated. For example, mononuclear cell metallothionein-2 mRNA (MT) is negatively correlated with plasma Zn (Fig. 3(B)). Glucose refers to plasma glucose. LBM, lean body mass; Phy, dietary phytate intake; Pro, plasma total protein; TBARS, plasma thiobarbituric acid reactive substances.
Multiple regression analysis
In the multiple regression analysis, the influence of all measured variables on the variation in plasma zinc and MNC MT mRNA levels was evaluated. The most influential of these variables are shown in Table 2 in order of decreasing statistical significance. In the case of plasma zinc, the most influential variable was the serum albumin level, and in the case of MNC MT-2A mRNA it was the plasma zinc level.
Table 2 Factors which were most influential on the variation in plasma zinc and mononuclear cell MT-2A mRNA, determined using stepwise multiple correlation. Explanatory variables are listed according to their significance and R2 indicates how much of the response variation is explained by these factors (100 % when R2=1)†
† For details of procedures, see p. 250.
Discussion
Dietary zinc intake by rural Koreans is known to be below what is considered adequate, and the risks of zinc deficiency are compounded by high dietary intake of phytic acid and a low intake of animal protein (Kwun & Kwon, Reference Kwun and Kwon2000). Phytate is a tenacious chelator of zinc and reduces zinc absorption (Lo et al. Reference Lo, Settle, Steinke and Hopkins1981; Krebs, Reference Krebs2000; Lonnerdal, Reference Lonnerdal2000) and high molar ratios of phytate:Zn in human populations have been associated with zinc deficiency (Ruz et al. Reference Ruz, Cavan, Bettger, Thompson, Berry and Gibson1991). In the present study, phytate:Zn molar ratios were >15 in all but one locality, indicating low zinc absorption (Hotz et al. Reference Hotz, Lowe, Araya and Brown2003). Dietary zinc intake (mean intake of 7·0 and 6·5 mg Zn/d for males and females, respectively) was considerably lower than in metropolitan Korean localities (about 11 mg Zn/d; Kwun & Kwon, Reference Kwun and Kwon2000; Lee et al. Reference Lee, Kwak, Yoon, Kwon, Beattie and Kwun2004) and also in western countries such as the UK (mean intake of 10·2 and 7·4 mg Zn/d for males and females, respectively) (Henderson et al. Reference Henderson, Irving, Gregory, Bates, Prentice, Perks, Swan and Farron2003). Phytic acid intake showed a very significant positive correlation with zinc intake because they both tend to be found in the same foods, particularly grain, soyabean and its products, all of which are common constituents of Korean diets. However, principal component analysis indicated a negative correlation between phytate/zinc and zinc intake, suggesting that the ratio of phytate to zinc was higher at low zinc intake. This would indicate that individuals most at risk of zinc deficiency through low consumption of zinc may be at even higher risk due to poor zinc absorption efficiency. Calcium is also a dietary antagonist of zinc absorption and a high index, calculated from multiplying molar levels of calcium × phytate and dividing by zinc, may induce zinc deficiency (Ruz et al. Reference Ruz, Cavan, Bettger, Thompson, Berry and Gibson1991). The significance of calcium influences on zinc absorption, particularly in view of its binding affinity for phytic acid and the potential to compete with zinc binding, remains controversial (Lonnerdal, Reference Lonnerdal2000). Subjects in most Korean localities had a phytate × Ca:Zn index of >200, with some individuals having an index of 500–1000. Once again, individuals with a lower zinc intake tended to consume a higher proportion of Ca:Zn and phytate:Zn. On the basis of previous evaluations of dietary zinc intake and the impact of absorption inhibitors (Krebs, Reference Krebs2000; Lonnerdal, Reference Lonnerdal2000), it seems likely that most of the subjects recruited for the present study were zinc deficient. Unfortunately, there are no reliable markers of zinc status, but previous studies have demonstrated that rural Koreans have significantly lower levels of plasma alkaline phosphatase, a zinc-dependent enzyme, than found in urban Koreans (Lee et al. Reference Lee, Kwak, Yoon, Kwon, Beattie and Kwun2004).
Plasma zinc levels were not significantly related to dietary zinc intake, whether expressed as mg Zn/d or as a ratio with phytate and/or calcium, and were similar to those reported previously for Korean adults (Paik et al. Reference Paik, Joung, Lee, Lee, King and Keen1999; Andree et al. Reference Andree, Kim, Kirschke, Gregg, Paik, Joung, Woodhouse, King and Huang2004; Lee et al. Reference Lee, Kwak, Yoon, Kwon, Beattie and Kwun2004). Since it is highly likely that some of the subjects in the present study were zinc deficient and others were zinc adequate, the lack of responsiveness of plasma zinc to varying zinc status is consistent with the current consensus of opinion (Wood, Reference Wood2000; Hambidge, Reference Hambidge2003). The multiple regression analysis indicated that plasma zinc was most influenced by serum albumin levels, followed by blood Hb, blood glucose and HDL. The variables identified by the analysis accounted for only 31 % of the variance in the plasma zinc data, and so other unaccounted for influences were also present. The positive association of plasma zinc with serum albumin could relate to the role of this protein in zinc transport, but considering that albumin is present in considerable molar excess to the bound zinc, an explanation based on simple binding capacity is not credible. The positive association of plasma zinc with blood Hb was also quite strong, and a positive association between Hb and haematocrit was also apparent from the principal component analysis. This suggests that erythrocyte counts may be reduced when plasma zinc is low, and the observation that chronically zinc-deficient mice become anaemic due to an attenuation of erythropoesis (King et al. Reference King, Frentzel, Mann and Fraker2005) would seem to support this hypothesis. Anaemia has previously been associated with zinc deficiency but has been attributed to concomitant high dietary phytate intake, which also inhibits iron absorption. The positive relationship between blood glucose and plasma zinc is contrary to what might be expected from the known inverse relationship between these variables (Sondergaard et al. Reference Sondergaard, Stoltenberg, Doering, Flyvbjerg and Rungby2006). Zinc stimulates insulin secretion (Huber & Gershoff, Reference Huber and Gershoff1973) and receptor activation (Haase & Maret, Reference Haase and Maret2003) which facilitates glucose uptake by cells and elicits a decrease in blood glucose levels. Acute zinc deficiency is reported to reduce circulating levels of homocysteine in rats (Hong et al. Reference Hong, Keen, Mizuno, Johnston and Tamura2000) but there was no evidence for any association between plasma homocysteine and either dietary zinc intake, plasma zinc or MNC MT mRNA levels (data not shown).
The strongest association of MNC MT-2A mRNA levels was with plasma zinc levels, but it should be noted that the negative correlation, which was highly significant for male and female data collectively (P = 0·004), was much more significant in women (P = 0·02) than in men (P = 0·22) (data not shown). The inverse relationship could be explained in several different ways. Since zinc stimulates MT gene expression, a higher plasma level of zinc may be expected to promote an increase in MT mRNA within cells directly exposed to blood plasma. However, in the long term, the presence of adequate MT protein levels may feed back to down-regulate gene expression. Alternatively, stress factors or the presence of inflammatory cytokines may stimulate MT expression in tissues including MNC and the liver, which would promote transfer of zinc from the plasma into the tissues. This is a well-characterized response of plasma zinc to stress (Shenkin, Reference Shenkin1995) and is absent in MT-deficient mice (Rofe et al. Reference Rofe, Philcox and Coyle1996). Another possible explanation is an influence of zinc on MNC composition. Lymphocytes, monocytes and granulocytes express different levels of MT (Kimura, Reference Kimura1991; Aydemir et al. Reference Aydemir, Blanchard and Cousins2006) and a zinc-related change in the proportion of cell type may affect apparent MT gene expression. A suppressive effect of zinc deficiency on lymphopoiesis and the reverse effect on myelopoiesis has been reported (Fraker & King, Reference Fraker and King2004). However, given the wide differences in MT expression that we observed and the predominance of lymphocytes in MNC fractions, it seems unlikely that a change in the proportion of cell type could entirely explain the relationship between MT mRNA and plasma zinc. However, in the present study, it was impracticable to either separate the different cell types or quantify their numbers, so we are unable to discount this possibility.
A weak negative correlation (R − 0·192) between MNC MT-2A mRNA and plasma LDL was not statistically significant at the 5 % level (P = 0·067). However, by multiple regression, LDL was a significant contributory variable influencing the variance of MNC MT-2A mRNA levels (P = 0·028). This apparent relationship requires further study for confirmation.
Of particular interest were the significantly higher levels of MNC MT-2A mRNA in women compared to men and the age-related increase in MT expression. The latter relationship was not statistically significant but age was identified as a significant factor influencing MT-2A mRNA levels from the stepwise multiple regression analysis and is worthy of further study. If MT expression were only dependent on plasma zinc, then very little age-related change in MT levels might be expected. However, blood levels of cytokines such as IL-6, which are also known inducers of MT (Schroeder & Cousins, Reference Schroeder and Cousins1990), increase with age (Krabbe et al. Reference Krabbe, Pedersen and Bruunsgaard2004) and it is likely that the age-related increase in MT expression seen in the present study is a consequence of increased inflammatory stress and/or medication in the elderly. As a consequence, plasma zinc levels might be expected to decrease with age, but this was not the case in the present study. There was no significant correlation between age and plasma zinc (P = 0·464).
In conclusion, many of the rural Korean subjects recruited for the present study were likely to be zinc deficient according to their low dietary zinc intake and high intake of zinc absorption inhibitors. Plasma zinc was within the normal range for adults and was unrelated to age or gender while MNC MT-2A mRNA showed a weak age-related increase and also higher levels in female subjects. A stronger inverse relationship between MT mRNA levels and plasma zinc might indicate that induction of MT in MNC by an unidentified factor, such as inflammatory cytokines, could favour transfer of zinc from the plasma to the tissues. MT mRNA levels did not correlate with any measure of dietary zinc intake, and so either the latter is a poor predictor of zinc status or MNC expression of MT-2A cannot be used as a diagnostic indicator of zinc status in free-living older human subjects.
Acknowledgements
J. H. B., A. M. K. and C. M. were funded by the Scottish Executive Environment and Rural Affairs Department. C. S. K. was supported by a grant from the Korean Science and Engineering Foundation (grant number F01-2004-000-10 277-0). I. S. K. was supported by the Korean Ministry of Health and Welfare (grant number 03-PJ1-PG3-22 000-0038).


