


Dietary pattern and nutrition are modifiable factors in relation to the risk of chronic diseases, such as obesity and diabetes mellitus( Reference Hawkes, Smith and Jewell 1 ). Thus, the incidence and impact of poor nutrition can be reduced through dietary behaviour modification and a systems approach of changes in the food supply and food labelling( Reference McGeoch, Holtrop and Fyfe 2 , Reference England, Thompson and Jago 3 ).
Snacking is a typical eating behaviour, and may be associated with poor nutrition because generally snack foods are energy and refined carbohydrate dense and nutrient poor( Reference Feeley, Musenge and Pettifor 4 – Reference De Vet, Stok and De Wit 6 ). An example is ‘muesli-style’ snack bars that are often regarded as being healthy; however, most commercial snack bars are high in added sugar and fat, energy dense, and low in protein, fruits and dietary fibre( Reference Yan, Brown and Parsons 7 ). Snacking behaviour is habitual and is a dietary behaviour that has potential to be modified by changing the food environment( Reference De Vet, Stok and De Wit 6 ). In New Zealand, 55 % of packaged food has been reported to be unhealthy on the basis of nutrient profile systems( Reference Ni Mhurchu, Brown and Jiang 8 ). It has been shown that low glycaemic index (GI) foods and low glycaemic load (GL) diets may reduce metabolic risk factors including postprandial hyperglycaemia, insulin resistance and impaired haemostasis( Reference Burton, Monro and Alvarez 9 ), as well as improve glycated Hb (HbA1c)( Reference Brand-Miller, Hayne and Petocz 10 – Reference Solomon, Haus and Kelly 12 ). There has been a call for product reformulation and healthier foods in retail outlets and vending machines to meet growing consumer needs( Reference Hawkes, Smith and Jewell 1 , Reference Siro, Kapolna and Kapolna 13 ).
The ‘Nothing Else’ brand is a front-of-pack label that lists up to eight ingredients, all perceived as natural( Reference Brown, Donaldson and Parsons 14 ). A Nothing Else almonds and dates bar, its recipe met the nutrient profiling scoring criterion for a health claim( 15 ), has been developed, and the GI was low (fifty-two)( 16 ). Our previous studies revealed that compared with two top-selling commercial snack bars of equal weight, consumption of the Nothing Else bar had a 30 % reduction in incremental area under the blood glucose response curve and induced the highest fullness rating and the lowest hunger rating over 2 h( Reference Yan, Parsons and Whalley 17 ). However, it is unclear whether consumption of healthier snack foods of this type has long-term effects on snacking habits and blood glucose control.
The present study aimed to investigate (1) compliance with and (2) the glycaemic impact of daily consumption of the Nothing Else bar over 6 weeks in a stepped-wedge randomised trial. Stepped-wedge randomised trials are particularly used for evaluations where an intervention is predicted to do more good than harm despite lack of evidence of effectiveness( Reference Hussey and Hughes 18 , Reference Mdege, Man and Taylor Nee Brown 19 ). Secondary objectives were to collect participants’ perceptions of the new prototype bar and concomitant changes in habitual snacking behaviour.
Methods
Participants
A total of thirty participants were recruited from professionals at a tertiary institute in Auckland. People were eligible if they usually ate snacks containing refined carbohydrates, and particularly ate at least three to four snack bars a week, were ≥40 years of age, and were relatively sedentary (on the basis that they are more likely to be insulin resistant and benefit from a lower GL in their diet). They were also required to not be on any medication that would affect blood glucose concentration and could commit to the time requirements of the trial. This study was conducted according to the guidelines laid down in the Declaration of Helsinki, and all procedures involving human subjects were approved by the Auckland University of Technology Ethics Committee (reference no. 14/379). Participants were given full details of the study protocol and the opportunity to ask questions. All participants signed a consent form before participation.
A power calculation was performed using the results of other experimental studies in GI, glycaemic control and HbA1c. Jimenez-Cruz et al. ( Reference Jimenez-Cruz, Bacardi-Gascon and Turnbull 20 ) and Rizkalla et al. ( Reference Rizkalla, Taghrid and Laromiguiere 21 ) reported a significant improvement in HbA1c after 4–12 weeks’ consumption of low-GI diets by people with diagnosed diabetes mellitus. The effective changes in HbA1c reported in the literature are in the range of 0·4–0·7 % (5–7 mmol/mol). In the present study, to detect a change of 0·6 % (6 mmol/mol) in HbA1c (equivalent to one diabetes medication)( 22 , Reference Horswell, Wascom and Cerise 23 ) using a two-step randomised trial, twenty-six participants would be sufficient to have >80 % power and an α of 0·05. A total of thirty participants would allow for a 15 % dropout rate.
Snack preparation
The Nothing Else almonds and dates bars were prepared by AB Foods Ltd, following the initial development of the recipe at Auckland University of Technology. The water activity of the bars was 0·68 that ensured shelf stability without preservatives. The nutrient profile of the snack bar is outlined in Table 1. The participants were provided with a colour copy of the front and back of pack labels of the Nothing Else bar as part of the informed consent process and to simulate the information they would receive if they bought a commercial bar.
Table 1 Nutritional profile of the Nothing Else almonds and dates barFootnote *
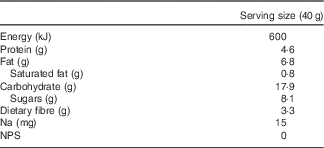
NPS, nutrient profiling score( 15 ).
* Ingredients: oats (43 %), dates (19 %), almonds (13 %), oat bran, egg white, honey, sunflower oil, cinnamon.
Study design
This study was a stepped-wedge trial in which thirty participants were assigned to two groups to receive the intervention using a stratified random design. Two steps were applied with a 6-week period between steps. The first group (n 15) started receiving the intervention in week 1. The second group (n 15) started receiving the intervention in week 6. The stepped-wedge design is more ethical and practical compared with parallel or cross-over designs. In this approach, the cross-over is in one way only, from control to intervention, and does not require a washout period. Participants are randomly allocated a time point to receive intervention. Participants receive intervention in a random order, although all the participants are unable to start the trial at the same time; however, by the end of the trial, all the participants receive the intervention( Reference Hussey and Hughes 18 , Reference Mdege, Man and Taylor Nee Brown 19 ).
In the present study, participants were not asked to change their normal diet before receiving the intervention. In the 6-week intervention period, participants were asked to consume the Nothing Else snack bar each day as their main snack choice, and were instructed that they could still eat fresh fruits. Participants were supplied with enough snack bars each week to replace their usual snacks and asked to keep a snacking diary to record the numbers of the Nothing Else bars consumed as a measure of compliance, as well as time of consumption of the snack bar. Participants had opportunities to ask for more snack bars as needed.
Snacking habits were assessed with a short dietary habits questionnaire designed to collect information over the previous 6 weeks about the consumption of sweets; baked goods such as muesli bars, sweet biscuits, cakes, cookies, brownies, muffins and pies; fruit juice and sugary drinks; and high glycaemic impact/GL foods such as white bread and rice. The questionnaire was adapted from a validated short FFQ( Reference Boniface 24 ), which was designed to measure sugar intake in Pacific Islanders living in South Auckland, New Zealand. The response options for the frequency of intake of specific foods and a specified amount of food were as follows: less than once per month, less than once per week, 1, 2, 3, 4, 5, 6, 7 or more times/week, plus 2–3, 4–6 times/d for recording frequency greater than once per day. Data included intake of specific foods both at home and away from home. The physical activity levels at work (levels 1–4) and at leisure time (levels 1–5) were ranked using the two questions of Johansson & Westerterp( Reference Johansson and Westerterp 25 ). The questionnaire was completed by each participant three times, at weeks 0, 6 and 12.
HbA1c concentration was tested using capillary blood filled in a test cartridge (Axis-Shield) and then determined by an AfinionTM hemoglobin A1c device (Axis-Shield). The point-of-care measure has been reported as a rapid, accurate and precise method( Reference Dixon-Woods, McNicol and Martin 26 , Reference Wan Mohd Zin, Ahmad Kamil and Tuan Soh 27 ). For both groups, finger-prick HbA1c concentrations were tested at weeks −1, 0 (1 week earlier and immediately before random allocation) for baseline, and then four times at weeks 4, 6, 10 and 12. In total, the duration of the trial was 13 weeks.
Data analysis
Statistical analyses were performed using SPSS, version 23, 2015 (IBM Corporation). Non-parametric data were presented as medians and interquartile ranges and categorical variables as percentage of frequency. Continuous, normally distributed data were summarised as mean values and standard deviations. Differences in non-parametric data within groups were determined by the related-samples Wilcoxon’s signed-rank test. Baseline HbA1c was calculated as the mean of measures at weeks −1 and 0. The between-group comparison of HbA1c was carried out using an independent t test. The effects of the intervention (started week 0 or week 6) on changes (∆) in HbA1c within group at weeks 6 and 12 (for intervention in first or second time period) over the 12-week time course were assessed using a repeated-measures ANOVA with period as a cofactor. All statistical tests were two-tailed, and a 5 % significance level was maintained throughout the analysis. Difference in proportions was assessed using one-sample z test. Compliance was assessed as the percentage of participants who consumed at least five bars a week for 6 consecutive weeks. Any changes in participant eating behaviour were in descriptive terms.
Results
In all, twenty-eight healthy subjects (ten men, eighteen women; aged 44–71 years) completed the 13-week trial. Two participants withdrew in the 1st week: one could not receive the snack bar on a weekly basis and another could not attend the session for the second HbA1c measurement. Physical activity levels did not change across the intervention for both groups; the majority (>64 %) of participants reported low levels of physical activity at work and only a slight increase in physical activity at leisure time.
A total of twenty-six participants reported that they consumed between five and fourteen bars a week in the intervention period (Table 2). Two participants had a week each of sickness and did not consume the Nothing Else bars that week. Overall, 92 % of the bars provided was consumed as directed.
Table 2 Snacks and high glycaemic impact foods consumed in the control and intervention periods (Medians and interquartile ranges (IQR))
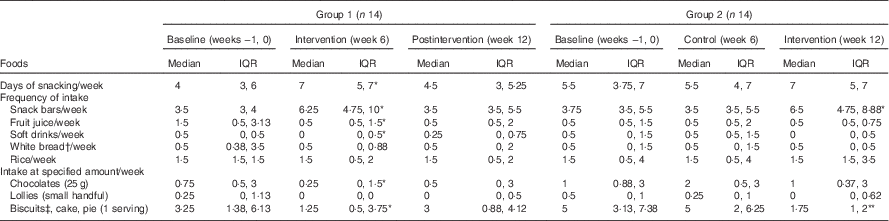
Within the same row and same group, the value was significantly different to baseline: *P<0·05, ** P<0·01 (Wilcoxon’s signed-rank test).
† White bread refers to breads made from wheat flour from which the bran and the germ layers have been removed.
‡ Serving size was two pieces.
Participants reported that in the 6 weeks before the trial they consumed snacks on 3–7 d/week, with biscuits, cakes and pies being the most frequently consumed snacks in addition to snack bars (Table 2). During the 6-week intervention period, participants in both groups consumed more snack bars (P<0·05, Table 2) than during the control period. In both groups, consumption of the snack bar was associated with a substantial reduction in intake of biscuits, cakes and pies (approximately 2 servings/week, P=0·044, 0·003 in groups 1 and 2, respectively; Table 2). More than 60 % of the participants did not consume biscuits or ate biscuits less than once per week during the intervention period (data not shown). The consumption of fruit juice was reduced (approximately 1 serving/week, P=0·029) in the first group but not in the second group. Furthermore, there was a tendency for white bread to be consumed less often but there was no change with the frequency of rice consumption in both groups. From the self-report of daily snack consumption, all snack bars were eaten in mid-morning and/or mid-afternoon, which are the typical tea break times in New Zealand.
For the baseline HbA1c tested twice a week apart, there was no difference in the mean value (36, 36 mmol/mol (95 % CI −0·4, 0·8), P=0·449). The average of the pre-intervention measures was used as the baseline comparison (Table 3). There was no significant difference in HbA1c between two groups at week 6 (P=0·673). There was no effect of period of treatment. Overall trivial-to-moderate decreases in HbA1c (Table 3) were observed in both groups after 6 weeks’ consumption of the Nothing Else snack bar, with not all participants experiencing a decrease (Fig. 1). In all, twenty participants experienced a decrease or no change in HbA1c (range 0–4 mmol/mol, five participants had no changes observed), whereas eight participants (four men, four women; five overweight; baseline HbA1c 36·4 (sd 1·19) mmol/mol) experienced an increase in HbA1c (range 0·5–2·5 mmol/mol, Fig. 1).
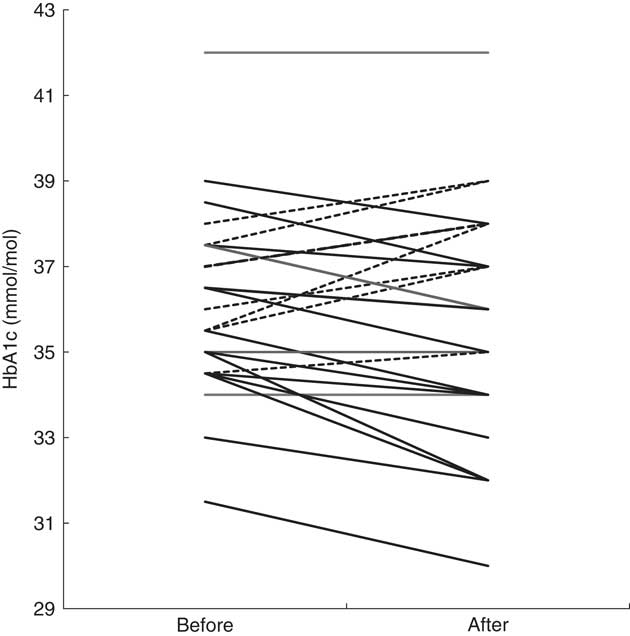
Fig. 1 Changes in glycated Hb (HbA1c) of individual participants after a 6-week intervention (n 28), before v. after intervention. ![]() , Increase;
, Increase; ![]() , decrease or no change.
, decrease or no change.
Table 3 Changes (∆) in mean values (mmol/mol) of glycated Hb (HbA1c) at weeks 6 and 12 in twenty-eight subjects (Mean values and standard deviations)
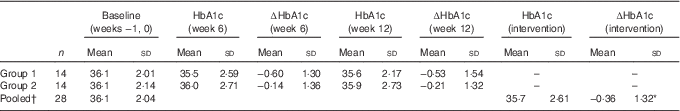
† HbA1c pooled, HbA1c mean values in twenty-eight subjects before and after the intervention: *P=0·165 (repeated-measures ANOVA).
The HbA1c of the participants in group 1 (n 14) decreased in the first 6 weeks when receiving the intervention, and then increased slightly once the intervention was completed, but were still less than baseline values. The HbA1c of the participants in group 2 (n 14) tended to decrease during the 6-week control period and continued to decrease during the intervention period (Table 3). Only eight participants out of twenty-eight (28·6 %) had an increase in HbA1c after 6 weeks of consumption of the bars. Compared with the null hypothesis of 50 % increasing and 50 % decreasing, the intervention was more likely to decrease or have no change in HbA1c of an individual (P=0·024, 95 % CI 13·2, 48·7 %, z test for proportions).
Discussion
To our knowledge, this is the first study that has evaluated the effects of daily consumption of a healthier snack on snacking habits and glycaemic control over a 6-week period. There are two main findings. The first is that the participants found the bar acceptable, and both anecdotally and from self-reported snack diaries the twenty-eight participants consumed at least five and up to fourteen bars each week. The only exception was two participants who did not consume any bars for 1 week because of sickness. The second main finding is that after 6 weeks’ consumption of the Nothing Else bar as main snacks, there was overall a trivial decrease in HbA1c concentration. For three-quarters of the twenty-eight participants, there was no change (n 5) or a decrease (n 15) in HbA1c from baseline. In other words, compliance with the intervention was good and there was a trend towards a favourable effect on glucose homoeostasis.
Compliance with treatments and medication is a challenge to effecting behaviour change. A few intervention studies have investigated the effect of snacking on energy consumption and have shown that there was some energy compensation in normal weight participants( Reference Bellisle 5 ). In contrast, other studies have shown that consumption of snack foods with high fat, sugar and salt reduces diet quality and promotes adiposity( Reference O’Connor, Brage and Griffin 28 , Reference Barnes, French and Harnack 29 ). This study did not seek to change snacking frequency but to replace less-healthy usual snacks with a healthier option. It was assumed that some participants may not like the snack and withdraw from the study, but this did not happen. After 6 weeks, we have shown that repeated exposure increased the acceptance of a new type of snack, as has been demonstrated by others( Reference Stein, Nagai and Nakagawa 30 , Reference Hausner, Hartvig and Reinbach 31 ).
The increased number of Nothing Else bars consumed during the intervention period was associated with a decrease in the number of other snacks, and thus did not necessarily indicate an increase in energy consumption or snacking. Rather than change the frequency or time of snacking, we sought to change the availability of a healthier snack within the everyday environment and dietary pattern. Availability of healthier food products combined with health-related information has been associated with an improvement in dietary habits( Reference Roy, Kelly and Rangan 32 ). In the present study, participants were given the front and back of pack labels and explained the rationale of the ‘healthier’ snack bar. The primary researcher visited participants weekly, and the healthier snack was provided free of charge. Although this would not happen in the real world, it is known that improved food literacy and environmental dietary modification could improve the effectiveness of dietary interventions or changes in the food supply( Reference Geaney, Scotto Di Marrazzo and Kelly 33 ). This is shown in the present study by the decrease in the consumption of less-healthy usual snacks such as chocolates, biscuits, cake and pies during the time the healthier snack alternative was available.
Consumption of low-GI foods, low-GL diets( Reference Jimenez-Cruz, Bacardi-Gascon and Turnbull 20 , Reference Rizkalla, Taghrid and Laromiguiere 21 ) and dietary fibre( Reference Jiang, Qiu and Zhao 34 ) are known to improve glycaemic control. Jimenez-Cruz et al. ( Reference Jimenez-Cruz, Bacardi-Gascon and Turnbull 20 ) reported a significant reduction in HbA1c (from 8·5 (sd 0·28) to 8·1 (sd 0·24) %, P<0·01) after 6 weeks of low-GI diet treatment with fourteen subjects. Rizkalla et al. ( Reference Rizkalla, Taghrid and Laromiguiere 21 ) also reported an improvement in HbA1c (from 7·56 (sd 0·36) to 7·17 (sd 0·39) %, P<0·05) after a 4-week low-GI diet treatment with twelve men with type 2 diabetes. Both studies compared the glucose profiles between low- and high-GI diets. In the present study, participants did not have hyperglycaemia and were asked only to replace their snacks; main meals were not controlled and dietary GL was not known. Although many studies have reported that GI of food might play a more important role in glycaemic control( Reference Brand-Miller, Hayne and Petocz 10 , Reference Jiang, Qiu and Zhao 34 ), some studies have shown that the effective glycaemic control (HbA1c) was attained when a low-GI diet was associated with a low GL( Reference Jimenez-Cruz, Bacardi-Gascon and Turnbull 20 , Reference Rizkalla, Taghrid and Laromiguiere 21 ). Furthermore, even though the trial was arranged to avoid public holidays, some special occasions such as family events and a decrease in physical activity could confound the results. We propose that the factors discussed above may partially explain why eight participants had an increase in HbA1c after consumption of the snack bars for 6 weeks, given that there was no difference in their baseline snacking habits and baseline HbA1c (Fig. 1) compared with other participants.
The compliance and reported changes to snacking might be due to the Hawthorne effect( Reference Schwartz, Fischhoff and Krishnamurti 35 ), related to the participants’ awareness of participation in an experimental trial and observation because participants were not blinded to the treatment. This was minimised by asking half the participants to delay the intervention for 6 weeks (a stepped-wedge trial), but to complete the snacking habits questionnaire and their HbA1c to be measured for the first 6 weeks. This would allow the effect of participation to be accessed.
The main limitation of the present study was a common issue for intervention studies in that there was no control and the participants were free-living persons. Snacking habits were self-reported and there may be recall bias in the reported consumption of snacks. Information on the regularity of meal intakes was not recorded, although high glycaemic impact/GL foods such as white bread and rice were included in the questionnaire. Further, 6 weeks may not be long enough to see meaningful effects in HbA1c. Nevertheless, the design of the study represented real life, had a minimal participant burden, and there was high participation and compliance over the 12 weeks. This study is proof-of-principle that changes in the food supply and food branding and labelling have the potential to change dietary patterns and improve public health. Whether a similar effect of a healthier snack would be seen in a much longer term requires further study.
The Nothing Else bar was found acceptable as part of a daily dietary pattern. The bar, with its higher protein and fibre content and low GI, improved the nutritional quality of dietary snacking habits and was likely to improve glycaemic control. It is concluded that changes in the food supply, together with ingredients and nutritional information, have the potential to improve habitual snacking behaviour and reduce the impact of poor nutrition on public health in the longer term.
Acknowledgements
The authors thank Shabnam Jalili-Moghaddam for her technical assistance.
The present study was supported by Peter Tan, the director of AB Foods Ltd, Auckland, who provided the Nothing Else almonds and dates snack bars for the study. The development of the healthier snack bar is a project of the AUT food network, which may lead to a commercial product that would bring an income to the University associated with the intellectual property.
The authors’ contributions are as follows: M. R. Y. designed and conducted the trial, analysed and interpreted the data and wrote the first draft of the manuscript. E. C. R. contributed to the study design, data analyses, and interpretation and revisions of the manuscript. A. P. and G. A. W. contributed to the study design and critique. All authors read and approved the final version of the manuscript.
The authors declare that there are no conflicts of interest.


