


Energy metabolism is known to be affected by ambient ‘external’ temperature. In both humans and rats, external cold exposure was reported to increase energy expenditure(Reference van Marken Lichtenbelt, Schrauwen and van de Kerckhove1,Reference Dauncey2) and energy intake(Reference Brobeck3–Reference Rothwell and Stock5) to cover the cost of energy needed to sustain body temperature at 37°C, in what is known as a form of a protective mechanism against hypothermia. In rats, external cold exposure (6°C) for 3 weeks was reported to stimulate ad libitum food intake and thermogenesis (increase in interscapular brown adipose tissue mass), as an adaptive mechanism to low temperature(Reference Puerta and Abelenda6). The activation of brown adipose thermogenesis, through increased heat generation(Reference Ravussin, Xiao and Gavrilova7) and cutaneous thermoreceptors(Reference Morrison and Nakamura8), was proposed to counteract the variations in external temperatures. Moreover, in observational studies on humans, the positive association between ambient temperature with body weight and obesity may relate to the energy cost to sustain body temperature at 37°C(Reference Yang, Han and Cho9,Reference Valdés, Maldonado-Araque and García-Torres10) .
Whereas the impact of external cold exposure was extensively studied, the research on the effect of cold beverages ingestion is scarce. In humans, acute ingestion of cold water (about 4°C) was reported to increase energy expenditure (up to 25 %)(Reference Dubnov-Raz, Constantini and Yariv11,Reference Brown, Dulloo and Montani12) and lower the hypothalamic activity associated with satiety(Reference van Opstal, van den Berg-Huysmans and Hoeksma13). In broiler chickens, chronic ingestion of cold water (9°C) was reported to be positively associated with higher dietary intake and weight increment, in contrast to the decrease in growth and the metabolic rate usually witnessed under extreme heat stress conditions(Reference Park, Park and Hwangbo14). While, in cows, drinking of chilled water (10°C) induced an increase in feed intake(Reference Wilks, Coppock and Lanham15,Reference Milam, Coppock and West16) . Yet, it is not clear whether body composition is affected by the variations in the temperature of ingested water in the long term.
On the other hand, the consumption of sweetened (both energetic and non-energetic) beverages was reported to be associated with the development of obesity and its related diseases(Reference Malik, Schulze and Hu17–Reference Greenwood, Threapleton and Evans19). Beverages are mainly ingested cold(Reference van Opstal, van den Berg-Huysmans and Hoeksma13), and the potential involvement of the temperature of these beverages in the aetiology of obesity is far from clear. Furthermore, the impact of non-energetic sweeteners on obesity was surrounded by controversies due to the failure of non-energetic sweeteners to halt the prevalence of obesity in the last couple of decades(Reference Brand-Miller and Barclay20). Short-term studies reported favourable outcomes(Reference de Ruyter, Olthof and Seidell21,Reference De la Hunty, Gibson and Ashwell22) , while in contrast, long-term studies reported detrimental effects on weight gain, the incidence of type 2 diabetes and CVD(Reference Fagherazzi, Vilier and Sartorelli23,Reference Fowler, Williams and Resendez24) . In animals, the impact of non-energetic sweeteners on body weight and food intake was reported to be highly variable, and this may, in part, relate to the mode (diet or fluid), dose and/or type of ingested sweeteners(Reference Palmnäs, Cowan and Bomhof25–Reference Shankar, Ahuja and Sriram28).
A study was conducted to address some of the potential causes of these controversies by investigating the impact of the temperature of ingested beverages on body weight measures. The long-term effect of temperature manipulation of plain, energetic and non-energetic sweetened water on body measures, using the most common concentrations, was studied. Two experiments were conducted. In the first, we investigated whether presenting rats with cold water (about 4°C) can affect body weight measures and energy metabolism and can generate an increase in food intake in the same ways as with changes in external temperature. In the second experiment, we examined if beverage temperature manipulation can affect the impact of sweeteners – energetic (sucrose) and non-energetic (acesulfame K) – on body weight measures.
Materials and methods
Animal housing
The Institutional Animal Care and Use Committee of the American University of Beirut, Lebanon, approved the experimental protocol (no. 18-02-453). The study was performed by following the criteria outlined in the Guide for the Care and Use of Laboratory Animals. Male Sprague–Dawley rats (5–6 weeks old, Animal Care Facility, American University of Beirut) were housed individually in wire-bottom cages in a temperature 22 (sd 1)°C and light (reverse light cycle 12 h dark–12 h light, lights off at 10.00 hours) controlled room. Food was offered in regular food containers, easily accessible for rats, and water was given in water bottles specific for the wire-bottom cages.
Experimental design
Two separate experiments were executed. In each, all rats were placed on a 1-week adaptation period to familiarise them with the environment and the semi-synthetic diet (online Supplementary Table S1) and, then afterwards, they were randomly divided into their respective experimental groups for 8 weeks as follows:
Expt 1: effect of cold and room-temperature drinking water on body weight measures
Two groups of rats (n 9 per group) were used, group 1 (CW) was given cold water (about 4°C) (online Supplementary Fig. S1) and group 2 (NW) was given water at room temperature (about 22°C).
Expt 2: effect of cold and room-temperature sweetened (energetic and non-energetic) drinking water on body weight measures
Four groups were used in which sweetened (sucrose or acesulfame K) water was offered for 12 h (in the dark phase), followed by 12 h of plain water. The beverages of two of these groups were provided at a cold temperature (online Supplementary Fig. S1), as follows:
Group 1 (CSu, n 7): Cold (about 4°C) sweetened water (10 % sucrose energetic sweetener) was offered for 12 h, followed by 12 h of cold (about 4°C) plain water.
Group 2 (NSu, n 8): Room-temperature (about 22°C) sweetened water (10 % sucrose energetic sweetener) was offered for 12 h, followed by 12 h of room-temperature plain water.
Group 3 (CAk, n 6): Cold (about 4°C) sweetened water (0·05 % acesulfame K non-energetic sweetener; HYET Sweet) was offered for 12 h followed by 12 h of cold (about 4°C) plain water.
Group 4 (NAk, n 8): Room-temperature (about 22°C) sweetened water (0·05 % acesulfame K non-energetic sweetener) was offered for 12 h, followed by 12 h of plain room-temperature water.
Rats were fed ad libitum for 8 weeks their respective beverage and a semi-synthetic powder control diet (online Supplementary Table S1) based on the AIN-93G(Reference Reeves29) for optimal growth.
On the day of sacrifice, overnight fasted rats were anaesthetised with isoflurane (Forane®) and blood was collected from the superior vena cava. After that, rats were euthanised by severing their hearts and their livers were immediately excised, weighed, frozen in liquid N2 and stored at −80°C. Blood samples were centrifuged at 2200 g (3°C) for 15 min, and aliquots of plasma were collected and stored at −80°C until analysed.
Cold beverages
The bottles of the varied beverages (plain and/or sweetened water) were frozen; 10 ml of the corresponding cold beverage was added to the bottle before being weighed and offered to the rats. Bottles were wrapped in thermal insulators and changed every 6 h in order to maintain their coldness at a mean of 4°C throughout the experimental period (online Supplementary Fig. S1).
Food intake, body weight and composition
Food and water intake (difference in the weight of the water bottles), body weight and body composition using NMR minispec (LF110 BCA analyzer) were measured twice per week. Body weight, lean body mass and body fat mass were expressed as gross weight as well as gain changes from baseline to minimise the impact of the variations in initial body weight within the groups. Energy expenditure was estimated from the total energy intake and changes in body mass and composition(Reference Ravussin, Gutman and LeDuc30). Energy efficiency was calculated as the energy retained in the body per 100 kJ of energy consumed (kJ/100 kJ).
Livers were freeze-dried (FreeZone 6 Freeze Dryer, LABCONCO), and lipid was extracted with light petroleum (40–60°C) using an ANKOMXT10 extractor (ANKOM Technology). All determinations were carried out in duplicate.
Plasma analyses
Fasting plasma glucose, total cholesterol, HDL-cholesterol, TAG, albumin, plasma urea nitrogen and creatinine were determined with the Vitros 350 Chemistry System (Ortho-Clinical Diagnostics). The plasma insulin concentration was measured with an enzyme immunoassay using the Rat/Mouse Insulin ELISA Kit (EZRMI-13 K) (EMD Millipore Corporation).
Statistical analysis
The required number of rats was calculated using previously determined weight gain data (6·0 (sd 0·95) g/d) and assuming a 25 % difference in the mean, with a statistical power of 90 % and a 5 % significance level. Data were expressed as mean values and standard deviations. SPSS Statistics 25.0 software (IBM Corp.) was used for statistical analysis.
Expt 1: Unpaired sample t test was performed to compare the data between the two groups, and two-way ANOVA with time and temperature as fixed variables was used to analyse the results throughout the 8-week experimental period.
Expt 2: Two-way ANOVA with beverage temperature and sweetener type as factors was performed. Multiple-way ANOVA (general linear model) using time, sweetener and temperature as fixed factors was used to analyse the results throughout the 8-week experimental period.
Results
Expt 1: effect of cold and room-temperature drinking water on body weight measures
Baseline body weight, lean body mass and body fat were similar between the groups, and these parameters failed to reach significance by the end of the experimental period (online Supplementary Table S2). When changes from baseline (gain) were monitored over the experimental period, no differences in body weight gain were found between the groups (P = 0·220) (Fig. 1(a)), while changes in body composition were detected, in which lean body mass of the cold water group (CW) was significantly higher than that of the room-temperature group (NW) (P < 0·001) (Fig. 1(b)). However, the changes in body fat mass of the room-temperature group were significantly higher (P = 0·004) than that of the cold water group (Fig. 1(c)).
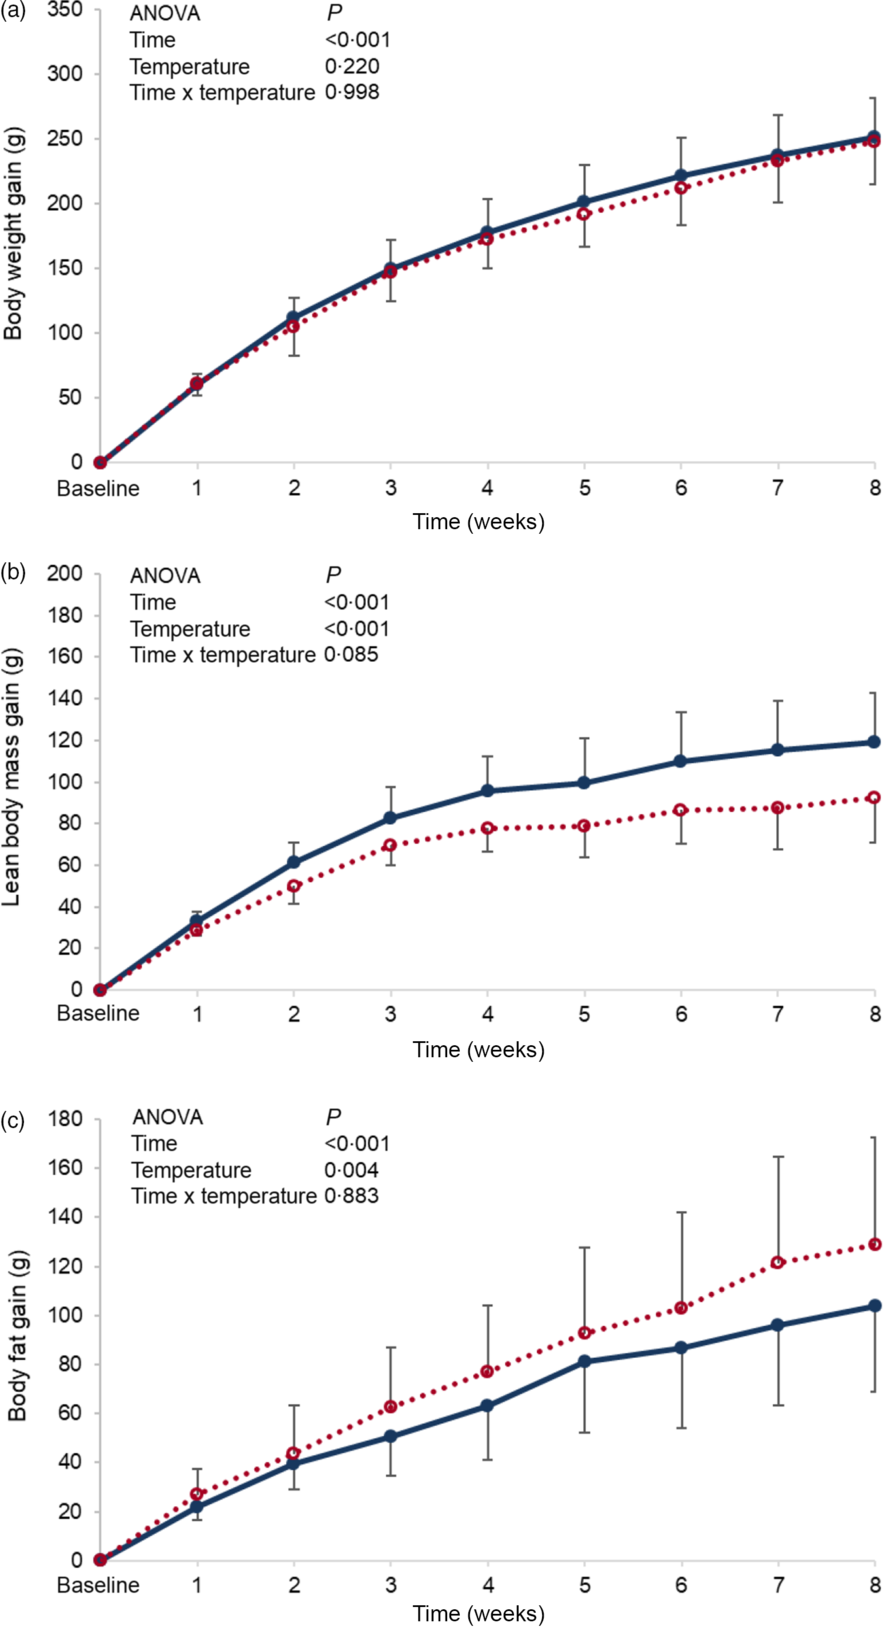
Fig. 1 Expt 1 – Effect of cold and room-temperature drinking water on body weight measures. Weekly body weight (a), lean body mass (b) and body fat (c) gain from baseline in grams of the two groups of rats over the 8-week experimental period. Group CW: cold water (about 4°C); Group NW: room-temperature water (about 22°C). Data are expressed as mean values and standard deviations of all values. A two-way ANOVA was performed with time and temperature of the water as factors, and time set as random. Significance was set at P < 0·05. ![]() , CW;
, CW; ![]() , NW.
, NW.
No differences in water intake were seen between the groups, and both energy intake and efficiency were not found to be significantly affected by the temperature of ingested water. Nevertheless, the computed total energy expenditure of the cold water group (CW) was significantly higher than that of the normal temperature group (NW) (P = 0·003) (Table 1).
Table 1. Expt 1 – Effect of cold and room-temperature drinking water on energy intake, expenditure, efficiency and some organ weights (Wt)
(Mean values and standard deviations)*
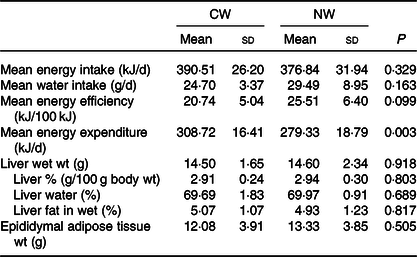
Group CW, cold water (about 4°C); Group NW, room-temperature water (about 22°C).
* Rats were maintained for 8 weeks on cold or room-temperature water. An unpaired sample t test was performed. Significance was set at a P < 0·05.
Moreover, the temperature of the ingested water was found not to affect liver weight and composition, as well as epididymal fat tissue weight (Table 1).
The measured fasting plasma metabolites (glucose, insulin, cholesterol, albumin, plasma urea nitrogen and creatinine) were not affected by the temperature of the drinking water except for the TAG levels that were found to be lower in the cold water group (P = 0·031) (Table 2).
Table 2. Expt 1 – Effect of cold and room-temperature drinking water on plasma metabolites
(Mean values and standard deviations)*
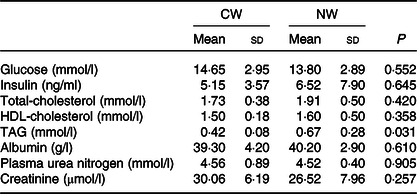
Group CW, cold water (about 4°C); Group NW, room-temperature water (about 22°C).
* An unpaired sample t test was performed. Significance was set at a P < 0·05.
Expt 2: effect of cold and room-temperature sweetened (energetic and non-energetic) drinking water on body weight measures
Baseline body weight, lean body mass and body fat were similar between the different groups, and no significant differences in these parameters were observed at the end of the experimental period (online Supplementary Table S3). However, when changes from baseline (gain) were monitored, a higher body weight gain was observed in the non-energetic sweetened groups (CAk and NAk) as compared with the energetic/sucrose sweetened groups (CSu and NSu) (P = 0·013). In contrast, weight gain was not affected by the temperature of the beverage (Fig. 2(a)). Lean body mass gain of the cold temperature groups (CSu and CAk) was found to be slightly, but not significantly, higher than that of the normal temperature groups (P = 0·056) (Fig. 2(b)). Body fat mass gain of the non-energetic sweetened groups was found to be significantly higher than that of the energetic sweetened groups (P < 0·001), and a significant interaction (P = 0·041) between the type of sweetener and temperature was detected (Fig. 2(c)).
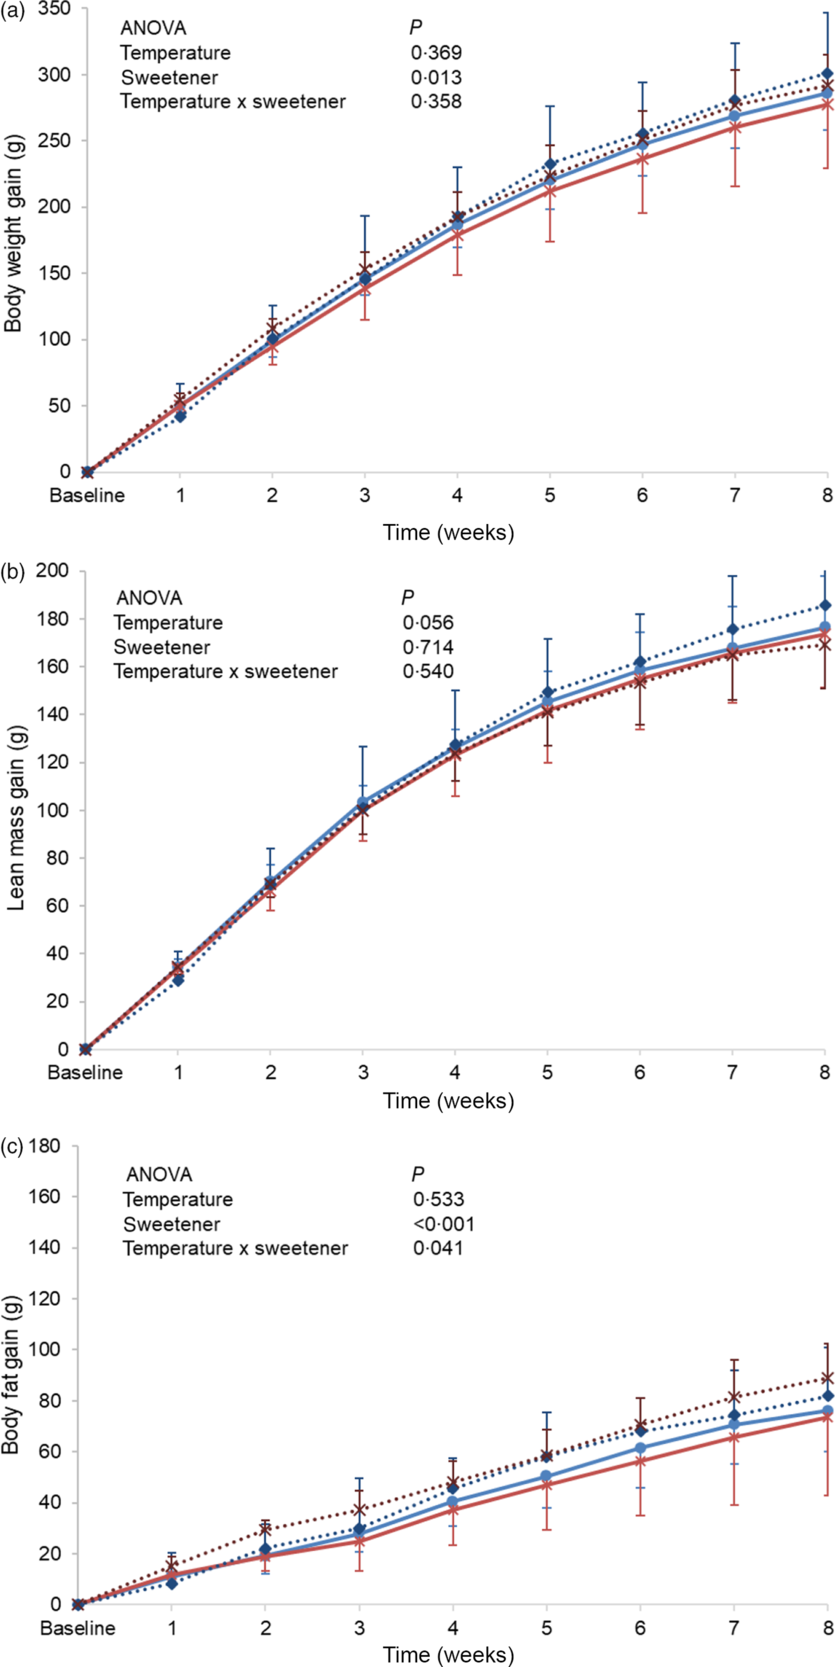
Fig. 2. Expt 2 – Effect of cold and room-temperature drinking sweetened (energetic and non-energetic) water on body weight measures. Weekly body weight (a), lean body mass (b) and body fat (c) gain from baseline in grams of the four groups of rats over the 8-week experimental period. Group CSu: cold water (about 4°C) sweetened with 10 % sucrose; Group NSu: room-temperature water (about 22°C) sweetened with 10 % sucrose; Group CAk: cold water (about 4°C) sweetened with 0·05 % acesulfame K; Group NAk: room-temperature water (about 22°C) sweetened with 0·05 % acesulfame K. Data are expressed as mean values and standard deviations of all values. A multiple-way ANOVA was performed with time, set as random, temperature of beverages and type of sweeteners as factors. Significance was set at P < 0·05. ![]() , CSu;
, CSu; ![]() , NSu;
, NSu; ![]() , CAk;
, CAk; ![]() , NAk.
, NAk.
The total energy intake level was similar between the four groups (Table 3). The energetic sweetened groups (CSu and NSu) had a lower energy intake from the diet since part of the energy was derived from the sucrose content of the beverage. In the energetic sweetened groups, sweetened water contributed to about 10 % and 25 % of the energy intake of the cold (CSu) and room-temperature (NSu) water, respectively (Table 3). The volume of ingested room-temperature sweetened water was higher than that ingested by the cold temperature groups. Nevertheless, the ingestion of plain water was significantly lower among the room-temperature groups (NSu and NAk) as compared with the cold temperature groups (CSu and CAk) (Table 3).
Table 3. Expt 2 – Effect of cold and room-temperature drinking sweetened (energetic and non-energetic) water on energy intake, expenditure and efficiency and some organ weights (Wt)
(Mean values and standard deviations)*
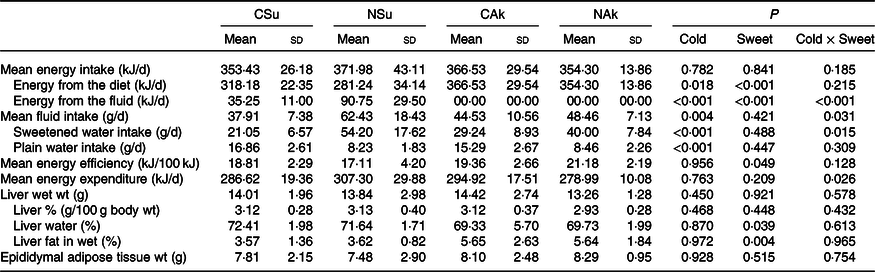
Group CSu, cold water (about 4°C) sweetened with 10 % sucrose; Group NSu, room-temperature water (about 22°C) sweetened with 10 % sucrose; Group CAk, cold water (about 4°C) sweetened with 0·05 % acesulfame K; Group NAk, room-temperature water (about 22°C) sweetened with 0·05 % acesulfame K.
* A two-way ANOVA was performed with time and temperature of the beverages as factors. Significance was set at P < 0·05.
In contrast, the energy intake of sweetened drinking water was the highest among the normal temperature groups (NSu and NAk) irrespective of their energetic content. Moreover, the ingestion of cold sweetened water seems to decrease the energy expenditure of the energetic sweetened water group and increase the energy expenditure of the non-energetic sweetened water one (P = 0·026 for cold and sweetness interaction). However, the energy efficiency of the non-energetic sweetener groups was significantly higher than that of the energetic sweetened groups (P = 0·049), and this was not affected by the temperature of the ingested sweetened water (Table 3).
At the organ level, no significant differences were found between the groups in terms of total liver weight (g), percentage liver weight of body weight (g/100 g body weight) and epididymal adipose tissue weight. Nonetheless, liver fat (%) of the non-energetic sweetened groups was more than 50 % higher than that of the energetic sweetened groups (P = 0·004), and this was associated with lower liver water (%) (P = 0·039) (Table 3). All fasting plasma parameters were found not to be affected neither by energetic content nor by the temperature of the water except for that of plasma urea nitrogen, which was found to be higher in the non-energetic sweetened groups (Table 4).
Table 4. Expt 2 – Effect of cold and room-temperature drinking sweetened (energetic and non-energetic) water on plasma metabolites
(Mean values and standard deviations)
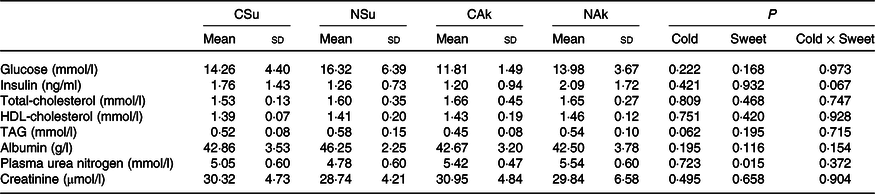
Group CSu, cold water (about 4°C) sweetened with 10 % sucrose; Group NSu, room-temperature water (about 22°C) sweetened with 10 % sucrose; Group CAk, cold water (about 4°C) sweetened with 0·05 % acesulfame K; Group NAk, room-temperature water (about 22°C) sweetened with 0·05 % acesulfame K.
* A two-way ANOVA was performed with time and temperature of the beverages as factors. Significance was set at P < 0·05.
Discussion
Thermoregulation studies have focused mainly on the effect of external cold exposure on body composition, energy balance and others, while little is known about the influence of internal cold exposure. The present study was designed to address the impact of internal cold exposure that was induced by the ingestion of cold beverages, including plain water, energetic and non-energetic sweetened water. The study adopted several pragmatic approaches to mimic real-life scenarios. First, the studied temperature was similar to the commonly used refrigerated beverages. Second, the concentration of sweeteners (energetic and non-energetic) was comparable to that used in commercially available beverages. Third, the sweetened water was offered for 12 h/d, for it not to be the only source of fluid, and to avoid the continuous ingestion of sweeteners and any potential problem in osmolarity.
Our results show that the ingestion of cold water was able to alter body composition by increasing lean body mass gain and reducing fat mass accumulation. However, changes in body composition were not evident in the cold sweetened (energetic or non-energetic) groups. The alterations in body composition were not associated with any significant changes in energy intake, unlike what was reported following external cold exposure(Reference Kuroshima, Doi and Yahata4,Reference Puerta and Abelenda6) . Though, in other animals, chicks and cows, drinking of chilled water was shown to increase feed consumption(Reference Park, Park and Hwangbo14,Reference Milam, Coppock and West16) . Adaptation to external cold exposure was reported to increase both food intake and expenditure to sustain body thermoneutrality(Reference Kuroshima, Doi and Yahata4,Reference Rothwell and Stock5,Reference Ingram and Legge31) . These adaptive measures are, in part, mediated through cutaneous cold thermoreceptors (TRPM18), mainly since their deletion induced weight gain that was associated with a reduction in fat oxidation(Reference Reimúndez, Fernández-Peña and García32). This points towards a minor role for digestive tract thermoreceptors in the control of feeding, although they were reported to affect gut motility(Reference El Ouazzani33,Reference Gupta, Nier and Hensel34) . Moreover, it is reasonable to postulate that the observed increase in lean body mass following internal cold exposure might have been an adaptive process to sustain body thermoneutrality, primarily since lean mass induces heat production(Reference Ooijen, Westerterp and Wouters35,Reference Vézina, Jalvingh and Dekinga36) . In brief, these findings imply that the adaptive mechanisms for internal cold exposure are not identical to that of external cold exposure(Reference van Marken Lichtenbelt, Schrauwen and van de Kerckhove1,Reference Puerta and Abelenda6) .
In the first experiment, the changes in body composition were highly attributed to increased energy expenditure (about 10 %) that seems to equate to about 8 h of external cold exposure at 4°C(Reference Ravussin, Xiao and Gavrilova7). Inline, energy expenditure was reported to increase under conditions of short-term ingestion of cold water and/or exposure to cooler external temperature(Reference van Marken Lichtenbelt, Schrauwen and van de Kerckhove1,Reference Dauncey2,Reference Dubnov-Raz, Constantini and Yariv11,Reference Brown, Dulloo and Montani12,Reference Geraert, MacLeod and Leclercq37) . In humans, the ingestion of cold water at 22°C was reported to increase postprandial thermogenesis by about 30 %, in which the cost of water warming to 37°C contributed to about 40 % of the increase(Reference Boschmann, Steiniger and Hille38). In the present study, the cost of warming is expected to be higher as the water was offered at 4°C. The ability of systemic β-adrenoreceptor blockade to reduce thermogenesis implicates the sympathetic nervous system in water thermogenesis(Reference Boschmann, Steiniger and Hille38),which is believed to be mediated by osmoreceptors since the ingestion of saline solution failed to substantially affect thermogenesis(Reference Brown, Dulloo and Montani12,Reference Boschmann, Steiniger and Franke39,Reference Lipp, Tank and Franke40) . Furthermore, the cost of the observed increase in energy expenditure with cold water ingestion seems to be mainly derived from fat oxidation, as indicated by the reduction in body fat and plasma TAG. In agreement, external cold exposure was reported to increase lipoprotein lipase of white adipose tissue and heart, as well as fatty acid oxidation activities in heart and white and brown adipose tissues(Reference Herpin, Bertin and Le Dividich41–Reference Ellis, Li and Wu43). Moreover, the cost of the thermogenic effect of water ingestion in male subjects was mainly derived from lipid oxidation(Reference Boschmann, Steiniger and Hille38).
On the other hand, in the energetic/non-energetic sweetener study, the impact of the ingestion of cold temperature water on lean body mass was of low magnitude. Surprisingly, despite the similarities between the groups in terms of total energy intake, the ingestion of non-energetic sweetened water was associated with higher body weight and body fat mass and this was paralleled by higher hepatic fat content. Increased fat deposition in the non-energetic sweetened groups seems to be related to an increase in energy efficiency. Non-energetic sweeteners were proposed to disrupt the energetic signal associated with sweetness, and thus its failure to provide energy content may consequently enhance energy deposition through triggering the starvation mode, which is known to reduce energy expenditure and increase in energy efficiency(Reference Swithers44). Indeed, it was widely suggested that eating sweet non-energetic substances brings the sweet taste without the energy content, and animals use sweet taste to predict the energetic contents of food which will create a positive energy balance through increased food intake and/or diminished energy expenditure(Reference Swithers44). Our findings come in opposition to popular beliefs about non-energetic sweeteners. Artificial sweeteners have been widely used as a substitution to sugar, providing the sweet taste without any energy load; this results in short-term weight and fat reduction(Reference de Ruyter, Olthof and Seidell21,Reference De la Hunty, Gibson and Ashwell22,Reference Maersk, Belza and Stødkilde-Jørgensen45) . However, long-term studies have associated them with weight gain(Reference Fowler, Williams and Resendez24,Reference de Matos Feijó, Ballard and Foletto26,Reference Swithers44,Reference Bissonnette, List and Knoblich46) . Indeed, in rats, the consumption of foods or fluids containing a non-nutritive sweetener, saccharin, as compared with glucose, has led to an increase in food intake, body weight and body fat accumulation(Reference Swithers, Martin and Davidson47). Additionally, the weight gain of rats maintained on non-energetic sweetened (acesulfame K or saccharin) yogurt was higher than that kept on glucose sweetened yogurt(Reference Swithers, Baker and Davidson48). Inline, we found higher body fat content among the non-energetic (acesulfame K) sweetened groups.
It is worth noting that the volume of ingested cold sweetened (energetic and non-energetic) water was smaller than that of the normal temperature water. Despite the high contribution of sucrose-sweetened water (about 10 % cold group and 24 % room-temperature group) to energy intake, no significant differences were observed in total daily energy intake, as well as in plasma insulin, glucose and lipid profile. These similarities may imply that the observed differences in body composition were not related to changes in insulin sensitivity. The capacity of sucrose ingestion to increase postprandial energy expenditure(Reference Brown, Dulloo and Montani12) may have partially explained the observed difference in energy expenditure between the sucrose sweetened groups, and a strong association was found between the amount of sucrose consumed from fluid and energy expenditure (r 0·761, P = 0·001). On the other hand, increased plasma urea nitrogen of the non-energetic sweeteners groups may be related to their higher dietary intake of protein as compared with that of sucrose sweetened groups.
Conclusion
In conclusion, internal variation in body temperature by the manipulation of the temperature of drinking water was found to affect body composition. Ingestion of cold water had a favourable effect on lean body mass accompanied by a decrease in fat mass gain. These changes in body composition were associated with an increase in energy expenditure, while both energy intake and efficiency were not affected. On the other hand, non-energetic sweetened (0·05 % acesulfame K) water was able to increase body fat gain and energy efficiency as compared with the energetically sweetened (10 % sucrose) water, while energy intake and expenditure were not affected. Our findings show that the impact of internal cold exposure is different from that of external cold exposure, especially in relation to energy intake. Further studies are required to explore the mechanisms for the adaptation to the ingestion of cold water.
Acknowledgements
This work was supported by the American University of Beirut. Collaborative Research Stimulus. Award number 103559. Project number 24470.
O. A. O. conceived and designed the experiment; M. E. R., N. E. H. and C. E. M. carried out the experiments and conducted the laboratory analysis; M. E. R., N. E. H., C. E. M., A. E. and O. A. O. analysed the data; all authors were involved in writing the paper and had final approval of the submitted and published versions.
The authors declare that there are no conflicts of interest.
Supplementary material
For supplementary material referred to in this article, please visit https://doi.org/10.1017/S0007114520003359


