The use of dietary patterns to explore the effects of diet on a variety of health outcomes is now well established as a method that complements examining individual foods and nutrients. Dietary patterns allow the assessment of the whole diet, accounting for the fact that foods/nutrients are consumed in combination and are therefore highly correlated. Principal components analysis (PCA), a form of factor analysis, is a popular method for deriving dietary patterns. It makes use of the correlations between food intakes to identify underlying patterns in the data. There are several subjective decisions that must be made when using PCA. A particularly important one, which is often overlooked, is how to quantify the input variables. Depending on the source of dietary data, a number of different variables could be considered. For example, data from diet diaries can be quantified continuously as gram weights or percentage energy from food groups or dichotomously (i.e. whether each food group was consumed or not).
The input variables used in PCA vary across studies(Reference Newby and Tucker1) and include frequency of consumption, gram weights, energy-adjusted weight, daily percentage energy contribution and binary variables. Many studies based on diet diaries use weight of foods consumed as the input variable(Reference Cucó, Fernández-Ballart and Sala2–Reference Yannakoulia, Yiannakouris and Melistas5). Energy adjustment using the residual method(Reference Willett, Howe and Kushi6) is often applied in studies based on diet diaries and diet recalls(Reference Kesse-Guyot, Vergnaud and Fezeu7–Reference Okubo, Murakami and Sasaki9), as well as studies based on FFQ data(Reference Bamia, Orfanos and Ferrari10–Reference Velie, Schairer and Flood12). Percentage energy is another potential input variable(Reference Newby, Muller and Hallfrisch13) and a few studies(Reference Balder, Virtanen and Brants14, Reference Guinot, Latreille and Malvy15) have dichotomised intakes into binary variables. Most studies select one strategy for dietary patterns analyses, but seldom justify the decision, and only a few studies have made comparisons between the different input variables but with no formal conclusions(Reference Balder, Virtanen and Brants14, Reference Northstone, Ness and Emmett16, Reference Hearty and Gibney17). There are no studies to our knowledge that have compared all four strategies and no studies have made comparisons in children.
In order to facilitate comparisons across studies, it is vital that researchers are as informed as possible about the decisions that they need to make and use the best evidence available. Therefore, the aim of the present study is to derive dietary patterns using PCA and using four different input variables – weight (g/d), energy-adjusted weight, percentage energy contribution and binary variables (consumed or not consumed) – and compare the interpretability of the patterns among children participating in the Avon Longitudinal Study of Parents and Children (ALSPAC).
Methods
Participants
The ALSPAC is an ongoing longitudinal cohort study designed to investigate determinants of development, health and disease during and after childhood. Eligible participants were pregnant women resident in the former Avon Health Authority, in South West England, due to deliver between 1 April 1991 and 31 December 1992. Further details are given elsewhere(Reference Golding, Pembrey and Jones18) and can be found on the website http://www.bris.ac.uk/alspac. The study includes children from the core ALSPAC sample, consisting of 14 541 pregnancies, and an additional 542 eligible pregnancies not in the core sample, invited to participate at a later date. The present study was conducted according to the guidelines laid down in the Declaration of Helsinki, and all procedures involving human subjects/patients were approved by the ALSPAC Law and Ethics Committee and the Local Research Ethics Committees. Written informed consent was obtained from all subjects/patients.
Dietary assessment
The study children were invited to attend a clinic when they were 10 years old, and a diet diary was sent with their confirmation to be completed prior to their visit. Children and their care-givers recorded, in household measures, all food and drink consumed by the child over two (not necessarily consecutive) weekdays and one weekend day. During clinic attendance, the children were interviewed to ensure the quality of the diary (e.g. clarifying portion size or omitted details on the types of food and drinks consumed). If the child did not bring a diary to the clinic, the fieldworker conducted a 24-h recall to record all food and drink consumed by the child in the previous day. Further details are given elsewhere(Reference Cribb, Jones and Rogers19). The completed diaries were entered into the Diet In Data Out computer program(Reference Price, Paul and Key20), which generated the weight and energy contribution of every food consumed by each child. For the purposes of the present study, the average daily intake of food weight and energy were used.
Each food consumed was initially allocated to one of ninety-five food groups that were based on those used in FFQ that had previously been administered to the ALSPAC cohort(Reference Northstone and Emmett21). Sugar-free confectionery, alcohol, herbs and spices were removed from the analysis, as very few children consumed these foods and, thus, they did not contribute meaningfully to any dietary patterns. The remaining food items were combined into sixty-two groups, based on similarities between foods (e.g. nuts, peanuts and peanut butter were combined), to reduce the number of input variables and prevent infrequently consumed foods from diluting the dietary patterns. The appendix describes the food groups in detail.
Statistical methods
Dietary patterns were derived using PCA. Principal components are linear combinations of the input variables and explain as much of the variation in the data as possible. Each component describes a dietary pattern and the linear combination allows the calculation of a component score for each child; the higher the score, the more likely this pattern is present in an individual's diet. The patterns described by each component may be interpreted by its factor loadings, which are the correlations between the component and each input variable. Large positive or negative factor loadings indicate the foods that are important in that component; loadings with magnitude of at least 0·2 were considered when describing dietary patterns. Scree plots(Reference Cattell22) and the interpretability of each component were also used to determine the appropriate number of components to select. Varimax rotation(Reference Kline23) was employed to aid the interpretation of components. The purpose of the present study was to compare the different dietary patterns obtained using each of the input variables; therefore, the patterns were given alphanumeric labels rather than descriptive names to aid reporting.
Four separate analyses were carried out using four different input variables. The first used the weight (g/d) of each food consumed. The variables were standardised prior to entry into the PCA to prevent components being dominated by the foods that are consumed in the highest quantities, such as water. The second analysis adjusted the mean weight for total energy intake, using the residuals method(Reference Willett, Howe and Kushi6). Specifically, the PCA input variables were the standardised residuals from a linear regression of mean weight on mean daily energy intake. Regression was only performed on non-zero values, and both weight and energy were log-transformed before regression and transformed back before standardisation. The third analysis used the percentage contribution of each food to the daily energy intake as input variables. These percentage energy input variables were also standardised prior to entry into the PCA to prevent the components being dominated by the foods that provide the highest percentage energy. In the fourth analysis, the input variables were dichotomised into binary variables (consumed or not consumed), as food intake variables were highly skewed and many children did not consume some of the food groups. The PCA was performed directly on their covariance matrix for this fourth method (as opposed to the correlation matrix for the previous three methods), as standardisation is not appropriate for binary variables. For each of the four PCA, scores were calculated for each subject, for each pattern derived by summing the products of each standardised input variable and their corresponding coefficient in the component (or dichotomised in the case of binary variables).
Agreement between the derived patterns was assessed in two ways. Agreement between component scores was assessed by calculating Pearson's sample correlation coefficients. Congruence coefficients(Reference Harman24) were also calculated for pairs of matrices of component coefficients in order to assess the difference between the coefficients assigned to individual foods by each component.
Results
Of the 11 868 children eligible to attend the clinic, a total of 7557 (63·7 %) attended and 7473 of these (98·9 %) provided dietary information. Of these, 5769 (77·2 %) provided 3 d of dietary records. Girls, white children, children with older, more educated, non-smoking mothers and children from homes that were owned or mortgaged were more likely to provide data (all P< 0·001; data not shown).
When gram weights were used as input variables, three principal components were retained and explained 10·4 % of the variation in the sample. Factor loadings are shown in Table 1. The first component (W1) had high positive loadings on non-white bread, fruit and vegetables, cooked pasta, tuna and oily fish, cheese, yoghurt, high energy density sauce (e.g. mayonnaise), fruit juice and water. There were high negative loadings on processed meat, coated poultry, tinned pasta/baked beans, chips (French fries), crisps (potato chips) and carbonated sweet drinks (non-diet soda). The second component (W2) had high positive loadings on meat, roast potatoes, batter/pastry products, vegetables, puddings and low energy density sauce (e.g. gravy, ketchup) and a high negative loading on chips. The third component (W3) had high positive loadings on white bread, margarine, cheese, cold meats, salty flavourings, crisps, biscuits (cookies) and diet squash/cordial.
Table 1 Factor loadings from principal components analysis of diet diary data on 7473 children aged 10 years, where input variables are weights (g/d)
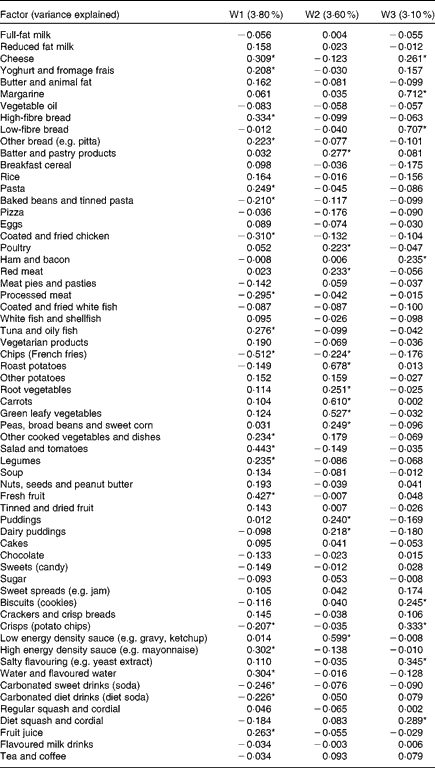
W1, W2, W3, components derived from weights (g/d).
* Factor loadings with magnitude greater than 0·2.
As can be seen in Table 2, energy adjustment did not have a discernible effect on the dietary patterns when compared with those using unadjusted weights: the factor loadings were almost identical, differing by no more than 0·084.
Table 2 Factor loadings from principal components analysis of diet diary data on 7473 children aged 10 years, where input variables are weights (g/d) adjusted for total energy intake using the residual method

A1, A2, A3, components derived from weights (g/d) adjusted for total energy intake using the residual method.
* Factor loadings with magnitude greater than 0·2.
Four components were obtained when percentage energy contribution was used as the input variable, explaining 12·3 % of the variation in the sample. Factor loadings are shown in Table 3. The first three components, labelled P1, P2 and P3, had high loadings on the same foods that loaded highly on components W1, W2 and W3, with the exception that water loaded highly on W1 but not P1; vegetarian products, legumes and nuts loaded highly on P1 but not W1; and diet squash/cordial loaded highly on W3 but not P3. The fourth component (P4) had high positive loadings on reduced fat milk, yoghurt, breakfast cereal and biscuits and high negative loadings on rice, other breads (e.g. pitta), poultry, eggs, butter, salad, legumes and carbonated sweet drinks.
Table 3 Factor loadings from principal components analysis of diet diary data on 7473 children aged 10 years, where input variables are percentage contribution of each food to total energy intake

P1, P2, P3, P4, components derived from percentage contribution of each food to total energy intake.
* Factor loadings with magnitude greater than 0·2.
When PCA was performed on binary variables, four components were obtained, explaining 17·3 % of the variation in the sample. Table 4 shows factor loadings for these four components. The first component (B1) had high loadings on meat, roast potatoes, batter/pastry products, vegetables and low energy density sauces. The second component (B2) had high positive loadings on non-white bread, fruit, nuts, salad, vegetarian foods and vegetable dishes, potatoes, pasta, tuna and oily fish, cheese, yoghurt, eggs, butter, high energy density sauce, sweet spreads (e.g. jam), dairy puddings, cakes, chocolate, fruit juice, regular squash/cordial and water. There were high negative loadings on diet squash/cordial, and roast potatoes. The third component (B3) had high loadings on processed meat, coated poultry, tinned pasta/baked beans, white bread, margarine, vegetable oil, chips, crisps, chocolate, sweets (candy), sweet spreads (jams), sugar, cakes, dairy puddings, biscuits, carbonated sweet drinks and diet squash/cordial. The fourth component (B4) had high positive loadings on reduced fat milk, margarine, diet carbonated drinks and diet squash/cordial. It also had high negative loadings on their alternatives, i.e. full-fat milk, butter, carbonated sweet drinks and regular squash/cordial. It also had a high positive loading on breakfast cereals.
Table 4 Factor loadings from principal components analysis of diet diary data on 7473 children aged 10 years, where intakes are expressed as binary (consumed/not consumed) variables
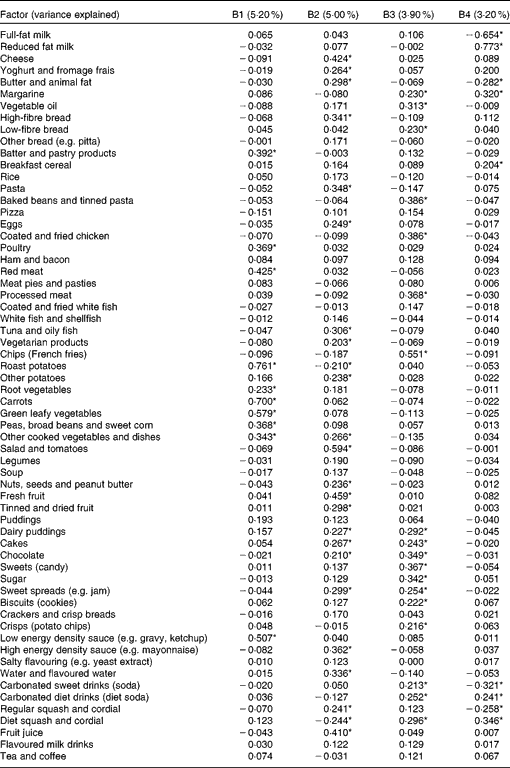
B1, B2, B3, B4, components derived from binary variables.
* Factor loadings with magnitude greater than 0·2.
Table 5 shows the correlations between the component scores, and Table 6 shows congruence coefficients between components. The components generated from gram weights and energy-adjusted weight input variables are very similar, as assessed by correlations between component scores and the congruence coefficient between these components. The first three components from the analysis with percentage energy input variables were also similar to those generated from gram weights: the correlations among P1, P2, P3 and W1, W2, W3 were at least 0·907. The components generated by binary input variables share partial similarities with the other components. In terms of component scores, B1 was positively correlated with W2, B2 with W1 and B3 was negatively correlated with W1.
Table 5 Correlations between component scores obtained from different input variables*
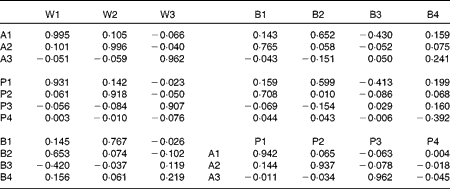
* W, components derived from weights (g/d); A, components derived from weights (g/d) adjusted for total energy intake using the residual method; P, components derived from percentage contribution of each food to total energy intake; B, components derived from binary variables.
Table 6 Congruence coefficients between components obtained from different input variables*
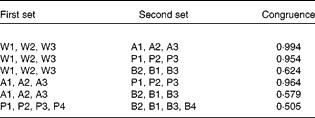
* W, components derived from weights (g/d); B, components derived from binary variables; A, components derived from weights (g/d) adjusted for total energy intake using the residual method; P, components derived from percentage contribution of each food to total energy intake.
Discussion
The present study of dietary diary data from 10-year-old children compared dietary patterns derived from PCA using four strategies for quantifying input variables. When continuous variables were used (gram weights, energy-adjusted weight and percentage energy contribution), the first three components extracted had similar loadings and described similar dietary patterns: one contrasting ‘more healthy’ foods with ‘less healthy’ foods, one with high loadings on meat, potatoes and vegetables and one with high loadings on lunch and snack foods. The fourth component, present only when intake was measured as percentage energy, was difficult to interpret. When binary variables were used, the four components extracted described slightly different dietary patterns: the component with high loadings on meat, potatoes and vegetables was still present, but the component with positive loadings on ‘more healthy’ foods and negative loadings on ‘less healthy’ foods was replaced by two components: one with high loadings on the ‘more healthy’ foods and the other with high loadings on the ‘less healthy’ foods. The fourth component had positive loadings for reduced-fat and reduced-sugar foods and negative loadings on their alternatives.
There are strong similarities between patterns in the presence and absence of energy adjustment, the main differences being in the relative loadings of high- and low-fibre bread, and full- and low-fat milk. In a comparison of energy-adjusted and unadjusted analyses of data from FFQ administered to the ALSPAC mothers(Reference Northstone, Ness and Emmett16), five components appear in the unadjusted analysis, but four components suffice under energy adjustment; the missing component described a ‘processed’ dietary pattern. A study(Reference Hearty and Gibney17) comparing gram weights and percentage energy as input variables, in PCA of FFQ data from Irish adults, concludes that gram weights give more interpretable patterns than percentage energy.
In the present study, the patterns obtained when gram weights were used as the input variables were the most interpretable. Weight is a clear, quantitative way to measure food consumption and can be easily linked to portion sizes. A drawback of using gram weights (unadjusted and adjusted for energy) and percentage energy was that they potentially led to skewed input variables, with many zeroes for foods that were not frequently consumed. This resulted in component scores with skewed distributions. Adjusting the weight for energy intake did not alter the dietary patterns, agreeing with research in adults(Reference Balder, Virtanen and Brants14). These results suggest that energy-adjusting the input variables does not offer any specific benefit when determining dietary patterns, using PCA, from diet diaries administered to children. It may be more appropriate to perform energy adjustment later in the analytic process, as this allows for more accurate assessment of the effect of energy itself. A similar conclusion was reached when obtaining dietary patterns using PCA in the ALSPAC mothers, although this was based on the FFQ data(Reference Northstone, Ness and Emmett16).
In agreement with other research (in adults)(Reference Hearty and Gibney17), using percentage energy as an input variable led to patterns that were harder to interpret than those derived from gram weights. In the present study, the percentage energy strategy led to components in which water did not load highly, as it does not contribute to energy intake. This could be considered an inherent limitation of this approach, given non-energy-containing foods (e.g. water, coffee, tea and diet soda) often contribute meaningfully to dietary patterns. This is shown in the present study, in which water loaded highly on the components obtained when gram weights were used as the input variable strategy, whether energy-adjusted or unadjusted. These results indicate that variation in water intake is an important part of childhood diet and is missed when using the percentage energy method. Percentage energy is an attractive concept, as it considers one's overall dietary composition. However, it is harder to comprehend when dealing with individual food groups, which provide relatively small contributions to total energy intake when considered on their own (i.e. in contrast to considering, say, the macronutrient composition of the diet).
Few studies have used binary input variables to derived dietary patterns using PCA. Using this method, they overcame the issues of skewness and the sometimes large numbers of non-consumers of food groups, and led to interpretable dietary patterns. A study of data from an FFQ administered to adults in four European cohorts(Reference Balder, Virtanen and Brants14) showed no effect of dichotomisation of input variables on dietary patterns. However, in the present study, the patterns were different from those obtained from continuous variables; binary (consumed/not consumed) variables are easy to understand and conceptually represent choices and/or preferences of food rather than quantities consumed. This was evident in component B4, which seemed to differentiate among individuals who chose reduced fat, reduced sugar foods and those who chose the regular (full fat, full sugar) options for those foods. Food choices are potentially easier to modify, but it must be recognised that people consume food in different quantities, and dichotomising food intakes does not capture the complexity of eating behaviour.
The findings of the present study are strengthened by the large sample size. However, the sample is biased towards higher socio-economic status. As well, the present study has not assessed the effect of different input variables on a specific diet–disease association. As the patterns obtained with different strategies were similar, the effect of input variables on a given diet–disease association may be similar, although this is an important next step to further this literature and needs to be examined. Another input variable that could be considered is the number of servings per day, which is commonly used in studies that assess diet using an FFQ. However, as the present study made use of diet diaries, considered a ‘gold standard’ method of self-reported dietary assessment, we elected not to consider this semi-quantitative approach commonly used in FFQ, given the level of detail we have in the diet diaries.
In conclusion, the present study is the first to comprehensively compare different input variables used in dietary pattern analysis obtained using PCA. The present results indicate that there appears to be no benefit associated with energy adjustment, given results were similar to those when unadjusted. We also showed that patterns based on percentage energy did not capture meaningful dietary intakes, completely missing some items consumed such as water, and were also harder to interpret. Thus, while the final choice of input variable treatment may depend on the purpose of a particular analysis, the use of food weights and binary variables appeared to be the best approaches to quantify input variables in the present study among children. More research is needed to see whether input variable treatment has an impact on diet–disease associations, as understanding the role of diet on health outcomes is the ultimate objective of nutritional epidemiological studies. However, for the purposes of describing the underlying patterns of diet in a population, we would recommend using weights of foods; binary input variables would be a complementary approach to this in which specific dietary choices can be identified.
Acknowledgements
We are extremely grateful to all the families who took part in the present study, the midwives for their help in recruiting them and the whole ALSPAC team, which includes interviewers, computer and laboratory technicians, clerical workers, research scientists, volunteers, managers, receptionists and nurses. The UK Medical Research Council, the Wellcome Trust and the University of Bristol provide core support for ALSPAC. The present work was supported by the World Cancer Research Fund grant number 2009/23. K. N. and P. M. E. designed the study; A. D. A. C. S. performed the statistical analysis; K. N. had primary responsibility for final content. All authors contributed to writing the manuscript and approved the final version. The authors declare no conflict of interest.
Appendix Food groups and their components