


Gout is a painful medical condition characterised by urate crystal deposition in various joints and affecting 6–8 % of the elderly (80+ years) and approximately3·9 % of the entire US population( Reference George and Keenan 1 ). Hyperuricaemia or elevated serum uric acid (SUA) is the principal causative agent behind gout and independently predicts myocardial infarction and premature death( Reference Fang and Alderman 2 ). Furthermore, uric acid (UA) is the final catabolic product of purine oxidation( Reference Choi, Mount and Reginato 3 ). Two key physiological mechanisms determine hyperuricaemia, namely increased liver production of urate from dietary and/or endogenous substrates that raise purine levels and reduced renal and/or gut excretion of UA( Reference Merriman 4 ).
In recent genome-wide association studies, various genetic loci influencing SUA were identified. Those with strongest influence include ABCG2, NPT4 (SLC17A3), NPT1 (SLC17A1), URAT1 (SLC22A12), OAT4 (SLC22A11) and GLUT9 (SLC2A9)( Reference George and Keenan 1 ). Notably, genetic variations on these loci differ markedly between race and ethnic groups. Given that certain risk alleles in combination can affect either SUA at one point in time or the rate of change in SUA, as was shown recently in a study among AA( Reference Beydoun, Canas and Fanelli-Kuczmarski 5 ), race can be a strong cross-sectional and/or longitudinal predictor of SUA.
In addition to the strong genetic influence on SUA, dietary factors may act either independently or interactively with the individual’s genetic risk for hyperuricaemia. Overall dietary patterns such as the Mediterranean Diet Score( Reference Kontogianni, Chrysohoou and Panagiotakos 6 , Reference Chrysohoou, Skoumas and Pitsavos 7 ) or specific dietary components have been shown to have equally important effects( Reference George and Keenan 1 ). In fact, recent research( Reference Choi, Mount and Reginato 3 , Reference Choi, Atkinson and Karlson 8 – Reference Gao, Qi and Qiao 13 ) suggests that the consumption of red meat and seafood is positively linked with gout and/or hyperuricaemia( Reference Choi, Mount and Reginato 3 , Reference Torralba, De Jesus and Rachabattula 10 ), with similar adverse effects observed in the case of alcohol intake (e.g. beer and liquor)( Reference Choi, Mount and Reginato 3 , Reference Choi, Atkinson and Karlson 8 , Reference Torralba, De Jesus and Rachabattula 10 , Reference Poletto, Harima and Ferreira 11 , Reference Gaffo, Roseman and Jacobs 14 , Reference Towiwat and Li 15 ) and fructose-containing foods including soft drinks( Reference Choi, Mount and Reginato 3 , Reference Torralba, De Jesus and Rachabattula 10 , Reference Choi, Ford and Gao 12 , Reference Gao, Qi and Qiao 13 ), as well as intake of legumes in animal studies( Reference Rotimi, Olayiwola and Ademuyiwa 16 ). Conversely, other dietary factors were linked to lower SUA such as dairy products, particularly low-fat milk and yogurt( Reference Choi, Mount and Reginato 3 , Reference Torralba, De Jesus and Rachabattula 10 , Reference Poletto, Harima and Ferreira 11 , Reference Towiwat and Li 15 ), caffeine( Reference Choi, Mount and Reginato 3 , Reference Torralba, De Jesus and Rachabattula 10 , Reference Towiwat and Li 15 ) and vitamin C( Reference Choi, Mount and Reginato 3 , Reference Torralba, De Jesus and Rachabattula 10 , Reference Towiwat and Li 15 ) intakes. While most of these studies were conducted in one racial/ethnic group, there is paucity of evidence of an interaction between race and diet in affecting SUA over time.
Using dietary and SUA data available among urban adults participating in the Healthy Aging in Neighborhoods of Diversity across the Life Span (HANDLS)( Reference Evans, Lepkowski and Powe 17 ), this study evaluated the relationship between the eight previously described dietary factors and SUA at baseline and change over time, while examining race and sex–race interactions in those associations. We hypothesise that the relationship between various dietary factors and SUA over time varies appreciably according to race and race–sex groups.
Methods
Database
HANDLS, a prospective cohort study, recruited at baseline a representative sample of African American (AA) and White urban adults aged 30–64 years, residing in Baltimore city. The study design is described in detail previously( Reference Evans, Lepkowski and Powe 17 ). In brief, data were collected at two phases during the baseline visit (2004–2009; visit 1), with phase 1 examining socio-demographic information (age, sex, education, poverty status and so on), physiological and psychological chronic exposure, and including the first 24-h dietary recall. Phase 2 of the baseline visit consisted of in-depth examinations in a mobile research vehicles (MRV) and included a second 24-h dietary recall, psychometric, anthropometric, body composition and laboratory parameter measurements( Reference Evans, Lepkowski and Powe 17 ). Initiated in 2009 and focusing on MRV in-depth examinations through 2013, visit 2 of HANDLS followed a similar protocol. Of all the data collected at the MRV during visit 2, only follow-up SUA was utilised in this study, using the same laboratory testing methods as in visit 1. Time elapsed between visits ranged between <1 and approximately 8 years, with a mean of 4·64 (sd 0·93) years.
Procedures followed the ethical standards of the institution and approval was obtained from The MedStar Institutional Review Board, and written informed consent was obtained from all HANDLS participants.
Study participants
Data were derived from baseline visit 1 (2004–2009) and the first follow-up examination (visit 2; 2009–2013) and were appended in long format to facilitate mixed-effects regression modelling analyses (n, number of persons; n′, number of observations; k=number of observations/person). Follow-up time (range: <1 to approximately 8 years) had a mean of 4·64 (sd 0·93) years, with time=0 for the baseline visit and time=elapsed years to the nearest day for follow-up visit. HANDLS initially recruited n 1 3720 participants (sample 1), with total observations at both visits being n 1′ 6025. Among all HANDLS participants, complete baseline dietary data with two 24-h recalls were available for 2177 participants (sample 2). Of these, thirty-nine had missing data on SUA at both visits and thus were excluded. The final sample (sample 3a) consisted of 2138 participants with complete data on dietary intakes at baseline and SUA data at either visit (n′3a 3661, k=1·7). Sample 3a differed from the unselected participants of sample 1, by having a higher proportion of women (56·5 v. 52·3 %, P=0·010), with no notable differences by poverty status or age (online Supplementary Fig. S1). This potential sample selectivity was adjusted for in the analysis using two-stage Heckman selection approach (see the ‘Statistical methods’).
Serum uric acid
Using 1 ml of fasting blood serum, SUA concentration was measured with a standard spectrophotometry method at both visits of HANDLS (Quest Diagnostics). Reference ranges for adults are 4·8–8·0 mg/dl (285–476 μmol/l) for men and 2·5–7·0 mg/dl (148·8–416·5 μmol/l) for women (where 1 mg/dl of SUA is equivalent to 59·5 μmol/l).
Dietary assessment
All dietary factors considered in this study were measured at the baseline visit. Both baseline 24-h dietary recalls were measured using the US Department of Agriculture Automated Multiple Pass Method, a computerised structured interview( Reference Moshfegh, Rhodes and Baer 18 ). Using measurement aids such as measuring cups, spoons, ruler and an illustrated Food Model Booklet, both recalls were administered in-person by trained interviewers, 4–10 d apart. Trained nutrition professionals utilised Survey Net, matching foods consumed with eight-digit codes from the Food and Nutrient Database for Dietary Studies version 3.0( 19 ).
MyPyramid Equivalents Database (MPED) for food groups (MPED2: http://www.ars.usda.gov/SP2UserFiles/Place/80400530/pdf/mped/mped2_doc.pdf) was used to create food groups. A total of eight dietary factors were selected based on previous evidence of an association with variations in SUA: (1) added sugars (teaspoons/d or approximately 4·2 g/d), (2) alcoholic beverages (drinks/d, with one drink defined as 12 fl oz of beer, 5 fl oz of wine or 1·5 fl oz of eighty-proof distilled spirits; 1 g=approximately 0·03 fl oz), (3) ounce equivalents/d of red meats (1 oz=28·3 g), (4) ounce equivalents/d of fish (sum of fish high and low in n-3 fatty acids), (5) cup equivalents/d of legumes, (6) cup equivalents/d of dairy products (milk, cheese and yogurt), (7) dietary vitamin C from foods in mg/d and (8) caffeine from all sources (g/d); the later three were associated with reduced SUA( Reference Choi, Mount and Reginato 3 , Reference Torralba, De Jesus and Rachabattula 10 ). Each of these dietary factors was estimated as the mean from the two dietary assessments completed at phases 1 and 2 of visit 1, 4–10 d apart. Thus, dietary assessments at visit 2 were not utilised in this present study.
In addition, a dietary urate index was computed based on quintiles of each of the eight components, five of which were then summed up to create the total score (added sugar, alcohol, red meat, legumes and fish), whereas components 6–8 (dairy products, vitamin C and caffeine) were subtracted from the index given their putative inverse relationship with SUA. Thus, the total score could potentially range between −10 (lowest risk of hyperuricaemia due to diet) and 22 (highest risk of hyperuricaemia due to diet) (online Supplementary Method 1).
Supplemental vitamin C
In a secondary analysis, supplemental vitamin C intake was also considered among the main exposure variables, controlling for all other exposures and covariates. A dietary supplement questionnaire adapted from National Health and Nutrition Examination Surveys (NHANES) 2007–2008 was used( 20 ). Each visit 2 participant provided supplement bottles and reported information on over-the-counter vitamin and mineral supplements, antacids, prescription supplements and botanicals. Supplement users were further probed on dose strength, dose amount consumed and length of supplement use (converted to days) among others.
A database consisting of four files was integrated to generate daily intake of each nutrient consumed by a dietary supplement user (see detailed description at the HANDLS study website: https://handls.nih.gov/). Vitamin C supplemental intake was ascertained for the baseline visit (i.e. visit 1) if the daily amount (mg/d) was non-zero at visit 2 and the length of time for intake was greater or equal than the length of time (days) between the two visits, per participant. Thus, participants’ supplemental use was categorised as either 0: non-vitamin C containing supplement user at baseline or follow-up, 1: vitamin-C containing supplement user at baseline and during follow-up or 2: vitamin-C containing supplement user during follow-up only.
Covariates
Covariates considered as potential confounders in the analyses included age, sex, education (<high school (HS) (grades 1–8), HS (grades 9–12), >HS (13+)), poverty status (household incomes below or above 125 % of the 2004 federal poverty guidelines), smoking status (current smoker v. not use of cigarettes), illicit drug use (current v. not use of either marijuana, cocaine or opiates), BMI=(measured weight)/(squared measured height), in kg/m2, and other key food group servings obtained from the MPED2( Reference Bowman, Friday and Moshfegh 21 ), namely total fruits, total vegetables (cup equivalents/d), total grains (ounce equivalents/d), other meats (ounce equivalents/d) and discretionary solid fats and oils (g/d). Race (AA v. Whites) was the main effect modifier in these analyses.
Statistical methods
Using Stata 15.0.( 22 ), weighted means and proportions were estimated and compared across race groups, using design-based F test (svy:tab for categorial variables and svy:reg for continuous variables). Boxplots of baseline and follow-up SUA were also presented and compared by race, using a linear regression model that accounted for sampling weights( Reference Lohr 23 ). Baseline serum uric acid concentration (SUAbase) and annual rate of change in serum uric acid concentration (SUArate) empirical Bayes estimators were obtained from a mixed-effects linear regression model with time as the only predictor. These two parameters are presented among characteristics stratified by race and by sex within each race group. Importantly, several sets of time-interval mixed-effects regression models were conducted with the outcome being SUA measured at either visits 1 or 2, while assuming missingness at random( Reference Ibrahim and Molenberghs 24 ). In fact, only individuals with SUA missing at both visits were excluded from the model (online Supplementary Method 2).
In a first model set, eight dietary components predicted SUAbase and SUArate, overall and stratifying by race. Type I error in analyses examining dietary factors was corrected for multiple testing using Bonferroni correction, assuming an initial type I error rate of 0·05 for main effects and 0·10 for two-way interaction terms and 0·20 for three-way interaction terms, yielding a corrected error rates of 0·05/8=0·006, 0·10/8=0·013 and 0·20/8=0·025, respectively( Reference Selvin 25 , Reference Hochberg and Tamhane 26 ). The same model was carried out with main exposure being the composite measure dietary urate index and thus excluding all individual components but retaining all other food groups and covariates. No correction for multiple testing was done for this model (i.e. type I error was 0·05 for main effects, 0·10 for two-way interaction terms and 0·20 for three-way interaction terms). In a third model, the main exposure of interest was vitamin C-containing supplement use (baseline, follow-up v. none). No correction for multiple testing was done for these latter models.
In a second model set, stratifying the analysis by sex, race–diet interactions were tested, whereby each of eight dietary factors was separately interacted with race to test their interactive effects on SUAbase. Similarly, three-way interactions between each dietary component, time and race were also examined in separate models. Predictive margins were estimated and plotted across time, stratifying by exposure group, from selected mixed-effects regression models. This process was repeated for the dietary urate index and the vitamin C-containing supplement use, as above, without correction for multiple testing.
Moreover, selection bias caused by non-random participant self-selection into the final sample as compared with the target study population can occur. To reduce its impact, a two-stage Heckman selection process was carried out whereby a probit model was used to compute an inverse Mills ratio at the first stage (derived from the predicted probability of being selected, conditional on the covariates in the probit model, mainly baseline age, sex, race, poverty status and education). At the second stage, this inverse Mills ratio was entered as a covariate into the final mixed-effects regression model, as was done in previous studies( Reference Beydoun, Beydoun and Kitner-Triolo 27 , Reference Beydoun, Beydoun and Rostant 28 ). A number of sensitivity analyses were also carried out, including additional covariates (e.g. total energy intake, use of diuretics) and excluding subjects with only one SUA measurement among others.
Results
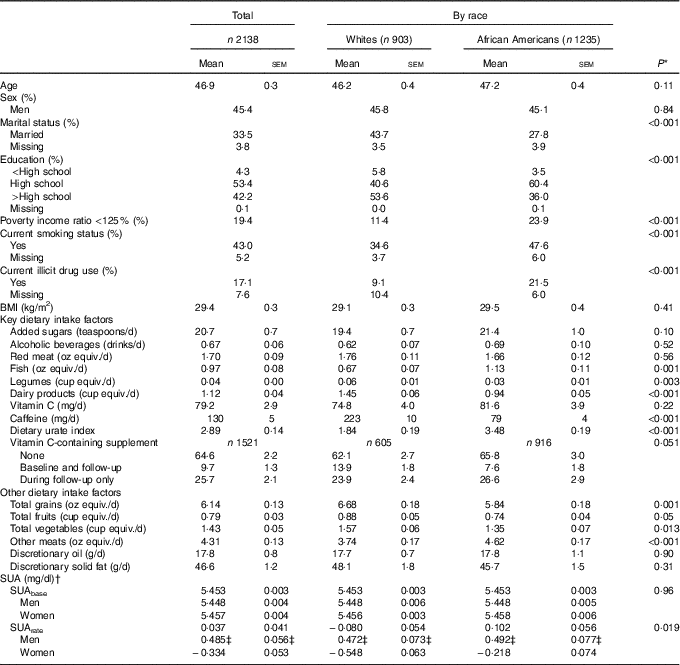
Table 1 describes baseline characteristics of the study sample by race. While 57·9 % of the sample consisted of AA, and 45·4 % were men, mean age overall was estimated at 46·9 years. Poverty status, current smoking and drug use were more prevalent among AA compared with Whites. Whites consumed greater amounts of legumes, dairy products, caffeine, total grains, fruits and vegetables, whereas the reverse was true for fish and other meats. The dietary urate index differed markedly by race (P<0·001), with AA consuming a significantly more hyperuricaemic diet compared with Whites. Only a marginally significant association between vitamin C-containing supplement use and race was detected indicating a more prolonged use among Whites (Table 1). Predicted SUAbase and SUArate from a simple linear mixed-effects regression model with only time as the main parameter, suggested that SUArate (overall mean: 0·037 mg/dl) on average was suggestive of an upward sloping trajectory overall and among AA, particularly AA men. SUAbase (overall mean: 5·45 mg/dl) did not differ by race or sex within each race group. Online Supplementary Fig. S2 presents the race-specific mean SUA at baseline and at follow-up by race. Using a linear regression model accounting for sampling weights, each SUA mean was compared by race. AA had higher SUA at baseline compared with Whites, with no significant difference detected at follow-up (online Supplementary Fig. S2).
Table 1 Baseline study dietary factors and covariates by race among urban adults participating in the Health Aging in Neighborhoods of Diversity Across the Life Span study and with complete data on serum uric acid (SUA) at either of two visits (n 2138), 2004–2013 (Mean values with their standard errors and percentages)
equiv., Equivalents.
* P value for trend was based on design-based F test for trend in exposures by race.
† Empirical Bayes predictions from a mixed-effects linear regression model with time as the only covariate, and random effects added to the intercept and time parameters. 1 mg/dl of SUA is 59·5 μmol/l.
‡ P<0·05 for null hypothesis of no difference by sex, design-based F test.
Several key findings emerged from the mixed-effects regression models (Tables 2 and 3). After correction for multiple testing, overall, a positive overall association of legume intake with SUArate was restricted to AA (γ=0·10 (SEE 0·03), P=0·005), whereas alcohol intake was positively associated with SUAbase in the total population (γ=0·118 (SEE 0·018), P<0·001), without racial differences (Table 2, model A). Other notable findings include a positive association between added sugars and SUAbase in Whites, which was significantly stronger in that group compared with AA (P=0·045 for race×(added sugar) interaction is separate model with main effect of race added). In contrast, total dairy product intake was associated with slower rate of increase in SUA among AA (P=0·043 for race×dairy product×time interaction term) and a lower SUAbase among Whites. Moreover, vitamin C and caffeine both trended towards an inverse association SUAbase without passing correction for multiple testing and no difference by race. In model B of Table 2, dietary urate index was positively associated with SUAbase and SUArate, a finding that was mostly detected among AA. Differences in SUA trajectories across levels of the dietary urate index are illustrated in Fig. 1. Specifically, and as expected, a higher dietary urate index was linked to a higher SUAbase, with each five-unit increase being linked to approximately 2 % higher SUAbase and each unit with a approximately 10 % increase in SUArate. Finally, an inverse association was detected between follow-up use of vitamin C-containing supplements and SUArate among Whites and between baseline use and SUAbase among AA.
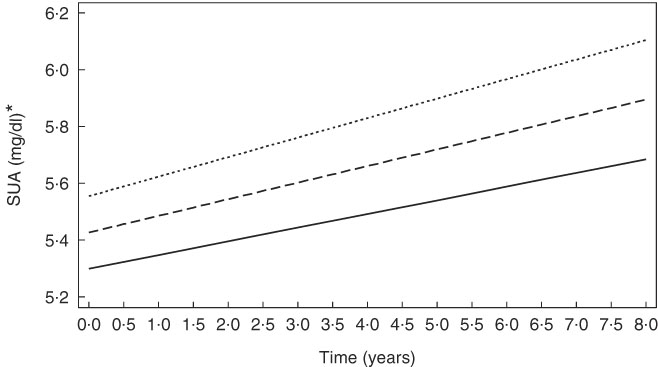
Fig. 1 Predictive margins of serum uric acid (SUA) by time and the dietary urate index, from mixed-effects regression model, among urban adults participating in the Healthy Aging in Neighborhoods of Diversity Across the Life Span with complete data on SUA at either of two visits (n 2138), 2004–2013 (predictive margins obtained from mixed-effects regression model with SUA as the outcome, random effects added to slope and intercept, and both slopes and intercept adjusted for multiple factors including age, sex, race, poverty status, marital status, education, smoking and drug use, several dietary factors, BMI and an inverse Mills ratio. The figure simulates the trajectory of a population with comparable characteristics (covariates set at their observed values in the sample) when exposed alternatively to three values of the dietary urate index (−5, 0, 5)). ![]() , Dietary urate index = −5;
, Dietary urate index = −5; ![]() , Dietary urate index = 5;
, Dietary urate index = 5; ![]() , Dietary urate index = 0. * For SUA, 1 mg/dl is equivalent to 59·5 μmol/l.
, Dietary urate index = 0. * For SUA, 1 mg/dl is equivalent to 59·5 μmol/l.
Table 2 Mixed-effects regression models of serum uric acid (SUA) by individual dietary factors and by the dietary urate index, stratified by race among urban adults participating in the Healthy Aging in Neighborhoods of Diversity Across the Life Span with complete data on SUA at either of two visits (n 2136), 2004–2013 (Regression coefficients with their standard errors of the estimate (SEE))
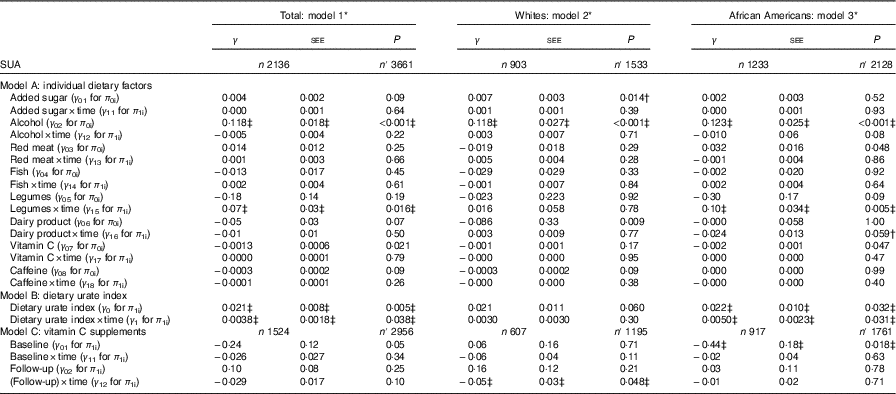
n, Number of participants in the analysis; n′, total number of visits included in the analysis; SUAbase, baseline serum uric acid concentration; SUArate, annual rate of change in serum uric acid concentration.
* Mixed-effects regression model with SUA as the outcome, random effects added to slope and intercept, and both slopes and intercept adjusted for multiple factors including baseline age, sex, race, poverty status, marital status, education, smoking and drug use, several dietary factors, BMI and an inverse Mills ratio. The main exposures were each of the eight dietary factors entered simultaneously and adjusted for all other dietary factors in addition to total grains, total fruits, total vegetables, other meats, discretionary solid fat and discretionary oils and the inverse Mills ratio. Baseline age was centred at 50 years, and all dietary factors were centred at their weighted means (Table 1, total). Model A is a single multivariable-adjusted mixed-effects linear regression model that included all eight individual dietary factors among others. Model B is a single multivariable-adjusted mixed-effects linear regression model that included only the dietary urate index and not the individual dietary factors. Model C includes all individual dietary factors (as in model A), but adds vitamin C-containing supplement as a main exposure with its time interaction term.
† P<0·05 for interaction with race to test effect modification by race for each of the eight dietary factors (including the dietary urate index) on SUAbase and SUArate.
‡ Values passed correction for multiple testing. Random effects are not shown for simplicity. See online Supplementary Method 2 for description of π s and γ s in the mixed-effects regression models.
Table 3 Sex-specific interactions of race with dietary factors and the dietary urate index in their association with serum uric acid (SUA) among urban adults participating in the Healthy Aging in Neighborhoods of Diversity Across the Life Span with complete data on SUA at either of two visits (n 2136), 2004–2013: mixed-effect regression models (Regression coefficients with their standard errors of the estimate (SEE))
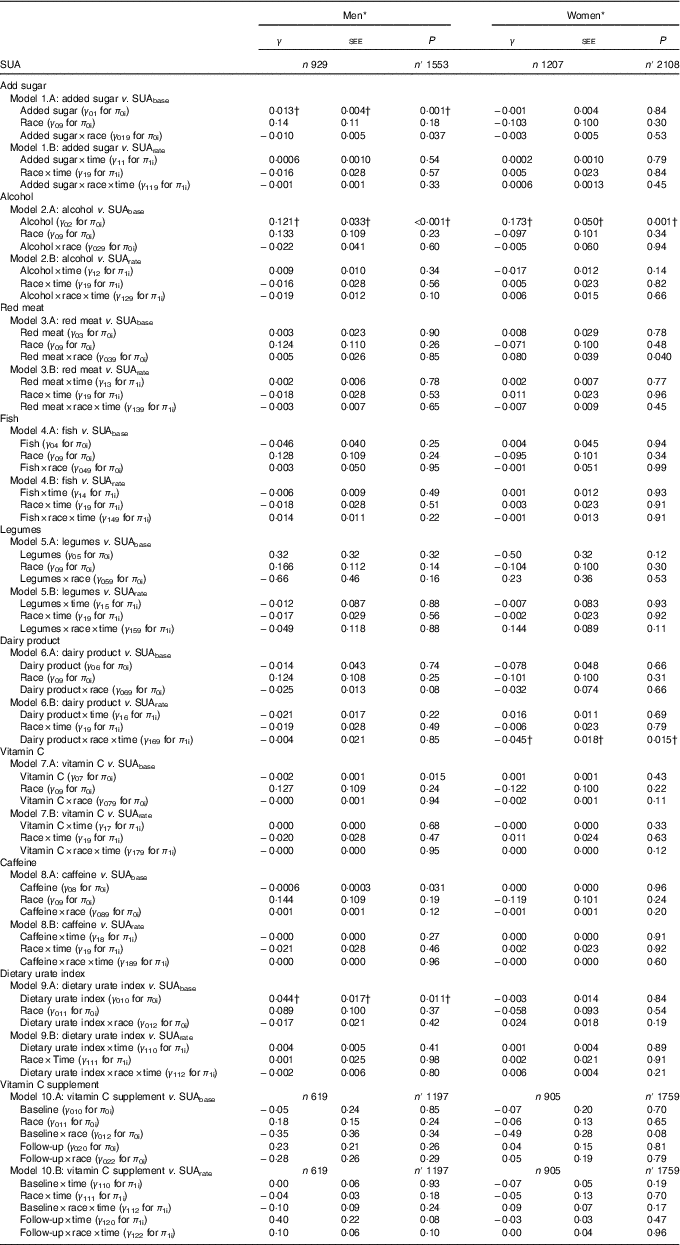
n, Number of participants in the analysis; n′, total number of visits included in the analysis; SUAbase, baseline serum uric acid concentration; SUArate, annual rate of change in serum uric acid concentration.
* Mixed-effects regression model with SUA as the outcome, random effects added to slope and intercept, and both slopes and intercept adjusted for multiple factors including baseline age, sex, race, poverty status, marital status, education, smoking and drug use, several dietary factors, BMI and an inverse Mills ratio. The main exposures were each of the nine dietary factors entered simultaneously and adjusted for all other dietary factors in addition to total grains, total fruits, total vegetables, other meats, discretionary solid fat and discretionary oils, and the inverse Mills ratio. Baseline age was centred at 50 years, and all dietary factors were centered at their weighted means (Table 1, total). In addition, a two-way interaction was added in models 1A–9A to examine the interactive effect of race and dietary factors on SUAbase. Similarly, a three-way interaction between time, race and the dietary factor was added in models 1B–9B to examine the interactive effect of diet and race on SUArate. Note that for models 9A and 9B, individual dietary factors were not included alongside the dietary urate index. Models 10A and 10B are the equivalent of model C in Table 2, with additional testing for interaction between vitamin C-containing supplements and race for baseline and rate of change in SUA.
† Values passed correction for multiple testing. Random effects are not shown for simplicity. See online Supplementary Method 2 for description of π s and γ s in the mixed-effects regression models.
In Table 3, among women, a synergistic interaction between race and red meat consumption in relation to SUAbase (γ 039=0·080 (SEE 0·039), P=0·040) was detected, whereby red meat consumption was associated with higher SUAbase only among AA women, as opposed to White women. Importantly, and after correcting for multiple testing, added sugars were associated with higher SUAbase particularly among White men with a significantly weaker association among AA men (γ 01=0·013 (SEE 0·004), P=0·001; γ 019=−0·010 (SEE 0·005), P=0·037). In contrast, an inverse association between baseline dairy product consumption and SUArate was observed among AA women, with a significantly stronger association than among White women (γ 16=0·016 (SEE 0·011), P=0·69; γ 169=−0·45 (SEE 0·018), P=0·015). Furthermore, the positive association between alcohol consumption and SUAbase was similar between men and women, with no racial differences within each sex group. Finally, the dietary urate index’s positive association with SUAbase was restricted to men without racial differentials within that sex group.
In a sensitivity analysis, the use of diuretics (approximately 7 % of the total population) was entered as a potential confounding factor in the association between dietary factors and SUAbase and/or SUArate. Our main findings were not significantly altered with this additional adjustment. A sensitivity analysis was also conducted adjusting for total energy intake. Given the comprehensive adjustment for many food groups, this further adjustment did not alter our findings. Excluding participants with only one SUA measurement, another sensitivity analysis was conducted on the main mixed-effects regression models (n 1525, n′ 3050). The results remained largely unaltered.
Discussion
To our knowledge, this is the first study to evaluate cross-sectional (SUAbase) and longitudinal (SUArate) associations between selected dietary factors and SUA in a sample of urban adults, while examining race-specific and sex- and race-specific associations and interactions. Previous studies examined the relationship between diet and SUA and failed to test race or race by sex differences. Large prospective cohort studies found an association between meat and seafood intakes, and gout risk and elevated SUA concentrations( Reference Choi, Mount and Reginato 3 , Reference Choi, Atkinson and Karlson 9 ). However, no association was found for other purine-rich foods such as peas, lentils, beans, spinach, mushrooms and cauliflower( Reference Choi, Mount and Reginato 3 ), which highlights the importance of certain aspects of purines in foods, including amount, bioavailability and types( Reference Choi, Mount and Reginato 3 ). The positive association between legume consumption and SUArate was restricted to AA. This finding is novel and worth exploring further in larger adult samples. However, the positive association between legume intake and SUA was found only in animal studies( Reference Rotimi, Olayiwola and Ademuyiwa 16 ). In fact, a one-cup equivalent increase in legume intake was associated with 0·07 increase in annual rate of change in SUA (predicted mean SUArate=0·03), a significant effect on the SUA trajectory, particularly among AA. Thus, reducing the annual rate of increase in the SUA by half among AA can be achieved by reducing intake of legumes to close to 0 cups/d among those who consume approximately half a cup/d.
Fructose intake can influence SUA directly through liver ATP utilisation for phosphorylation and production of ADP. In fact, oral fructose administration among hyperuricaemic patients further increased SUA( Reference Choi, Mount and Reginato 3 , Reference Emmerson 29 ). Using national data (the Third National Health and Nutrition Examination Survey, n 14 761 adults), a dose–response relationship was identified between soft drink consumption and SUA, with an effect ranging from 0·08 mg/dl higher SUA (for <0·5 servings v. no intake) to 0·42 mg/dl higher SUA (for ≥4 servings/d v. no intake), P-trend=0·003. Similar findings were observed for sugar-sweetened soft drinks’ relationship with hyperuricaemia( Reference Choi, Ford and Gao 12 ) and were replicated only in men in another analysis of a recent NHANES wave of data (2001–2002)( Reference Gao, Qi and Qiao 13 ). Examining gene–diet interactions, at least one study found a non-additive interaction between SLC2A9 genotype and sugar-sweetened beverage consumption in determining the risk of gout( Reference Batt, Phipps-Green and Black 30 ). The present study detected an association between added sugars and SUAbase only among White subjects, possibly due to genetic differences that would make White subjects more susceptible to hyperuricaemia with increased consumption of sugars as opposed to AA. However, this association suggested that a reduction of added sugars from 35 to 5 teaspoons/d would only potentially alter SUAbase by about 2–3 %, a small effect considering that the target effect is usually closer to 10 %. Nonetheless, larger epidemiological studies of adult populations are needed to verify those findings, and the underlying gene–diet interaction should be studied among both Whites and AA.
A recent meta-analysis of 42 924 adults reported a linear dose–response relationship between alcohol consumption and the risk for gout. Taking no/little alcohol drinking as a common referent, light (≤1 drink/d), moderate (>1 to <3 drinks/d) and heavy drinking (≥3 drinks/d) had a risk ratio of 1·16 (95 % CI 1·07, 1·25), 1·58 (95 % CI 1·50, 1·66) and 2·64 (95 % CI 2·26, 3·09), respectively( Reference Wang, Jiang and Wu 31 ). Studies also showed that this positive association between alcohol and SUA pertained mostly to beer and liquor/spirits( Reference Choi, Atkinson and Karlson 8 ). Similar to fructose, alcohol increases UA liver production through ATP degradation, leading to accumulation of ADP and AMP. In addition, alcohol intake leads to dehydration and metabolic acidosis, resulting in a decreased urate excretion( Reference Choi, Mount and Reginato 3 ). Findings from this present study, however, indicated a positive association between alcoholic beverage consumption and SUAbase, without race or race by sex interaction. Similar to what was shown for added sugars, the effect size detected indicated that going from 2 to 1 drinks/d (1·5 (sd 0·5)) would reduce SUAbase by 2 %, a relatively weak effect. Thus, a large effect is only noticeable among heavy drinkers going from 5 drinks or more/d to 0–1 drinks/d. The same SUAbase effect size was observed for the dietary urate index, going from −5 to 0 or from 0 to 5.
Vitamin C may also be inversely related to SUA based on a cross-sectional study( Reference Ryu, Kang and Kim 32 ) and a meta-analysis of randomised controlled trials that administered a median dose of 500 mg/d( Reference Juraschek, Miller and Gelber 33 ). Biological mechanisms involved include a uricosuric effect of vitamin C at the URAT1 and a Na-dependent anion co-transporter SLCA5A8/A12, enhanced higher fractional kidney clearance of UA and a lower oxidative damage of body cells that reduce SUA( Reference Towiwat and Li 15 ). In this present study, among men, low vitamin C was shown to increase SUAbase, with no significant interaction by race. Similarly, supplemental vitamin C was shown to be inversely related to SUArate among Whites and SUAbase among AA. However, randomised controlled trials among men are needed to confirm this observation.
Several studies reported an inverse association between dairy product consumption and SUA/gout( Reference Poletto, Harima and Ferreira 11 , Reference Towiwat and Li 15 ), suggesting, for the most part, a protective effect of milk and low-fat yogurt against gout occurrence and hyperuricaemia( Reference Choi, Atkinson and Karlson 9 ). The evidence also points to a tendency of vegan diet lacking dairy products to be more hyperuricaemic than a vegetarian or a fish-eating type of diet, especially among men( Reference Schmidt, Crowe and Appleby 34 ). Several underlying mechanisms were suggested, including the effects of orotic acid in milk, which enhances renal urate excretion, the uricosuric effect of milk casein and lactalbumin and a potential biological relationship between vitamin D on SUA( Reference Towiwat and Li 15 ). The present study found that SUArate was negatively related to dairy product intake, especially among AA women (significant interaction by race among women), though stratum-specific findings did not pass correction for multiple testing. Although milk constitutes a substantial portion of dairy product consumption among HANDLS participants, yogurt, on the other hand, contributes little to the total serving of dairy product among this population.
Finally, although some components of the dietary urate index had a stronger influence on SUA than others, the index itself was associated with both baseline and rate of change in SUA though only among AA. The dietary quality indices (higher in fruit, vegetables, nuts, whole grains, and low-fat dairy product and lower in red meats), which incorporate many of the components used to create the dietary urate index, have been shown to be effective in lowering blood pressure( Reference Appel, Moore and Obarzanek 35 ), serum homocysteine( Reference Appel, Miller and Jee 36 ) and SUA( Reference Tang, Miller and Gelber 37 , Reference Rai, Fung and Lu 38 ), which is more substantial among individuals with hyperuricaemia( Reference Juraschek, Gelber and Choi 39 ). In our sample, it was shown to have a weak to moderate inverse correlation with the dietary urate index. Several studies have examined the potential effect of dietary approaches to stop hypertension (DASH) diet on SUA and gout. In a prospective study involving 44 444 men from the Health Professionals Follow-Up cohort, Rai et al. evaluated the relationship between the dietary patterns (DASH v. Western) on the incident gout risk over a follow-up time of 26 years. They found that the DASH diet was associated with reduced risk whereas the Western diet was associated with increased risk of incident gout( Reference Juraschek, White and Tang 38 ). Juraschek et al. report the results of two ancillary studies from a randomised, crossover, clinical trial comparing the DASH diet to a control diet. In the first study, the authors evaluated the effect of dietary pattern assignment among 103 adults with prehypertension or stage I hypertension on change in SUA level according to randomly assigned level of Na consumption (low, medium and high). The study suggested that DASH diet was associated with reduced UA level, especially among patients with high baseline UA level and that high Na level was also beneficial in terms of reducing UA level( Reference Juraschek, Gelber and Choi 39 ). In the second study, the authors examined the effect of partial DASH replacement among AA subjects with controlled hypertension who were assigned to the DASH-Plus intervention (coach-directed dietary advice, assistance with DASH-related food purchase, home food delivery) or the control (DASH brochure and debit account to purchase foods) and were followed up from baseline until 8 weeks after treatment to measure change in SUA. The authors obtained similar results to the first study, which suggests a beneficial effect of the DASH diet on SUA levels(40).
Among its strengths, our present study systematically evaluated SUA’s race-specific association with selected dietary factors, as well as simultaneous effect modification by sex and race. Despite its strengths, some limitations include a statistical power-limiting small sample size (online Supplementary Method 3), which precluded further adjustment for incomplete potential confounders, such as lipid profiles, ferritin, C-reactive protein and depressive symptoms. In fact, further analyses suggested that the power to detect the effect that was detected in the present study’s models was more adequate for the total population than for race-stratified models. Another limitation is the lack of adequately measured baseline covariates that could potentially act as confounders, including baseline physical activity. Residual confounding could be of significant concern due to the lack of this covariate. Finally, the use of the dietary urate index, though a novel addition, was not conducted or validated elsewhere. Nevertheless, this index was found to be weakly but inversely correlated with the Healthy Eating Index (HEI-2010, r −0·17, P<0·001), which was used in numerous studies including HANDLS( Reference Fanelli Kuczmarski, Cotugna and Pohlig 41 – Reference Beydoun, Fanelli-Kuczmarski and Allen 45 ). Similarly, the dietary urate index was also weakly and inversely related to the DASH and mean adequacy ratio (MAR) diet quality total scores. Specifically, the dietary urate index when examined as quintiles was linearly and inversely associated with the following HEI-2010 components: total vegetables, total fruits, whole fruits, whole grains, dairy product and the solid fat, alcohol and added sugars component. Most of the remaining HEI-2010 components were positively related to the dietary urate index. In the case of DASH components, those that have shown a linear inverse relationship with the dietary urate index included cholesterol, fibre, Mg, Ca and K. Other components, however, such as saturated fat, fat and Na were directly and linearly associated with the dietary urate index (online Supplementary Table S1 and Supplementary Method 1). Similarly, a higher dietary urate index was specifically inversely related to the Ca, Mg, vitamins B1, B2, C and D as well as the folate components of the MAR score.
In sum, race and sex interactions with dietary intakes were detected in determining SUA. Specifically, added sugar’s positive association with SUAbase was restricted to White men whereas the inverse association of dairy product consumption on SUArate was restricted to AA women. Similarly, SUArate was positively linked to legume consumption only among AA. Nevertheless, the positive association between alcohol consumption and SUAbase was largely similar across race and sex groups. Supplemental vitamin C may have putative protective effects among both Whites and AA. Further studies of similar adult populations and incorporating larger samples of urban adults are needed to replicate these findings.
Acknowledgements
The authors would like to thank Ola S. Rostant and Nicolle Mode for their internal review of the manuscript.
This work was fully supported by the Intramural Research Program of the National Institutes of Health, National Institute on Aging.
M. A. B. had full access to the data used in this manuscript, completed all the statistical analyses and performed the data management and statistical analysis and had primary responsibility for the final content. M. A. B., M. T. F.-K., J.-A. C., H. A. B., M. K. E. and A. B. Z. wrote and revised the manuscript. M. A. B., M. T. F.-K., J.-A. C. and A. B. Z. planned the analysis. M. T. F.-K., M. K. E. and A. B. Z. participated in data acquisition. M. T. F.-K., J.-A. C. and H. A. B. participated in literature review. H. A. B. participated in literature search. All authors read and approved the final version of the manuscript.
The authors declare that there are no conflicts of interest.
Supplementary material
For supplementary material/s referred to in this article, please visit https://doi.org/10.1017/S0007114518002118


