Children with a height of 2 sd below the mean for age and sex in the general population are defined as having a short stature and are referred to paediatric endocrinology(Reference Deodati and Cianfarani1). In about 20 % of the children with a short stature, a medical explanation for the poor linear growth will be found(Reference Deodati and Cianfarani1, Reference Cohen, Rogol and Deal2). The other 80 % of these children remain without a definitive diagnosis and are labelled as having idiopathic short stature (ISS). ISS is defined as a condition in which the height of an individual is more than 2 sd below the corresponding mean height for a given age, sex and population group, without evidence of systemic, endocrine, nutritional or chromosomal abnormalities(Reference Deodati and Cianfarani1, Reference Cohen, Rogol and Deal2).
Although the process of linear growth is not entirely understood, it is well known that the somatotropic axis play a key role in this(Reference Loveridge and Noble3). The somatotropic axis originates in the hypothalamus region and in the pituitary gland, situated right beneath the hypothalamus. Through the central release of growth hormone (GH), a peripheral production of insulin-like growth factor 1 (IGF-1) is stimulated. IGF-1 receptors are found in proliferating bone chondrocytes, and IGF-1 itself stimulates the synthesis of collagen(Reference Karlberg4). From epidemiological studies it is known that the somatotropic axis is associated with linear growth in infancy, childhood and puberty. Increased IGF-1 concentration and subsequently an increased growth velocity determine the growth curve of each individual child(Reference Juul, Dalgaard and Blum5).
To increase linear growth in children having ISS, the effect of GH therapy has been studied extensively. A meta-analysis using three randomised controlled trials has shown that the mean adult height was − 1·5 sd score for GH-treated children with ISS and − 2·3 sd score for untreated children with ISS. The adult height achieved by those in the treated group significantly exceeded that of the controls, with a mean difference of 0·65 sd score (about 4 cm)(Reference Deodati and Cianfarani1). The mean duration of therapy was 5·4 (sd 1·5) years(Reference Deodati and Cianfarani1). The cost of height gain attributable to treatment in children with ISS is about $10 000–20 000/cm(Reference Hintz, Attie and Baptista6). At the current time, there is a study demonstrating improved quality of life and better psychological health due to GH/IGF-1 treatment, particularly in children with GH deficiency(Reference Huisman7). However, the benefits of treatment should be balanced with the high cost and unknown side effects of these therapies(Reference Cohen, Rogol and Deal2). Consequently, in several countries, treatment of ISS by GH or IGF-1 treatment is not paid by insurance(Reference Colsman and Sandberg8).
As an alternative to stimulate linear growth by injections of GH/IGF-1, it is possible to stimulate GH release, and hence growth physiologically. Physiological factors influencing GH release and growth include sleep(Reference Van Cauter, Plat and Copinschi9), exercise(Reference Wideman, Weltman and Hartman10) and diet(Reference van Vught, Nieuwenhuizen and Brummer11, Reference Moller and Jorgensen12). Indeed, from 1982, intravenous arginine administration has been clinically used as a method to assess the responsiveness of the GH secretory system, for example, when GH deficiency is suspected(Reference Biller, Samuels and Zagar13). GH concentration can increase 20-fold after an intravenous arginine bolus (0·5 g/kg)(Reference Biller, Samuels and Zagar13, Reference Merimee, Lillicrap and Rabinowitz14). Additionally, a single oral bolus of arginine has been found to increase GH concentration 2–4·5-fold in adults(Reference Collier, Casey and Kanaley15, Reference Isidori, Lo Monaco and Cappa16).
There is evidence that increased arginine intake increases the GH/IGF-1 release. However, the direct association between habitual dietary arginine intake and linear growth is not well documented. The present study therefore examines the influence of diet, and, in particular, the habitual intake of arginine on growth, while also defining the amount of arginine intake needed for optimal growth in pre-pubertal children. Optimal growth in the present study is defined as the maximum growth velocity.
Methods
Population and design
The data were derived from the Copenhagen School Child Intervention Study (CoSCIS). The CoSCIS aimed to examine the impact of a doubling of the lessons in physical education and health education for children in terms of physical and mental health, motor function and well-being(Reference Eiberg, Hasselstrom and Gronfeldt17). All children (n 1024) in all eighteen preschool classes in two suburbs of Copenhagen (Ballerup and Taarnby) were invited to participate in the CoSCIS. The present study was conducted according to the guidelines laid down in the Declaration of Helsinki and all procedures involving human subjects/patients were approved by the ethical committee at the University of Copenhagen (reference KA00011gm). Written informed consent from parents or guardians was required for inclusion.
The intervention consisted of standard physical education classes used within the Danish school curriculum, with the volume increased to the equivalent of four school classes per week (180 min/week) delivered as two weekly classes. The control group continued to receive the usual two classes per week (90 min/week). In the Danish school curriculum, physical education classes take place every week throughout the whole school year from August to June, and participation is mandatory for every child. The city council of Ballerup decided in 1999 that the intervention should be carried out in all schools in the community from preschool (6–7 years) to the third grade (9–10 years). Hence, children from Ballerup served as the non-randomised intervention group and children from Taarnby as the control group. Taarnby was selected because the community, by comparison of socio-economic status (SES) and other community statistics, was similar to Ballerup.
Baseline measurements were performed from December 2001 until June 2002 in children at 6–7 years of age. Follow-up measurements took place from September 2004 until May 2005 in children at 9–10 years of age (3-year follow-up) and from September 2008 until December 2008 in children at 13–14 years of age (7-year follow-up). For the 7-year follow-up, informed consent from children and parents or guardians was sought again, as this measurement was not planned in the first proposal.
Data collection
Demographic variables
Demographic data, such as sex and age, were recorded in the school registry system.
Anthropometric variables
Height at baseline and follow-ups was measured with a portable Harpenden (UK) stadiometer to the nearest 1 mm in stockinet feet, with the child standing upright against the stadiometer. Growth velocity (in cm/year) was calculated as follows: (height at 7-year follow-up − height at baseline)/years between 7-year follow-up and baseline. Body weight was measured using an electronic scale (Seca 882; Medical Scales) with the subjects lightly dressed to the nearest 0·1 kg. All measurements were performed during school time by experienced scientists. Control measurements did not display systematic differences between the scientists.
Dietary information
Dietary information was collected in May 2002 (baseline) and May 2005 (3-year follow-up). Parents recorded the dietary intake of their child for seven consecutive days in booklets with precoded fixed answer possibilities supplemented with a possibility for open answers. This booklet for dietary recording has been developed and used in nationwide dietary surveys since 1995(Reference Husby and Steding-Jessen18). The eighteen-page precoded food diary had lists of 277 food items, chronologically divided in sections for breakfast, lunch, dinner and in-between snacks. The design of the diary was similar to a cross-table with food listed on the left and portion sizes across the top. Food amounts in the diary were presented in household units (e.g. glasses, pieces or tablespoons) or as portions estimated from photographs. Along with the food diary, each participant received a photographic booklet that contained thirteen series of colour photographs, each with four different photographs ranging from small to large portion sizes. Participants indicated an eating event by filling in how many units they had eaten of each food item in the specific time span. Intakes of foods as well as energy, protein and specific amino acids (i.e. arginine intake) were calculated using the General Intake Estimation System, developed by the Danish Institute for Food and Veterinary Research in 2005 with use of the food database from the National Food Institute in Denmark(Reference Moller, Saxholt and Christensen19). Corrections for losses in cooking were made when calculating nutrient contents.
Dietary information of children who were ill during the dietary reporting at baseline or follow-up was excluded, as well as dietary information of subjects who had reported their dietary intake less than 6 d.
The mean intakes of arginine in g/d from baseline and the 3-year follow-up examinations were calculated ((intake of arginine at baseline+intake of arginine at 3-year follow-up)/2) and used in the present study as the main determinant. The mean energy and protein intakes from baseline and the 3-year follow-up were used in the present study as potential confounders.
Puberty development
Pubertal stage was assessed from a scale of pictures according to Tanner at 3-year and 7-year follow-up. Girls were staged according to breast development (b1–b5). The category b1 means no development of breasts and b5 means full/finished development of breasts. For boys, measures of genital development (g1–g5) were used. The category g1 means that the growth and development of the genitals has not begun, and g5 means fully grown and mature development of the genitals. The children were asked to rate their stage of sexual maturity by comparison with Tanner's photographs and drawings. The girls did that together with a female laboratory technician and the boys together with a male staff member. This was done to respect the children's privacy after a careful explanation of the procedures and purpose, which also was provided to the parents who were invited to participate in the assessment.
Information from the parents (parental height and socio-economic status)
At baseline, height of both parents and information about SES were assessed by questionnaires. The classification of SES was based on information about the education of the mother in the household, since previous studies have suggested that health-related risk factors considered in the CoSCIS are more strongly associated with the SES of the mother rather than that of the father(Reference Gnavi, Spagnoli and Galotto20–Reference Kristensen, Wedderkopp and Moller22). The education level of the mother was divided into three categories: (1) ≤ 10 years elementary school, (2) high school or short non-university programmes less than 3 years, (3) college or university degree over 3 years.
Statistical analysis
Descriptive data are presented as means and standard deviations for continuous variables and as proportions for categorical variables.
Growth velocity was normally distributed, according to histograms and the Kolmogorov–Smirnov/Shapiro–Wilk test. There were equal variances among the residuals and there was no autocorrelation present in the residuals, according to Levene's test and the Durbin–Watson test.
Subjects with incomplete information on height or arginine intake were excluded. Missing values of potential confounders were imputed by means (continuous variables) or medians (categorical variables) ( < 10 % of cases for all confounders). No different results were found when analyses were performed with and without imputed data.
Data were analysed in a multilevel structure in which children (level 1) were embedded within schools (level 2). Arginine intake was converted into quintiles and treated as the categorical variable. The relationship between arginine intake and growth velocity showed non-significant variance in intercepts and slopes across the participants in schools.
The association between arginine intake and growth velocity was estimated, including the following covariates: sex; age; baseline height and weight; mean energy intake; puberty stage at the 7-year follow-up; SES; height of the mother; height of the father; a dummy variable for group (intervention, 1; control, 0). There was no multicollinearity in the variables (variance inflation factor; VIF < 3·6).
To obtain the final model, we used a manual stepwise backward selection procedure. Covariates that changed all of the regression coefficients of arginine quintiles by less than 10 % were one by one deleted from the model. The following covariates were left in the final model: sex; age; baseline height; energy intake; puberty; group. In a subsequent model, we added dietary protein (excluding arginine, quintiles) as a covariate in the final model. Furthermore, the association between dietary protein (excluding arginine) and growth velocity was estimated, adjusted for sex, age, baseline height, energy intake, puberty and group. The P value for trend was calculated by using the median of each quintile of dietary arginine or protein as a continuous variable in the linear regression analysis.
In order to determine whether specific combinations of covariates were associated with growth velocity, the effects were tested using interaction terms. The following combinations were separately added to the final model: ‘arginine × group’, ‘arginine × sex’ and ‘arginine × puberty’. None of these interaction terms was significant.
All analyses were conducted with the SPSS statistical software package version 16.0 for Windows (SPSS, Inc.). P values < 0·05 were considered as statistically significant.
Results
Fig. 1 presents a flow chart of the subject inclusion. A total of 686 Caucasian children (67 %) aged 6·7 (sd 0·4) years (range 5·6–8·2) years agreed to participate; children included 218 boys and 185 girls from Ballerup and 141 boys and 142 girls from Taarnby. At 3 years later, the children were retested. Of these children, fifty-one had withdrawn their consent to participate, twenty-eight had moved away from the two districts and eleven did not attend the testing, leaving 596 children to participate in the 3-year follow-up examination. Again, 3 years later, the children were retested. Of these, 101 children did not give their consent to participate, thirty had moved away from the two districts and thirty-three did not attend the testing, leaving 432 children participating in the 7-year follow-up examination. Incomplete information at baseline or follow-up on height (n 4) or arginine intake (n 167) was excluded from the present analysis, leaving 261 children for data analysis.

Fig. 1 Flow diagram of inclusion in the Copenhagen School Child Intervention Study (CoSCIS) and in the present study. BA, baseline; FU1, follow-up 1; FU2, follow-up 2.
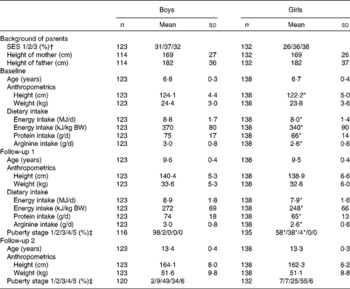
The characteristics of the children, grouped by year and sex are shown in Table 1. Energy intake, protein intake and arginine intake were lower in girls than in boys.
Table 1 Descriptives of children who participated in the present study (Mean values and standard deviations or percentages)

SES, socio-economic status of the mother; BW, body weight.
* Mean values or percentages were significantly different from those of the boys (P< 0·05).
† SES: 1, ≤ 10 years elementary school; 2, high school or short non-university programmes under 3 years; 3, college or university degree over 3 years.
‡ Puberty stage according to Tanner's stages. Girls are staged according to breast development (b1–b5). The category b1 means no development of breasts and b5 means full/finished development of breasts. For boys, measures of genital development (g1–g5) are used. The category g1 means that the growth and development of the genitals has not begun, and g5 means fully grown and mature development of the genitals.
Furthermore, the baseline characteristics (i.e. baseline sex, age, height, weight, parental height and SES) of the included children in the analysis were compared with the baseline characteristics of the total database (including all missing values) (Table 2). No differences in these baseline characteristics were found.
Table 2 Descriptives of children participating in the present study and the complete database* (Mean values and standard deviations or percentages)

SES, socio-economic status of the mother.
* No differences between the descriptives of children participating in the present study and the complete database (P>0·73).
† SES: 1, ≤ 10 years elementary school; 2, high school or short non-university programmes under 3 years; 3, college or university degree over 3 years.
Table 3 presents the crude and adjusted association between mean arginine intake and growth velocity in children from 7 to 13 years of age. The crude, unadjusted, model showed no statistically significant association between arginine intake and growth velocity. After adjustment for confounders (sex, age, baseline height, energy intake, puberty and group), significant associations between arginine intake and growth velocity were apparent (P for trend = 0·04). The association between arginine intake and growth velocity was significant at the third and fourth quintile of arginine intake (2·5–2·8 and 2·8–3·2 g/d, respectively) compared with the first quintile ( < 2·2 g/d). No difference on growth velocity was found between the first and fifth quintile of arginine intake (Table 3; Fig. 2). The maximal mean difference in growth velocity was found between the first and fourth quintile (0·33 (sd 0·14) cm/year; P= 0·02).
Table 3 Association of dietary arginine (mg/d) or dietary protein (excluding arginine) (g/d) and growth velocity (cm/year) (β Coefficients and 95 % confidence intervals; n 261)

* Values were significantly different compared with an arginine intake < 2200 mg/d or protein intake < 58 g/d.
† Adjusted for sex, age, baseline height, puberty stages at follow-up 2, and group (intervention/control).
‡ Adjusted for sex, age, baseline height, mean energy intake (MJ/d), mean protein intake (excluding arginine) (g/d), puberty stages at follow-up 2, and group (intervention/control).
§ Adjusted for sex, age, baseline height, mean energy intake (MJ/d), puberty stages at follow-up 2, and group (intervention/control).

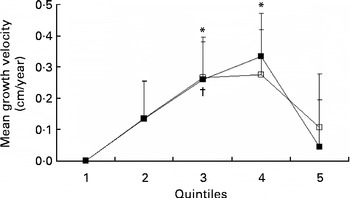
Fig. 2 Growth velocity (cm/year) per quintile of mean arginine intake (■) and protein intake (excluding arginine) (□), adjusted for sex, age, baseline height, mean energy intake, puberty stage and group (n 261). Values are means, with standard errors represented by vertical bars. * Mean value was statistically significant compared with the first quintile of arginine intake (P= 0·03 and P= 0·02, respectively). † Mean value was statistically significant compared with the first quintile of protein intake (excluding arginine) (P= 0·04). Arginine: quintile 1, < 2·2 g/d; quintile 2, 2·2–2·5 g/d; quintile 3, 2·5–2·8 g/d; quintile 4, 2·8–3·2 g/d; quintile 5, >3·2 g/d.
When we added dietary protein (excluding arginine) (g/d) to the final model as an additional covariate, the significant associations between arginine intake and growth velocity were no longer statistically significant (Table 3).
When we studied the associations between dietary protein minus arginine (g/d) and growth velocity, a significant difference was found for the third quintile of protein minus arginine intake (65·0–71·6 g/d) compared with the first quintile of protein minus arginine intake ( < 58·1 g/d). The maximal mean difference in growth velocity was 0·27 (sd 0·13) cm/year (P= 0·04; Table 3; Fig. 2). The test for trend between protein intake and growth velocity was not statistically significant (P= 0·14).
Discussion
The aim of the present study was to investigate the association between dietary amino acid arginine and growth velocity, and, more specifically, to estimate the amount of arginine intake needed for optimal growth in children aged 7–13 years. The results indicated that a habitual high mean arginine intake was associated with a higher growth velocity after adjustment for sex, age, baseline height, mean energy intake (kJ/d), puberty stage and group (intervention/control). Children with an arginine intake between 2·8 and 3·2 g/d grew 0·33 cm/year faster compared with children with an arginine intake lower than 2·2 g/d. This is a remarkable finding in a group of healthy Danish children, considering that these children had no indication of malnutrition and their protein intake (70 g/d), and consequently arginine intake, was several-fold the intake level believed to satisfy physiological needs (0·95 g/kg body weight)(23, Reference Rolland-Cachera, Davies and Cole24). The present results are in line with a previous study in rats on the association between dietary arginine and linear growth(Reference Jiang and Cai25). However, to our knowledge, the present study is the first to demonstrate a dose–response effect between arginine intake and growth velocity, and to define a value for arginine intake associated with maximal linear growth, i.e. an intake of 2·8–3·2 g arginine/d for a maximal growth velocity.
Although there was a statistically significant positive association (P for trend) between arginine intake and growth, the highest quintile of arginine intake was characterised by a lower growth rate than quintiles 3 and 4 (Table 3; Fig. 2). This would be consistent with an optimal intake level of arginine equal to quintiles 3 and 4, i.e. between 2·5 and 3·2 g/d. Further research on this issue is warranted.
The association between arginine intake and growth velocity became non-significant after adding dietary protein (without arginine) as a covariate. In Western, well-nourished societies, the majority of dietary protein is of animal origin (dairy products, meat and fish), resulting in only limited variation in both quantity and quality of protein and amino acids among children in the present study(Reference Kittler and Sucher26).
As dietary arginine and protein (without arginine) are highly correlated (r 0·8 in the present study), it is not unexpected that the effect of arginine on linear growth disappeared when we adjusted for protein intake (without arginine). Therefore, due to the observational design of the present study, we cannot conclude from the present data that arginine is the single amino acid associated with linear growth. Nevertheless, the association between total protein minus arginine and growth velocity was weaker than the association between dietary arginine and growth velocity. In addition, the P value for trend was not significant for total protein minus arginine, suggesting a stronger relationship for arginine than for total protein.
The association between dietary protein and linear growth has been observed in several human studies. Indeed, other observational studies have shown positive associations between protein intake and linear growth among 2·5- and 10-year-old children, after adjustment for sex and body weight(Reference Hoppe, Molgaard and Thomsen27, Reference Hoppe, Udam and Lauritzen28). Other studies have also supported the notion that protein is associated with linear growth. A study on the effects of macrobiotic diets on linear growth in infants and children until 10 years of age has shown that linear growth was reduced in children on a macrobiotic diet compared with children on an omnivorous diet, and that linear growth was positively associated with the protein content of the diet, but not with energy intake(Reference Dagnelie, van Dusseldorp and van Staveren29, Reference Dagnelie, van Staveren and Vergote30). Moreover, the addition of dairy products and fatty fish (both high in protein) to a macrobiotic diet had a marked positive effect on linear growth in these children(Reference Dagnelie, van Dusseldorp and van Staveren29, Reference Van Dusseldorp, Arts and Bergsma31).
The mechanism linking dietary protein to linear growth is not well understood. Insulin is increased after ingestion of certain amino acids and carbohydrates(Reference van Loon, Saris and Verhagen32, Reference van Loon, Kruijshoop and Menheere33), which could lead to a rise in IGF-1 concentration, although a previous study did not detect differences in GH or IGF-1 responses after ingestion of different mixtures of protein and/or carbohydrates(Reference van Loon, Kruijshoop and Menheere33). Minerals, such as Zn and Ca, of which the intake is usually increased in individuals with a high protein intake, may also be associated with IGF-1; however, these results are also controversial(Reference Wastney, Martin and Peacock34–Reference Devine, Rosen and Mohan36). Arginine is thought to inhibit endogenous somatostatin release, and consequently stimulate the release of GH. Besides, it has been argued that NO, a metabolite of arginine, may be involved in the inhibition of somatostatin release(Reference Jiang and Cai25). The present study could not confirm an involvement of GH or IGF-1, as these measures were not available for our cohort.
Furthermore, the following limitations should be kept in mind when interpreting the results of the study. Measurement error in estimating the amount of arginine intake in children may have occurred despite dietary data having been carefully collected by 7 d food records(Reference Biro, Hulshof and Ovesen37). Lillegaard et al. (Reference Lillegaard and Andersen38) found that 57 % of the participants were classified as acceptable reporters, 39 % as under-reporters and 4 % as over-reporters with the precoded food diary. This suggests that energy intake in the present study may have been under-reported. However, other studies have shown that, although energy intake is frequently under-reported, protein reporting is more accurate and less influenced by errors than energy(Reference Heitmann and Lissner39). While errors in total protein may not be substantial, and even if the mean intake of arginine from the present study corresponds well with the mean intake of arginine in another Danish database in children, it remains unknown whether this also applies to the composition of the amino acids, the building blocks of protein.
Besides, loss to follow-up was relatively high, especially in the 7-year follow-up. This is probably due to the repeated informed consent for the 7-year follow-up, which was not included in the original research protocol of the study. However, based on the similarity of baseline variables of the children included in the final analysis and the complete set of children (Table 2), we expect no bias due to loss to follow-up.
The intake of protein and consequently arginine in Western society is several-fold the physiological needs, and there is a small variation in main protein sources. Therefore, studies on dietary arginine could give stronger associations with linear growth in the non-Western society, where intake of protein is less and where there is more variation in main protein sources (i.e. soya and vegetables). Experimental studies are needed to investigate the specific role of arginine on growth velocity compared with other amino acids.
Implications and future research
The aim of the present study was to gain knowledge about physiological triggers, i.e. dietary interventions, as an alternative for GH therapy to stimulate linear growth. A meta-analysis investigating the effect of GH therapy on height gain in children with ISS showed an increase in height of approximately 4 cm during 5–7 years of GH therapy v. no treatment(Reference Deodati and Cianfarani1), i.e. approximately 0·7 cm/year. In normally growing children, we found a maximal growth velocity associated with dietary arginine of 0·3 cm/year. This is approximately half of the calculated effect of GH on growth velocity. Of note, in the present study, we have not investigated the effect of arginine intake on linear growth in children with a short stature, but in normally growing children. The effect of arginine on linear growth in children with a short stature will have to be further investigated in future studies.
Conclusion
The present study is the first to show a dose–response effect between dietary protein and, specifically, dietary arginine, and growth velocity in normally growing children. The present results suggest a dose-dependent physiological role of habitual protein intake, and specifically arginine intake, on linear growth in children. The present data indicate that children with an arginine intake between 2·8 and 3·2 g/d grew 0·33 cm/year faster compared with children with an arginine intake below 2·2 g/d. However, since the study was designed in healthy children, we cannot firmly conclude whether arginine supplementation represents a relevant clinical strategy, and therefore further research will be needed to investigate whether dietary protein and, in particular, dietary arginine may also represent a nutritional strategy in the prevention and treatment of short stature. We think such research would be especially valuable since arginine as a dietary constituent is not only dramatically less expensive than GH therapy, but also far more convenient for children and their parents. One possible step could be the initiation of observational studies on the relationship of protein and arginine intake and growth in children with a short stature.
Acknowledgements
This study received no specific grant from any funding agency in the public, commercial or not-for-profit sectors. A. J. A. H. v. V., B. L. H., P. C. D. and I. C. W. A. were responsible for conceiving the research idea. B. L. H., K. F., L. B. A., B. E.-N. and A. B. were responsible for collection of the data. B. M. N. was responsible for calculation of the nutrients and cleaning of the diet data. A. J. A. H. v. V. and P. C. D. analysed the data and wrote the manuscript. B. L. H., I. C. W. A., K. F., L. B. A., B. E.-N., A. B. and B. M. N. reviewed the manuscript. None of the authors had a personal or financial conflict of interest.