


Pregnancy is characterised by increased insulin resistance and several other metabolic alterations to support fetal growth( Reference Lain and Catalano 1 ). Lipid metabolism in pregnancy is influenced by both anabolic and catabolic stages, which eventually lead to a more atherogenic lipid profile( Reference Herrera 2 ). Obesity magnifies pregnancy-induced insulin resistance and metabolic changes, and increases the risk of pregnancy complications, including gestational diabetes mellitus (GDM)( Reference Siega-Riz 3 , Reference Catalano 4 ). In addition to obesity, also GDM is characterised by increased insulin resistance and has been related to a more unfavourable lipid profile( Reference Meyers-Seifer and Vohr 5 ), as well as an increased risk of CVD( Reference Shah, Retnakaran and Booth 6 ) in later life.
Evaluation of circulating lipoprotein particle profile is an alternative method to standard lipid testing in prediction of CVD and takes into account the heterogeneity in particle size and density of the lipoprotein subclasses( Reference Mora, Otvos and Rifai 7 ). In observational studies on non-pregnant populations, elevated concentrations and smaller size of LDL particles, elevated concentrations and larger size of VLDL particles, as well as lower concentrations and smaller size of HDL particles, have been related to increased insulin resistance and/or a higher risk of type 2 diabetes (T2D) and CVD( Reference Mora, Otvos and Rifai 7 – Reference Garvey, Kwon and Zheng 9 ). Moreover, in pregnant populations, larger VLDL size has been associated with recurrent preterm birth and earlier gestational age at delivery( Reference Thorp, Rice and Harper 10 , Reference Grace, Vladutiu and Nethery 11 ).
With regard to circulating fatty acids, several fatty acids have been proposed as novel biomarkers in cardiovascular risk prediction( Reference Wurtz, Havulinna and Soininen 12 , Reference Jackson and Harris 13 ). Circulating n-3 PUFA have been associated with reduced CVD risk( Reference Matthan, Ooi and Van Horn 14 ). Moreover, in a recent meta-analysis including data from three population-based cohort studies, higher serum MUFA concentrations were associated with increased risk, whereas higher n-6 PUFA concentrations were associated with reduced risk of CVD( Reference Wurtz, Havulinna and Soininen 12 ).
Healthy diet is one of the major factors contributing to cardiovascular health( Reference Lloyd-Jones, Hong and Labarthe 15 ). A few studies in non-pregnant populations suggest that healthy dietary patterns could modify lipoprotein profiles to less atherogenic by influencing lipoprotein particle concentrations and sizes. For instance, an adherence to a Mediterranean diet supplemented with nuts resulted in an increase in LDL particle size in a population at high CVD risk( Reference Damasceno, Sala-Vila and Cofan 16 ), whereas a 4-week lean-seafood intervention led to a reduced VLDL particle size in healthy individuals( Reference Aadland, Lavigne and Graff 17 ). Furthermore, diet enriched with pistachio for 4 months resulted in reduced small LDL particle concentration compared with a nut-free diet( Reference Hernandez-Alonso, Salas-Salvado and Baldrich-Mora 18 ).
In addition to the wide use of circulating fatty acids as biomarkers of dietary fat intake, studies on food intakes have reported strong correlations between fish intake and circulating n-3 PUFA concentrations in non-pregnant populations( Reference Saadatian-Elahi, Slimani and Chajes 19 , Reference Astorg, Bertrais and Laporte 20 ). Furthermore, findings from a large sub-study of the European Prospective Investigation into Cancer and Nutrition cohort revealed a strong correlation between olive oil consumption and circulating oleic acid( Reference Saadatian-Elahi, Slimani and Chajes 19 ). However, data on whole diet approach and circulating fatty acids are limited and have mostly focused on the adherence to a Mediterranean dietary pattern( Reference Feart, Torres and Samieri 21 – Reference Itsiopoulos, Brazionis and Kaimakamis 23 ). To our knowledge, no study has reported on the relationships of dietary patterns in Nordic countries with lipoprotein particle concentration and size and serum fatty acid concentrations in pregnancy affected by obesity and/or previous GDM.
In the present work, we investigated whether higher overall diet quality as evaluated by the adherence to Nordic Nutrition Recommendations (NNR) by using the Healthy Food Intake Index (HFII) is related to improvements in alternative lipid parameters in cardiovascular risk assessment. The aim was to explore whether higher diet quality is related to less atherogenic serum lipoprotein particle concentrations and sizes and fatty acid concentrations during early and middle pregnancy in Finnish pregnant women with increased risk of GDM.
Methods
Study design and participants
The present study was a sub-study of the randomised controlled Finnish Gestational Diabetes Prevention Study (RADIEL) trial, which was implemented in four maternity hospitals from 2008 to 2014. The main aim of the RADIEL trial was to investigate whether prevention of GDM is possible through lifestyle intervention initiated either before pregnancy or in early pregnancy (<20 weeks of gestation) among women at increased risk for GDM owing to obesity and/or a history of GDM. The RADIEL trial was conducted according to the guidelines laid down in the Declaration of Helsinki, and all procedures were approved by the Ethics Committees of Helsinki University Central Hospital and the South-Karelia Central Hospital. All participants consented to participate in the study.
In addition to standard visits at the maternity clinics, all women in the RADIEL trial visited a study nurse three times during pregnancy. In addition, women entering the RADIEL trial before pregnancy (n 33 in the present study) participated in the study visits every 3 months before conception. The mean number of pre-pregnancy visits was 2·1 (range 1–4) in the present study. Women in the intervention group received individual dietary and exercise counselling from the study nurse during each study visit and, additionally, participated in a group counselling session with a dietitian after the first study visit. In addition, women with a pre-pregnancy BMI of 30 kg/m2 were instructed to avoid weight gain during the first two trimesters of pregnancy. Dietary goals were to increase the consumption of vegetables, fruits and berries, as well as whole-grain and low-fat dairy products, and to lower the consumption of foods high in sugar. The aim of the exercise counselling was to achieve at least 150 min/week of moderate-intensity exercise. Women in the control group received similar counselling as provided in the standard visits at antenatal clinics. In our previous publication including women entering the RADIEL trial during pregnancy, the incidence of GDM, which was the main outcome of the RADIEL trial, was significantly lower in the intervention group (14 %) compared with the control group (22 %) after adjusting for age, pre-pregnancy BMI, a history of GDM and weeks of gestation (P=0·044)( Reference Koivusalo, Rono and Klemetti 24 ). The RADIEL trial has been registered at clinicaltrials.gov (clinical trial reg. no. NCT01698385). Further details of the design and methods in the RADIEL trial are available in a previous publication( Reference Rono, Stach-Lempinen and Klemetti 25 ).
The inclusion criteria were age ≥18 years, a history of GDM and/or pre-pregnancy BMI of ≥30 kg/m2. The exclusion criteria of the present study were similar to those reported in our previous publication( Reference Koivusalo, Rono and Klemetti 24 ): T2D diagnosed before pregnancy, diagnosis of GDM in the first trimester of pregnancy (<20 weeks of gestation), physical disability, use of medication that influences glucose metabolism, multiple pregnancy, notable difficulty in co-operation (such as insufficient language skills), current substance abuse and severe psychiatric disorder. In addition, participants with no study visits during gestation (pre-pregnant women), no pregnancy within a year after recruitment (pre-pregnant women), and incomplete oral glucose tolerance test (OGTT), metabolic and/or dietary data in the first and/or second trimesters of pregnancy were excluded from this study. Diagnosis of GDM was based on at least one pathological plasma glucose value in a 2-h 75-g OGTT, and the thresholds were based on the values standardised by the American Diabetes Association (ADA): fasting plasma glucose, ≥5·3 mmol/l; 1-h glucose, ≥10·0 mmol/l; and/or 2-h glucose, ≥8·6 mmol/l( 26 ). T2D before pregnancy was diagnosed based on the following criteria: fasting plasma glucose ≥7·0 mmol/l and glycated Hb (HbA1c) ≥48 mmol/l, or 2-h plasma glucose ≥11·1 mmol/l in a 75-g OGTT. According to ADA criteria, one pathologic value is sufficient for T2D diagnosis( 27 ). However, in the absence of unequivocal hyperglycaemia, results should be confirmed by repeat testing. As only part of the T2D cases may be recognised based on either fasting plasma glucose or HbA1c measurement alone( Reference Wang, Lee and Howard 28 ), data from both measurements were required in order to exclude potential T2D in the present study.
None of the participants included in the present study used lipid-lowering medication or other medication influencing lipid metabolism.
In total, 787 women were recruited before or during pregnancy in the RADIEL trial. Overall, 720 pre-pregnant and pregnant women were randomised into control (n 228) and intervention groups (n 492) in the RADIEL trial, of whom 161 were included in this study after exclusions: dropped out before pregnancy (n 11), no pregnancy within a year after recruitment (n 85), miscarriage or termination of pregnancy (n 17), multiple pregnancies (n 4), incomplete OGTT or HbA1c data in pre-pregnancy (n 29), incomplete OGTT data during pregnancy (n 68), pathologic OGTT in the first trimester of pregnancy (n 192) and incomplete metabolomics (n 131) or dietary index (n 22) data in the first and/or second trimester of pregnancy. The intervention and control groups, as well as women recruited before and during pregnancy, were combined to assess the relationships between the HFII and serum lipoprotein particles and serum fatty acids in pregnancy. Women who entered the RADIEL trial before pregnancy were followed up during pregnancy similarly to those who entered the RADIEL trial when pregnant. The data collection at the study visits was therefore performed in each trimester of pregnancy for all women in the RADIEL trial. In the present study, the participants were followed up from the first (6–17 weeks of gestation) to the second (20–27 weeks of gestation) trimester of pregnancy. The first trimester is considered as baseline henceforth.
Baseline characteristics
Baseline data of the present study refer to the data collected in the first trimester of pregnancy from all women. The data were obtained by means of questionnaires, except for anthropometric, laboratory and dietary data. The questionnaire-based amount of leisure-time physical activity was reported as weekly minutes of exercise that makes one at least slightly out of breath and sweaty. The participants were weighted and blood was drawn by a study nurse at each study visit. Weighing was performed with light clothing and no shoes. A study nurse measured blood pressure from the right arm by using a sphygmomanometer while the participant was sitting. Laboratory measurements were performed in the Helsinki University Hospital laboratory by using the following methods: enzymatic hexokinase assay (Gluco-quant, modular analyser; Roche Diagnostics) for fasting plasma glucose and electrochemiluminescence immunoassay (insulin, modular analyser) for fasting insulin. Energy intakes were estimated on the basis of a 3-d food record by two nutritionists using the food calculation software AivoDiet (Aivo Ltd), which in turn applies the Fineli Finnish Food Composition Database (National Institute for Health and Welfare, Nutrition Unit, Helsinki, Finland). The energy intake across the HFII groups was reported to demonstrate that energy intake was similar across the HFII groups, and that the HFII rather reflects diet quality instead of quantity.
Serum lipid measurements
Fasting blood samples were collected during the study visits in the first and second trimesters of pregnancy. Blood samples were frozen for up to 2 h in blood collection tubes and centrifuged at 2540 relative centrifugal force for 15 min at 4°C. Serum samples were stored at −80°C until analysis. Evaluation of serum lipoprotein particles and serum fatty acids was performed by using a high-throughput serum NMR spectroscopy metabolomics platform (Brainshake Ltd). NMR is a quick, cost-effective and reproducible methodology for metabolic profiling based on molecule-specific signals( Reference Soininen, Kangas and Wurtz 29 ). NMR is established to be suitable for quantification of lipoproteins( Reference Ala-Korpela, Korhonen and Keisala 30 , Reference Mihaleva, van Schalkwijk and de Graaf 31 ), and has been used in numerous epidemiological studies( Reference Inouye, Kettunen and Soininen 32 – Reference Wurtz, Wang and Kangas 35 ). Measurements for lipoprotein particles included fasting concentrations (nmol/l and µmol/l) and size (nm) of VLDL, LDL and HDL particles. A less atherogenic lipoprotein particle profile was defined as lower concentrations and smaller size of VLDL particles, lower concentrations and larger size of LDL particles and higher concentrations and larger size of HDL particles. As small and medium LDL particles are more strongly associated with CVD risk compared with large LDL particles( Reference Williams, Zhao and Marcovina 36 , Reference St-Pierre, Cantin and Dagenais 37 ), larger LDL particle size was considered preferential in the present study. Serum fatty acid profile was reported as the percentage of total fatty acids, and included total n-3 PUFA, total n-6 PUFA, MUFA and SFA. A more favourable serum fatty acid profile was defined as higher proportions of n-3 and n-6 PUFA, and lower proportions of MUFA and SFA. To further assess the relationship between diet quality and lipid metabolism in pregnancy, we also evaluated the serum concentrations of standard lipid parameters including TAG, total cholesterol, LDL-cholesterol and HDL-cholesterol. Methods used to evaluate the concentrations of standard lipid parameters were as follows: enzymatic assay (TAG GPO-PAP, modular analyser) for TAG, enzymatic assay (cholesterol CHOD-PAP, modular analyser) for total cholesterol, enzymatic assay (LDL-cholesterol plus 2nd generation, modular analyser) for LDL-cholesterol and enzymatic assay (HDL-cholesterol plus 3rd generation, modular analyser) for HDL-cholesterol. Changes in the lipid parameters were determined as subtracting the value in the first trimester from the value in the second trimester.
Dietary measurements
Diet quality was assessed by the adherence to the NNR by using the validated HFII based on a forty-eight-item FFQ used in the RADIEL trial. The FFQ was collected during the first- and second-trimester study visits. The HFII was created to assess the adherence to the NNR( 38 ) and the overall diet quality. Foods selected from the FFQ were further combined into eleven food groups: low-fat milk (≤1 % fat), low-fat cheese (≤17 % fat), vegetables and legumes, fruits and berries, whole grain (includes rye bread, porridge and brown rice and pasta), fish, snacks (includes candy, chocolate, pastries, chips and ice cream), fast food (includes hamburger and pizza), sugar-sweetened beverages (includes sugar-sweetened juice and soft drinks), fat spread and cooking fat. Maximum score for each food group was either 1 or 2 based on the relevance in the overall diet quality. The eleven food groups were scored as follows: low-fat milk, 0–2; low-fat cheese, 0–1; vegetables and legumes, 0–2; fruits and berries, 0–1; whole grain, 0–2; fish, 0 or 2; snacks, 0–2; fast food, 0–1; sugar-sweetened beverages, 0–1; fat spread, 0–2; and cooking fat, 0–1. The scoring for fat spread was as follows: margarine or low-fat margarine, 2 points; sterol margarine, 1 point; butter, butter–oil mix or no spreadable fat, 0 points. The scoring for cooking fat was as follows: vegetable oil (such as rapeseed and olive oil), margarine, liquid margarine or no cooking fat, 1 point; butter, butter–oil mix or baking margarine, 0 points. As a result, total HFII score ranged between 0 and 17 points, with higher total score indicating higher diet quality. Further details of the development, scoring and validation of the HFII are reported in a previous publication( Reference Meinila, Valkama and Koivusalo 39 ) in which validation against 3-d food records showed that the HFII is valid for ranking pregnant participants according to adherence to the NNR. Change in the HFII was determined by subtracting the HFII score in the first trimester from the HFII score in the second trimester.
Statistical analyses
The participants were stratified into three groups according to the HFII score in the first trimester of pregnancy by using z cut-off limits at ±1sd from the mean. Similar categorisation has been used in our previous validation study( Reference Meinila, Valkama and Koivusalo 39 ). Differences between the HFII groups at baseline were analysed by using one-way ANOVA and χ 2 test. Linearity between HFII groups was evaluated by ANOVA and ANCOVA. Covariates for analyses were selected based on previous literature: gestational age at blood collection, BMI, age, years of education and physical activity. In addition, further adjustments for allocation group, study group and gestational weight gain were performed. The study group referred to women who entered the RADIEL trial either before pregnancy or during pregnancy. In all, four analytical models were performed: unadjusted model (model 1); a model adjusted for age, BMI, gestational age and years of education (model 2); a model adjusted for the covariates in model 2 and physical activity (model 3); and a model adjusted for the covariates in model 2, the allocation group and the study group (model 4). Gestational weight gain was included in model 4 as a covariate in the analyses for change in the HFII and change in lipid parameters. Residual change from the first to the second trimester of the HFII score and serum lipoprotein particles and serum fatty acids were calculated by regressing the second-trimester values onto the first-trimester values. Residual change represents the amount of change that is independent of the baseline value. Correlations between residual changes in the HFII score and residual changes in the serum lipid parameters were performed with Pearson’s correlation coefficients. Multivariate linear regression analyses were also performed to evaluate the association between residual changes in the HFII and residual changes in lipid parameters. Results of adjusting for physical activity were reported separately as the physical activity data at baseline were available only for 145 women. The normality of the variables was tested by using the Shapiro–Wilk W-test. The bootstrap method was used in case of unknown theoretical distribution of the test statistics or violation of the assumptions (e.g. non-normality). Effect size was calculated by using the method of Cohen( Reference Cohen 40 ). Stata 14.1 (StataCorp LP) was used for the analysis. P value <0·05 was considered significant.
Results
Baseline characteristics
At baseline, the mean HFII score was 9·9 (sd 3·0) points, and the mean gestational age was 13·1 (sd 1·6) weeks. Out of 161 participants included, 129 (80 %) were overweight or obese. The prevalence of a history of GDM (P=0·015) and years of education (P=0·045) showed positive linearity, whereas total fat intake showed negative linearity (P=0·028) across the HFII groups (Table 1).
Table 1 Baseline characteristics according to the Healthy Food Intake Index (HFII) score in the first trimester of pregnancy (Mean values and standard deviations; numbers and percentages; medians and interquartile ranges (IQR))
OGTT, oral glucose tolerance test; E%, percentage from total energy intake.
* Linearity across the HFII groups. ANOVA for continuous variables and Cochran–Armitage test for trend for categorical variables.
Overall, thirty-three (20 %) women developed GDM during the follow-up from the first to the second trimester of pregnancy. Mean baseline BMI was lower in women with GDM, 28·4 (sd 6·4) kg/m2, compared with women without GDM, 31·6 (sd 5·2) kg/m2 (P=0·004). The prevalence of a history of GDM was higher among women with GDM compared with women without GDM (70 v. 36 %, P<0·001). According to the allocation group, eighteen (25 %) women in the control group and fifteen (17 %) women in the intervention group developed GDM during the study follow-up (P=0·234). From those who entered the RADIEL trial before pregnancy, six (18 %) women developed GDM, and from those who entered the RADIEL trial during pregnancy twenty-seven (21 %) women developed GDM during the follow-up (P=0·712).
Linearity between the Healthy Food Intake Index score and serum lipoprotein particles and serum fatty acids at baseline
Baseline concentrations and sizes of serum lipoprotein particles and proportions of serum fatty acids in different HFII groups are presented in Table 2. The HFII score was inversely related to HDL particle concentrations before and after adjustments (Table 2). The proportions of n-3 (P<0·001) and n-6 (P=0·003) PUFA were positively related and that of MUFA (P=0·010) was inversely related to the HFII score. After adjustments, the results for n-6 and n-3 PUFA remained significant, except for n-3 PUFA when adjusting by physical activity, whereas the results for MUFA were no longer significant (Table 2). Moreover, the HFII score showed an inverse relationship with proportions of SFA after adjustments, except when adjusted for the allocation and the study group (Table 2). No other relationships between the HFII score and lipoprotein particles or serum fatty acids were observed at baseline. Interaction analysis showed non-significant interactions between the HFII and GDM for lipid parameters, indicating that diet–lipid relationships were not influenced by GDM status.
Table 2 Baseline serum lipoprotein particle and serum fatty acid profiles across the Healthy Food Intake Index (HFII) groups in the first trimester of pregnancy (n 161) (Mean values and standard deviations)
* Model 1: unadjusted. Linearity across the HFII groups was tested by using ANOVA and ANCOVA.
† Model 2: adjusted for age, BMI, years of education and gestational age. Linearity across the HFII groups was tested by using ANOVA and ANCOVA.
‡ Model 3: adjusted for age, BMI, years of education, gestational age and physical activity (n 145). Linearity across the HFII groups was tested by using ANOVA and ANCOVA.
§ Model 4: adjusted for age, BMI, years of education, gestational age, the allocation group and the study group (time when the participant entered the Finnish Gestational Diabetes Prevention Study trial; before or during pregnancy). Linearity across the HFII groups was tested by using ANOVA and ANCOVA.
Correlations between changes in the HFII score and changes in serum lipoprotein particles and serum fatty acids
The mean follow-up time and change in the HFII score from the first to the second trimester were 10·3 (sd 1·9) weeks and 0·22 (sd 2·23) points, respectively. Correlations between changes in the HFII and changes in serum concentrations and sizes of lipoprotein particles are shown in Fig. 1. Changes in the HFII score were inversely correlated with changes in VLDL particle size (r −0·16, 95 % CI −0·31, −0·01). In adjusted models, this correlation remained similar (model 2: r −0·15, 95 % CI −0·29, −0·01; model 3: r −0·17, 95 % CI −0·32, −0·01), except in model 4 in which the correlation was slightly attenuated (r −0·15, 95 % CI −0·30, 0·00). No other correlations were observed between changes in the HFII score and changes in lipoprotein particle concentrations and sizes. Correlations between changes in the HFII score and changes in proportions of serum fatty acids are shown in Fig. 2. Changes in the proportions of n-6 PUFA were positively correlated (r 0·16, 95 % CI 0·01, 0·31) and those of MUFA were inversely correlated (r −0·17, 95 % CI −0·31, −0·01) with changes in the HFII score. The results remained significant for both n-6 PUFA and MUFA after adjustments (data not shown). The effects sizes were rather small for all significant effects. Similarly, in multivariate linear regression models, the HFII change was linearly associated with n-6 PUFA change and inversely associated with MUFA change (online Supplementary Table S1). The association between change in the HFII and change in VLDL particle size was only slightly attenuated after further adjustments (P=0·05) (model 4, online Supplementary Table S1). Moreover, change in standard lipid parameters showed no association with change in the HFII before and after adjustments (online Supplementary Tables S2 and S3).
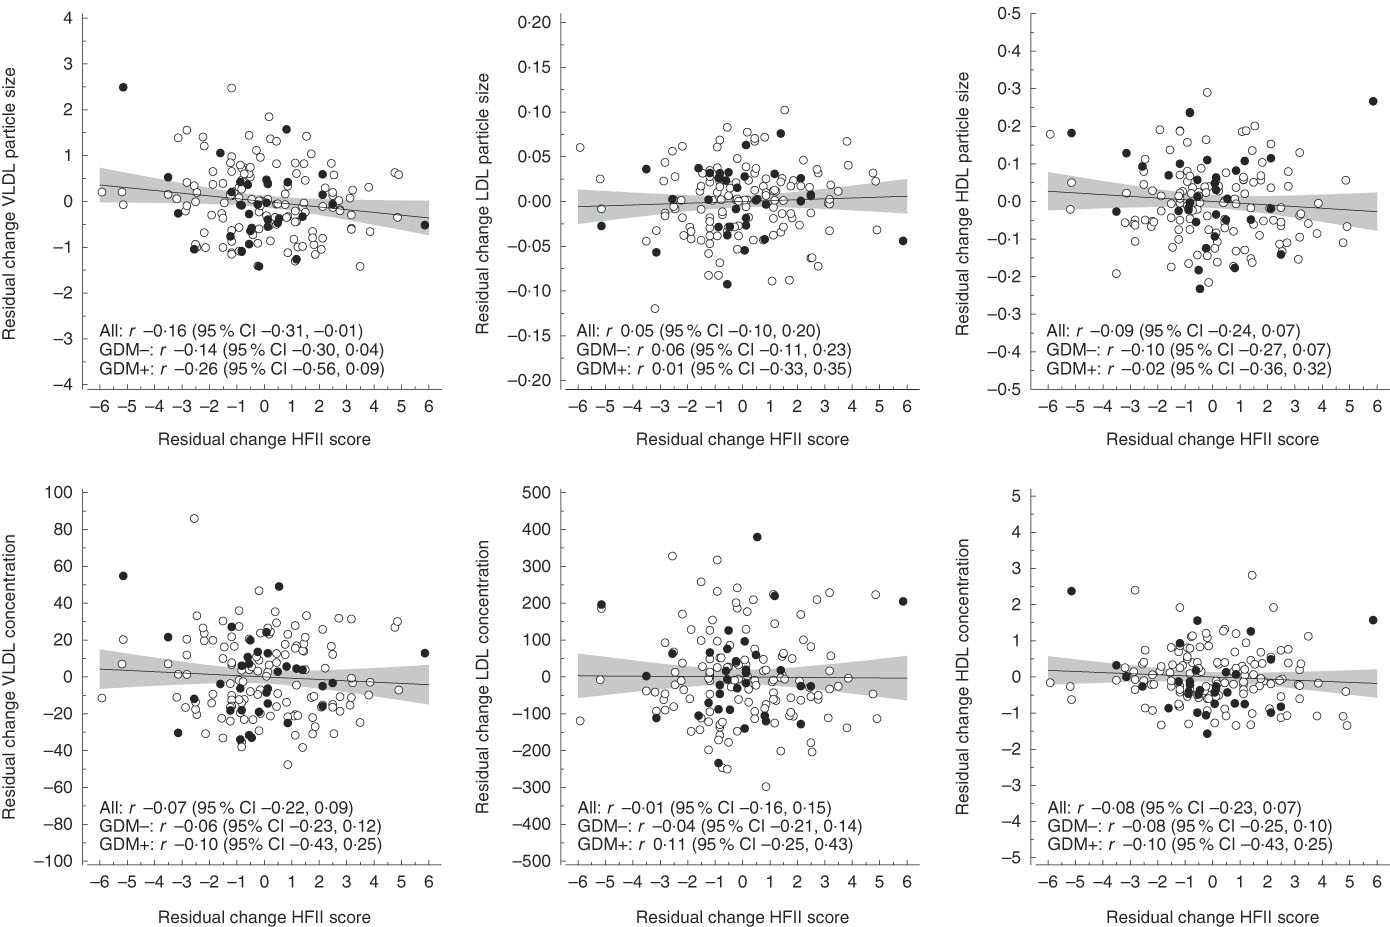
Fig. 1 Correlations between residual changes in the Healthy Food Intake Index (HFII) score and residual changes in serum lipoprotein particle concentration and size. The lines represent estimated linear regression with 95 % CI. GDM, gestational diabetes mellitus.
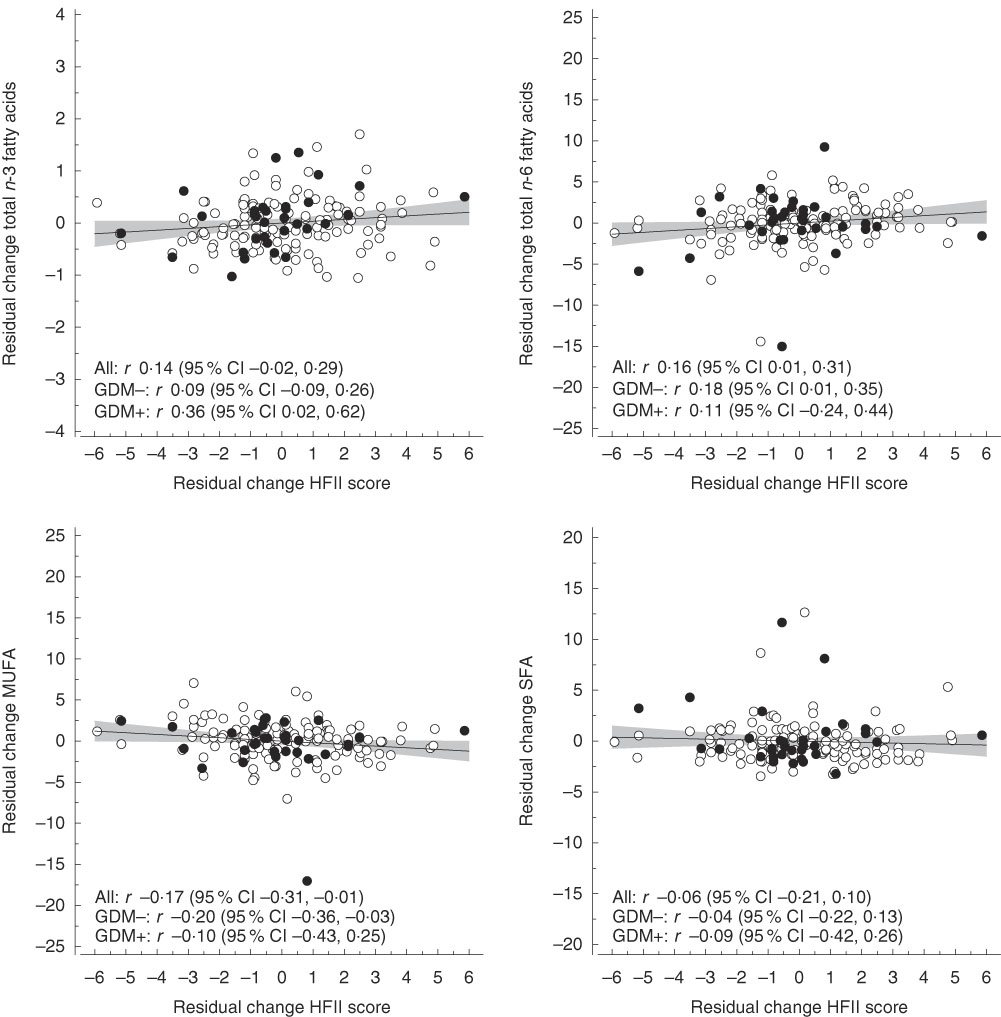
Fig. 2 Correlations between residual changes in the Healthy Food Intake Index (HFII) score and residual changes in proportions (percentage of total fatty acids) of serum fatty acids. The lines represent estimated linear regression with 95 % CI. GDM, gestational diabetes mellitus.
Discussion
The present study explored whether diet quality as assessed by the adherence to the NNR based on the food-based HFII is related to serum lipoprotein particle concentrations and sizes and with serum fatty acid concentrations in pregnant women at high risk for GDM. Higher HFII score was related to lower concentration of HDL particles, greater proportions of serum n-3 and n-6 PUFA, as well as to lower proportions of serum SFA at baseline. In addition, an increase in the HFII score was related to a decrease in VLDL particle size and proportions of serum MUFA, as well as with increased proportions of serum n-6 PUFA between the first and second trimester of pregnancy. In addition, the results for n-3 PUFA change almost reached a level of statistical significance. To our knowledge, this is the first study to report on the relationships of an overall diet quality based on the adherence to NNR with serum lipoprotein particle concentrations and sizes, as well as serum fatty acid concentrations in Nordic pregnant women affected by obesity and/or prior GDM.
The inverse HDL particle concentration–diet relationship at baseline may partly result from lower total fat content in the diet( Reference Sacks and Katan 41 ), which was also supported by the present findings of an inverse relationship of total fat intake and the HFII score at baseline. Studies on diet and circulating lipids have usually reported on the cholesterol concentration of lipoprotein particles instead of total lipoprotein particle concentrations. Some of these studies have shown similar results for HDL-cholesterol as the present findings for HDL particle concentration. In a meta-analysis including three cross-sectional Finnish studies, an inverse association was observed for HDL-cholesterol concentration and adherence to a healthy Nordic diet( Reference Kanerva, Kaartinen and Rissanen 42 ). Furthermore, findings from observational data on the relationship between higher adherence to a healthy dietary pattern and lower HDL-cholesterol concentrations are supported by those from dietary intervention studies. For instance, after a 6-week healthy Nordic diet, plasma HDL-cholesterol was reduced by 5 % compared with the control diet in hypercholesterolaemic Swedish participants( Reference Adamsson, Reumark and Fredriksson 43 ). In addition, in a clinical trial in healthy men and women, the 3-week Dietary Approaches to Stop Hypertension (DASH) diet resulted in reduced concentrations of plasma HDL-cholesterol( Reference Chiu, Bergeron and Williams 44 ). However, no effect was observed on plasma HDL particle concentrations after the DASH diet intervention. With regard to change in lipoprotein parameters, improvement in the HFII score was significantly yet weakly correlated with reduced VLDL particle size, and the correlation was only slightly attenuated in the maximum-adjusted model. Larger VLDL particles carry more TAG than smaller VLDL particles and are associated with increased insulin resistance and a higher T2D risk( Reference Festa, Williams and Hanley 8 , Reference Garvey, Kwon and Zheng 9 ). Some studies suggest that higher fish intake may play a role in modification of VLDL particle size. A 4-week lean-seafood intervention compared with non-seafood intervention resulted in reduced VLDL particle size in non-pregnant, healthy Norwegian population( Reference Aadland, Lavigne and Graff 17 ). In addition, higher fish intake and a higher serum DHA to total fatty acid ratio (a biomarker of fish intake) were linked to reduced VLDL particle size, whereas higher intake of junk food, such as French fries, salty snacks and sweets, was related to increased VLDL particle size in a cross-sectional study of young adult Finnish twins( Reference Bogl, Pietilainen and Rissanen 45 ). Similar to the above-mentioned findings for fish intake, higher n-3 PUFA intake was associated with lower concentrations of large VLDL particles and smaller VLDL particle mean size among Alaska Eskimos at increased risk for CVD( Reference Annuzzi, Rivellese and Wang 46 ). Potential mechanisms underlying the inverse association observed between diet and VLDL particle size go beyond the scope of the present study. However, in the literature focusing on n-3 PUFA intakes, it has been proposed that n-3 PUFA may modify VLDL particle size by enhancing the expression of lipoprotein lipase resulting in increased removal of TAG from the VLDL particles and further conversion to smaller VLDL particles and eventually to LDL particles( Reference Annuzzi, Rivellese and Wang 46 , Reference Dias, Amigo and Wood 47 ). On the other hand, in the present study, improvements in the HFII showed no association with change in LDL concentrations.
The rather weak relationships observed between lipoprotein particles and diet suggest that the role of diet is rather small and other factors than diet probably have more influence on maternal lipoprotein particle concentrations and sizes. For instance, pregnancy itself affects lipoproteins leading to a more atherogenic lipoprotein profile, such as decreased size of LDL particles and elevated VLDL particle concentrations( Reference Hubel, Shakir and Gallaher 48 , Reference Sattar, Greer and Louden 49 ). Further, certain factors may contribute to the lipid response to dietary intake. Most of the women in the present study were overweight or obese (80 %). Dietary modifications such as adherence to low-SFA and low-cholesterol diets to improve serum lipid profile seem to be less effective in obese individuals compared with lean individuals, indicating that higher adiposity may attenuate the lipid response to dietary intake( Reference Flock, Green and Kris-Etherton 50 ). One mechanism for this might be obesity-related low-grade chronic inflammation, which results in increased insulin resistance( Reference Flock, Green and Kris-Etherton 50 ). Furthermore, the possible negative influence of insulin resistance on lipid response may be exaggerated during pregnancy. Another factor influencing circulating lipid response to diet is genetic polymorphism. For instance, the replacement of diet rich in carbohydrate with a diet rich in MUFA resulted in opposite effects on LDL particle size depending on the genotype of apoE in healthy young adults( Reference Moreno, Perez-Jimenez and Marin 51 ). Similarly, higher saturated fat intake has been associated with either smaller or larger LDL particle size depending on the apoE genotype in Costa Rican men and women( Reference Campos, D’Agostino and Ordovas 52 ). apoE is an important structural component in TAG-rich lipoprotein particles such as VLDL particles, as well as in HDL particles. Other frequently studied genetic factors influencing lipid response to diet are genetic polymorphisms in apoA4, apoB and lipoprotein lipase( Reference Ordovas 53 ). In addition, other factors contributing to lipid metabolism, but not included in the present study, may have influenced the findings.
The overall findings on serum fatty acids indicate that higher quality of diet as measured by the adherence to the NNR by using the HFII is related to a more favourable serum fatty acid profile in pregnant women at high risk for GDM. The significant results for n-6 PUFA change and non-significant results for n-3 PUFA change may in part arise from too small changes n-3 PUFA to show significant relationships, competition between n-6 and n-3 PUFA in physiologic processes, and the abundance of n-6 PUFA compared with n-3 PUFA in the western diet( Reference Simopoulos, Leaf and Salem 54 , Reference Hibbeln, Nieminen and Blasbalg 55 ). Furthermore, in addition to dietary intake, the proportions of n-3 and n-6 PUFA are also influenced by the enzyme activity of desaturases and elongases( Reference Hodson, Skeaff and Fielding 56 ).
Lower proportions of MUFA were considered favourable in the present study, as elevated circulating MUFA concentrations have been associated with a higher risk of cardiovascular event( Reference Wurtz, Havulinna and Soininen 12 ) and T2D( Reference Mahendran, Cederberg and Vangipurapu 33 ) in non-pregnant populations. On the other hand, a recent meta-analysis including prospective observational studies reported non-significant findings of the relationship between circulating MUFA and cardiovascular health( Reference Chowdhury, Warnakula and Kunutsor 57 ). With regard to dietary MUFA, data from the Nurses’ Health Study revealed an inverse relationship between MUFA intake and CVD mortality( Reference Wang, Li and Chiuve 58 ). Furthermore, in the Prevención con Dieta Mediterránea trial, the adherence to a Mediterranean diet enriched with either extra virgin olive oil or nuts, both of which are high in MUFA, showed beneficial effects on cardiovascular health in a population at CVD risk( Reference Estruch, Ros and Salas-Salvado 59 ). Further, in a pooled analysis of eleven cohort studies, substituting dietary MUFA for SFA was not associated with risk for CHD( Reference Jakobsen, O’Reilly and Heitmann 60 ). Overall, the evidence on circulating and dietary MUFA in relation to cardiovascular health is still inconsistent, which may partly arise from differences in the study design and populations, the endogenous MUFA synthesis, as well as different dietary sources of MUFA, namely animal- and plant-based sources. The expected inverse relationship between the HFII change and serum MUFA change is probably a consequence of that circulating MUFA derive from desaturation of dietary SFA( Reference Mahendran, Cederberg and Vangipurapu 33 ). Similarly, the endogenous synthesis of SFA may partly explain the non-significant findings regarding the SFA change.
The HFII has been previously validated against 3-d food records( Reference Meinila, Valkama and Koivusalo 39 ), which showed similar associations on dietary fatty acid intake as the corresponding serum fatty acids in the present study. The only exception was the positive association between MUFA intake (reported as percentage of total fatty acids) and the HFII observed in the validation study. The present study including serum concentrations of dietary fatty acids provides further validation for the HFII as a tool for dietary intake assessment. Traditional dietary measurement techniques are based on recording or recalling of the food intake, and thus these methods are susceptible to errors such as intentional under-reporting and dietary alterations during the recording days( Reference Hodson, Skeaff and Fielding 56 ). Therefore, the use of different biomarkers as a measure of dietary intake and nutrient status and as a predictor of disease risk provides a more accurate and objective approach to diet–disease associations( Reference Jenab, Slimani and Bictash 61 ).
Strengths of the present study were detailed serum lipoprotein particle and serum fatty acid measurements in two different time points and the whole diet approach. Exploring the whole diet may improve understanding of the dietary influence in cardiovascular health, and the findings are transferable to public health recommendations and usable in clinical practice.
The present study has some limitations. The associations observed between the HFII and serum lipids were rather weak and must be considered with caution. In addition, the sample size may not have been sufficient to meet the requirements of statistical power. With regard to circulating MUFA, NMR measures the concentrations of both, palmitoleic acid (16 : 1) and oleic acid (18 : 1), and is unable to differentiate these subclasses. From dietary point of view, dietary palmitoleic and oleic acids may have opposite relationship with cardiovascular health( Reference Nestel, Clifton and Noakes 62 ). However, owing to the endogenous synthesis( Reference Wurtz, Havulinna and Soininen 12 ), circulating MUFA concentration is an inaccurate biomarker of dietary MUFA intake. In addition, the self-reported amount of weekly physical activity may have caused measurement bias. Furthermore, the dietary index used may not reflect all the dietary components and intakes that may influence circulating lipoprotein particle and fatty acid metabolism. For instance, the HFII was lacking a category of red and processed meat as different types of meat were not specified in the original version of the FFQ. Higher intake of red and processed meat has been associated with increased risk of T2D, CVD and GDM( Reference Zhang, Schulze and Solomon 63 – Reference Wang, Lin and Ouyang 66 ). Thus, inclusion of this food group could have improved the HFII as a tool for assessing dietary intake and diet–circulating lipid relationships. Furthermore, the reported SD for change in the HFII score was rather high, 2·23, indicating wide variation from the mean change among the participants. These results can only be generalised to Caucasian pregnant women affected by obesity and/or a history of GDM. In addition, the results are based on Nordic pregnant population and may be different in other pregnant populations with different dietary culture and genetics.
In conclusion, higher diet quality as assessed by the adherence to NNR by using the HFII was related to a more favourable serum fatty acid profile, whereas the relationship with serum lipoproteins was limited in pregnant women at increased GDM risk. Overall, the findings suggest that the role of diet is rather small and other factors probably have greater importance in lipoprotein particle profiles during pregnancy. High-quality studies in pregnant women are needed to better understand the possibilities of dietary modification in improving maternal lipoprotein and fatty acid profiles and, by that means, in reducing the risk of pregnancy complications and future disease in the mother and the offspring. Moreover, studies on the factors influencing maternal circulating lipid response to dietary intake are required.
Acknowledgements
The authors thank all the participants for participating in the study, as well as the study personnel for contributing to the implementation of the study.
This study was a part of the RADIEL trial. The RADIEL trial was supported by Jalmari and Rauha Ahokas Foundation (J. G. E.), The Finnish Diabetes Research Foundation (J. G. E.), State Provincial Office of Southern Finland (J. G. E.), special state subsidy for health science research of Helsinki University Central Hospital (J. G. E.), Finnish Foundation for Cardiovascular Disease (J. G. E.), Samfundet Folkhälsan (J. G. E.), the Social Insurance Institution of Finland and the Academy of Finland (J. G. E.) (grant no. 129369, 129907, 135072, 129255 and 126775). The study resulting in these results has received funding from the European Commission within the 7th Framework Programme (DORIAN, grant agreement no. 278603) and EU H2020-PHC-2014-DynaHealth (grant no. 633595). The funders had no role in the design, analysis or writing of this article.
A. J. V., J. M. M., S. B. K., J. L., K. R., B. S.-L. and J. G. E. contributed to the design and implementation of the study; A. J. V. performed the statistical analyses, interpreted the results and wrote the first version of the manuscript; all authors read and approved the final version of the manuscript.
The authors declare that there are no conflicts of interest.
Supplementary material
For supplementary material/s referred to in this article, please visit https://doi.org/10.1017/S0007114518002404


