


Coffee is one of the most popular beverages worldwide, and the investigation of the association between coffee consumption and incidence of various diseases has important public health implications. A growing body of evidence from epidemiological studies suggests that coffee consumption is beneficial and inversely associated with the risk of developing chronic diseases( Reference Cano-Marquina, Tarin and Cano 1 – Reference Dorea and da Costa 3 ). Recently, a number of prospective studies reported a negative association between high coffee consumption (>3 cups/d) and risk of type 2 diabetes mellitus (T2DM)( Reference Bhupathiraju, Pan and Manson 4 – Reference Jiang, Zhang and Jiang 6 ). In one study, participants who drank three to four cups of coffee per day had an approximately 25 % lower risk of developing T2DM than those who did not drink coffee, or drank less than two cups per day( Reference Ding, Bhupathiraju and Chen 5 ). Moreover, a recent meta-analysis reported that every two-cup increase in regular or decaffeinated coffee intake per day correlated with, respectively, 12 and 11 % decreases in T2DM incidence( Reference Jiang, Zhang and Jiang 6 ). Coffee is a mixture of many components, including vitamins, minerals and bioactive compounds (caffeine, chlorogenic acids (CGA), trigonelline and diterpenes, among others), which may have different effects on glucose metabolism( Reference Ludwig, Clifford and Lean 7 – Reference Liang and Kitts 9 ). Thus, the protective effects of coffee on T2DM may involve different mechanisms such as those affecting intestinal glucose absorption, glucose metabolism, and antioxidant and inflammatory activities( Reference Akash, Rehman and Chen 10 ).
Few studies have addressed the mechanisms underlying the effects of coffee on T2DM risk( Reference Cano-Marquina, Tarin and Cano 1 , Reference Natella and Scaccini 11 ). Their results indicated that coffee (regular or decaffeinated) decreases the postprandial glycaemic response compared with caffeine alone or water, with a neutral or reduced effect in serum insulin levels and improved insulin sensitivity (Si) index( Reference Cano-Marquina, Tarin and Cano 1 , Reference Natella and Scaccini 11 ). This suggests that the effects of coffee on glucose homoeostasis may depend on or are balanced by its non-caffeine constituents, such as CGA or trigonelline( Reference Natella and Scaccini 11 , Reference Casal and Rebelo 12 ). In Brazil and other countries, regular coffee is mainly consumed with sugar, but the effect of this coffee preparation is rarely examined and its impact on glycaemic response is not well described( Reference Louie, Atkinson and Petocz 13 ). Accordingly, the aim of this study was to investigate the effects of consuming regular (containing caffeine) and decaffeinated coffee, and study the effect of regular coffee with sugar on glucose metabolism parameters and incretin hormones in healthy men. We thus used a stable isotope minimal model protocol with oral glucose dose – Oral Dose Intravenous Label Experiment (ODILE). The ODILE has been previously validated against the euglycaemic hyperinsulinaemic clamp( Reference Bluck, Williams and Jackson 14 ), providing rigorous estimates of glucose metabolism under realistic physiological conditions. Therefore, this study tested two hypotheses: (a) whether regular and decaffeinated coffee improves Si and increases incretin levels, and (b) whether adding sugar to regular coffee imposes a high response of glycaemia and insulinaemia.
Methods
Participants
Study subjects were recruited through public advertisements in the University of Brasilia, Brazil from February 2013 to June 2014. Subjects were all male, aged 18–40 years, with BMI between 18·5 and 25·0 kg/m2, habitual breakfast consumers (≥418 kJ (≥100 kcal) ingested within 2h of waking up ≥4 d/week) and habitual coffee consumers (≥100 ml at least five times/week). They had limited body weight fluctuation in the past 3 months (<5 kg), no self-reported sleep disorders, and were not taking medications. Subjects were excluded if they suffered from diabetes mellitus, cardiovascular diseases, hypothyroidism, anaemia and clotting disorders, or had a history of fainting and/or convulsions, smoking or blood donation in the last 3 months, or a total consumption of more than 4·5 cups of coffee per d( Reference Sousa and da Costa 15 ).
Literature containing the information we needed to carry out a sample size calculation( Reference Bluck, Williams and Jackson 14 , Reference Aston, Bluck and Stokes 16 ) was scarce. Information about Si and the expected effect size that we wanted to detect was derived from our earlier research( Reference Bluck, Williams and Jackson 14 ). We used G*Power v 3.1.9.2 (http://www.gpower.hhu.de/en.html) to calculate the sample size that would result in power of at least 80 % to detect a treatment difference of 0·01 litre/pmol per h with 95 % confidence, where the standard deviation of the difference (SD) between treatment means is 0·0126. The SD is computed as the square root of the sum of the between person variance equal to 0·004litre/pmol per h minus twice the covariance between treatment means, to account for the fact that the comparisons were carried out within individual. We assumed a correlation of 0·8 for measurements obtained on the same person. With these input parameters, G*Power estimated an effect size of 0·8 and a sample size equal to fifteen persons.
Initially, seventy-eight men responded to the announcement, twenty-six of whom completed the first screening visit. Of those, twenty were selected to complete the second screening visit and were eligible for the study. In all, seventeen subjects met all eligibility criteria and completed the study protocol (Fig. 1). Dropouts were offset by over-recruiting and extra subjects were assigned to experimental sessions according to the William square sequence.
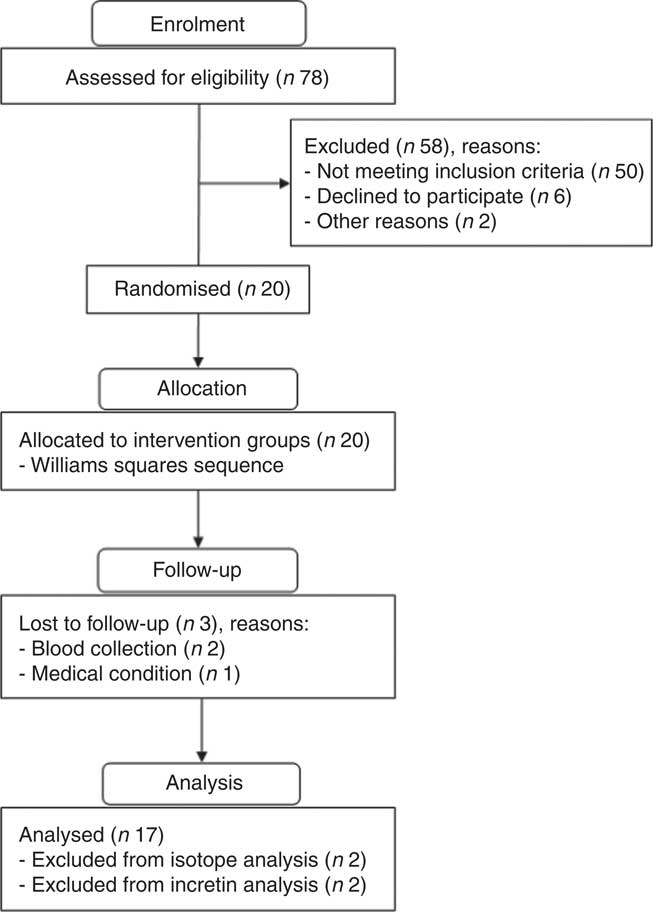
Fig. 1 Flow chart for screening and enrolment of study participants.
Study design
This randomised cross-over single-blind clinical trial required subjects to complete five experimental sessions, in which they consumed either regular coffee, regular coffee with sugar, decaffeinated coffee or two controls – water with sugar or water alone, followed by an ODILE test 1 h after consumption( Reference Bluck, Clapperton and Coward 17 ). The principal researchers were blinded to all experimental treatments. Subjects were randomised into one of ten treatment sequences, constructed using a Williams square design. The Williams design ensures that every sequence of treatment follows every other treatment once, balancing any treatment effect at the subsequent experimental session. The first sequence was randomly assigned to the first subject and subsequent sequences assigned to each subject enrolled in the study. The sequence was restarted with the eleventh subject and followed sequentially. The treatment sequences constructed with the Williams design were given as( Reference Wang, Wang and Gong 18 ):
 $$\matrix{ {{\rm A}\:\;{\rm B}\;{\rm E}\;{\rm C}\;{\rm D};} \hfill & {{\rm B}\;{\rm C}\;{\rm A}\;{\rm D}\;{\rm E};} \hfill & {{\rm C}\;{\rm D}\;{\rm B}\;{\rm E}\;{\rm A};} \hfill & {{\rm D}\;{\rm E}\;{\rm C}\;{\rm A}\;{\rm B};} \hfill & {{\rm E}\;{\rm A}\;{\rm D}\;{\rm B}\;{\rm C};} \hfill \cr {{\rm D}\;{\rm C}\;{\rm E}\;{\rm B}\;{\rm A};} \hfill & {{\rm E}\;{\rm D}\;{\rm A}\;{\rm C}\;{\rm B};} \hfill & {{\rm A}\;{\rm E}\;{\rm B}\;{\rm D}\;{\rm C};} \hfill & {{\rm B}\;{\rm A}\;{\rm C}\;{\rm E}\;{\rm D};} \hfill & {{\rm C}\;{\rm B}\;{\rm D}\;{\rm A}\;{\rm E};} \hfill \cr } $$
where A is the regular coffee with sugar, B the regular coffee, C the decaffeinated coffee, D the water with sugar and E the water. A single researcher (T. H. M. C.) was responsible for assigning each participant to the respective treatment sequence and supervising beverage preparation.
Subjects were instructed to refrain from consuming coffee, caffeine and alcohol, and also from practicing any non-habitual physical activity for 24 h before the sessions. In addition, participants were instructed to consume a low-carbohydrate meal (about 38–40 % of energy in the form of carbohydrates) in the evening before the experimental sessions.
The study protocol was approved by the Human Research Ethics Committee of the School of Health Sciences at the University of Brasília (no. 050/2012). All volunteers were informed about the study protocol and provided written informed consent.
Experimental protocol
Subjects fasted for 12 h overnight prior to arriving between 07.00 and 09.00 hours on each experimental day and capillary glucose, height, body weight, waist circumference, body composition, blood pressure and complete blood count were measured. Before the first trial, subjects also answered questionnaires based on the recruitment criteria and coffee intake. In each experimental session, body weight, capillary fasting glucose, the number of hours slept in the previous night, coffee and caffeine intake and the time and composition of the dinner were recorded. Blood glucose was measured with a glucometer (Accu-check Performa; Roche Diagnostics) to confirm that subjects were fasting (glucose <5·5 mmol/l).
On each experimental day, a cannula was inserted into the antecubital veins of each forearm, one for [1-13C]glucose administration and the other for blood collection. After a 10-min resting period, basal blood samples were drawn at −10 and at 0 min – just before test beverage intake. The subjects then consumed the test beverage assigned according to the sequence in the Williams square design. Regular and decaffeinated roasted and ground coffee (brewed by drip filtering) provided caffeine to the participants at 1·4–2·0 and 0·24–0·33 (mg/kg body weight), respectively (online Electronic Supplementary Material – coffee brand selection and preparation). Blood samples were taken 30 and 60 min after beverage intake. Immediately after the 60-min sample, 75 g of glucose (Gluc UP 75; Newprov) dissolved in 300 ml of water was orally administered (oral glucose load). In all, twenty-three blood samples were taken at 75, 90, 105, 107, 109, 111, 113, 115, 117, 119, 121, 125, 130, 135, 140, 145, 150, 160, 175, 195, 225, 255 and 285 min after test beverage intake. Immediately after the 105-min sample (45 min after the oral glucose load), a 250-mg intravenous bolus of pyrogen-free [1-13C]glucose (Cambridge Isotope Laboratories) was administered through the contralateral arm. The cannula was then removed to prevent blood from being drawn at the site of isotope infusion. After each blood collection, the sample tubes were kept at room temperature to enable clotting for 30 min, centrifuged, and serum samples stored at −80°C until analysis. The experimental design is presented in Fig. 2. The washout period between study sessions increased after the third session to ensure hematopoietic recovery.
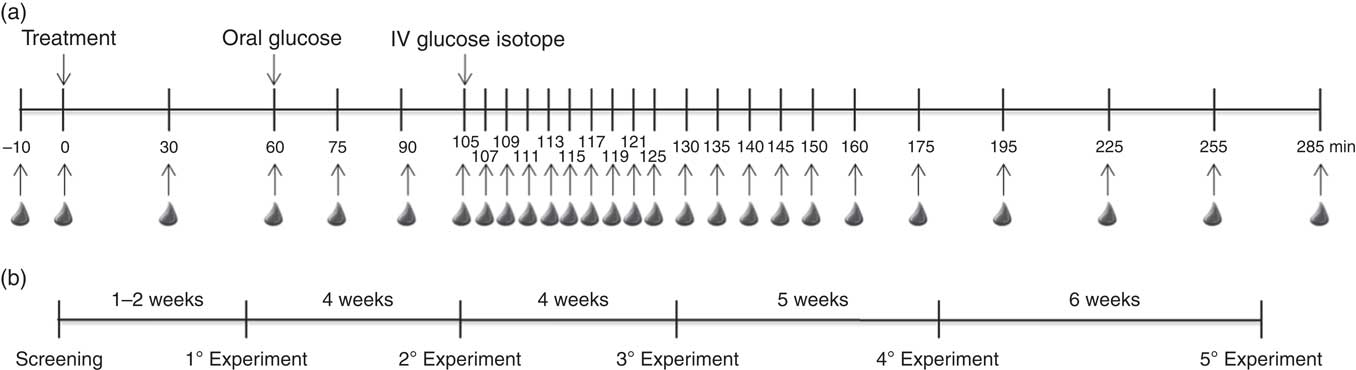
Fig. 2 Schematic representation of the experimental design (a) and washout periods between experimental sessions (b). IV, intravenous.
During the experimental sessions, subjects rested comfortably on a bed. Subjects were allowed to read, listen to music, watch TV, use a notebook or other portable electronic devices, and walk around the laboratory to use the toilet, but not allowed to eat or drink (except water).
Clinical assessments
Body weight was measured to the nearest 0·1 kg on a 150 kg capacity electronic platform scale (Plenna) and height measured to the nearest 0·1 cm on a stadiometer (Alturaexata) mounted to its own platform. BMI (kg/m2) was computed as the ratio of weight:squared height and classified according to the World Health Organization categories( 19 ). Waist circumference was measured midway between the lowest rib and the iliac crest to the nearest 0·1 cm and classified according to criteria outlined in the Third Report of the National Cholesterol Education Program Expert Panel on Detection, Evaluation, and Treatment of High Blood Cholesterol in Adults( 20 ). Body fat percentage was measured by tetrapolar bioelectrical impedance using a Quantum II body composition analyzer (RJL Systems) according to the protocol described by Lukaski et al.( Reference Lukaski, Bolonchuk and Hall 21 ). Blood pressure was measured by a trained professional( 22 ) by auscultation with a calibrated aneroid sphygmomanometer.
Biochemical measurements
At each blood draw (twenty-seven samples), 4 ml of blood were collected into a serum collection anticoagulant-free vacutainer for glucose, insulin, and [1-13C]glucose analysis. C-peptide concentration was measured at 0, 30, 60, 90, 105, 121, 135, 150, 195 and 285 min, in ten blood samples.
In addition, 1 ml of blood was collected into cooled siliconised tubes containing EDTA and 10 μl of dipeptidyl peptidase-4 inhibitor at 0, 30, 60, 90, 121, 150, 175, 225, 255 and 285 min (ten blood samples) for determination of glucagon-like peptide-1 (GLP-1) and glucose-dependent insulinotropic peptide (GIP) concentrations.
Analytical determinations
Glucose, insulin and C-peptide concentrations were measured by glucose oxidase, electrochemiluminescence and ELISA methods, respectively. Sensitivity of glucose oxidase was 0·12 mmol/l (within-run CV of 0·41 %), insulin immunoassay was 1·39 pmol/l (within-run CV of 1·9 %), and C-peptide ELISA was 0·01665 nmol/l (within-run CV of 3·1 %). The [1-13C] isotopic composition of glucose was determined by GC-combustion-isotope ratio MS (GC/C/IRMS) on a 20–22 isotope ratio mass spectrometer (Sercon Limited) with an Orchid combustion/pyrolysis module (Elemental Microanalysis Ltd) and Agilent 7890B GC gas chromatograph (Agilent Technologies) with a combustion furnace operating at 860°C (within-run CV of 0·8 % and between-run CV of 2·0 %). The ratio of the 44 and 45 Th isotopologues of the generated CO2 was determined using the method of Bluck & Coward( Reference Bluck and Coward 23 ) and these were converted( Reference Clapperton and Bluck 24 , Reference Clapperton, Coward and Bluck 25 ) to tracer/tracee ratios using a derived value for pure tracer of 10121 G for the glucose α-d-glucofuranose cyclic 1, 2 : 3, 5-bis (methyl boronate)-6-trifluoroacetate derivative used in this study( Reference Jackson, Waterhouse and Bluck 26 ). The data obtained from GC/C/IRMS analysis were interpreted by the two-compartment minimal model as implemented by Bluck et al.( Reference Bluck, Clapperton and Coward 17 ). The indices of glucose metabolism parameters obtained from the ODILE test were Si and glucose effectiveness (Sg). GLP-1 and GIP concentrations were measured by ELISA; detection sensitivity was 2 pM for GLP-1 (within-run CV of 7·4 %) and 0·9545 pmol/l for GIP (within-run CV of 6·5 %).
Food intake assessment
The dietary record of the evening meal prior to testing was checked with each participant to ensure accuracy and completeness. Food portions were converted into nutrients and energy intake, glycaemic index, and glycaemic load were analysed using the Nutrition Data System for Research software version 2015 (University of Minnesota) with the inclusion of typical Brazilian foods and standardised recipes.
Statistical analysis
Levene’s test and the Shapiro–Wilk tests were performed to determine the homogeneity of variance and normality respectively. The data passed both the homogeneity and normality tests. One-way ANOVA was used to detect differences in baseline characteristics and food intake and, when appropriate, the Tukey’s test was used for post hoc comparisons. Repeated-measures analysis using the mixed models procedure (PROC MIXED), which takes into account the covariance structure of the data( Reference Littell, Henry and Ammerman 27 ), was implemented on SAS® version 9.4 (SAS Institute Inc.). The protocol defined in PROC MIXED used the REML (restricted maximum likelihood) option with subjects as random effect and time as repeated measure with an autoregressive heterogenous (ARh) covariance matrix option and time×treatment interaction for each hormone and glucose measurement. The ARh covariance matrix was used because the time period between treatment sessions varied in the protocol (Fig. 2). The model was constructed considering baseline values and the Williams design. Fat intake in the evening meal prior to testing was included in the model for GLP-1 concentration. For the analysis of Sg and Si, the model was constructed assuming compound symmetry for the covariance structure and considering the Williams square sequence. The compound symmetry matrix was used because each Sg and Si is a single integrated value for each subject on each treatment. The least square means (LS means) statement of SAS PROC MIXED was used and compared among treatments and also treatments at each time point using the Student’s t test at a significance level of 0·05. Baseline values are reported as means and ±standard deviations, whereas glucose metabolism parameters (glucose, insulin, C-peptide, GLP-1 and GIP) and ODILE values (Si and Sg) from the repeated measures analysis are reported as LS means with their standard errors. We used a planned comparison against the control conditions, water or water with sugar, to reduce the risk of type I error due to multiple comparisons and to respond to the hypotheses raised. A B-Y method (Benjamin–Yekutieli method)( Reference Narum 28 ) was applied to the P value for comparisons between water, regular and decaffeinated coffee treatments, with a critical value of P<0·02727.
In addition, we performed the same analysis of the least square means (sem) for the Matsuda index( Reference Matsuda and DeFronzo 29 ). The Matsuda index was determined using glucose and insulin data taken at 60, 90, 121, 150 and 175 min, comprising the period from before (60 min) to approximately 2 h after the oral glucose load (175 min).
Results
Participant characteristics
A total of seventeen participants completed the study protocol and their baseline characteristics are summarised in Table 1. All participants met the fasting blood glucose requirement (4·10–5·44 mmol/l) before each experimental session.
Table 1 Baseline characteristics of study participants (n 17)(Mean values and standard deviations)
There were no significant differences in body weight (P=0·99), capillary glucose (P=0·97), or number of hours slept (P=0·66) at the beginning of each experimental session. In addition, there were no significant differences in food intake (energy, macronutrients, fibre and caffeine consumption, glycaemic index, or glycaemic load; P>0·08) in the evening meal before each experimental session, except for fat intake, which was significantly higher in the water group (P<0·05). Mean fat intake (g) for the groups were: coffee with sugar 32·5 (sd 17·8) and water with sugar 23·5 (sd 12·9); regular coffee 30·1 (sd 19·3); decaffeinated coffee 32·0 (sd 20·7); and water 50·5 (sd 18·7).
Insulin sensitivity and glucose effectiveness
Decaffeinated coffee induced a 97·5 % increase in Si compared with water treatment (P<0·05), whereas no significant difference in Si was detected for regular coffee compared with water. In addition, there was a tendency for higher Sg values in the regular coffee with or without sugar compared with either control condition (P=0·07). The indices of glucose homoeostasis derived from the ODILE test are presented in Table 2.
Table 2 Glucose homoeostasis indices derived from the Oral Dose Intravenous Label Experiment test(Least square means with their standard errors; n 17)
Si, insulin sensitivity; Sg, glucose effectiveness.
a,b Mean values within a column with unlike superscript letters are significantly different (P<0·05) according to a planned comparison of the groups for the presence or absence of sugar. There is no significant difference between beverages with sugar for Si.
*P value refers to mixed-model procedure (PROC MIXED) with subject as random effect and time as repeated measure to compare the effects of the beverages.
Matsuda indices were 3·79 (sd 1·60) for coffee with sugar, and 5·07 (sd 1·51) for water with sugar; 9·72 (sd 1·65) for regular coffee, 11·58 (sd 1·54) for decaffeinated coffee and 9·98 (sd 1·56) for water, with significant differences between treatments (P<0·001). However, for the planned comparison groups there were no differences between regular coffee with sugar and water with sugar. In addition, there were no differences between regular coffee, decaffeinated coffee and water.
Glucose metabolism parameters
Changes of least square mean concentration over time are presented in Fig. 3. As expected, post-absorptive glucose, insulin and C-peptide levels increased in the two treatments containing sugar, both at 30 and 60 min after beverage intake. Following the oral glucose load, insulin and C-peptide peaks at 90 min (30 min after the oral glucose load). Regular coffee with sugar primed insulin, C-peptide and GIP response compared with water with sugar (Fig. 3). At 90 min, 30 min after the oral glucose challenge, regular coffee increased glucose level when compared with water (Fig. 4). C-peptide was significantly higher for regular coffee compared with decaffeinated coffee at 135 min. Insulin increased after regular coffee but did not reach statistical significance. GLP-1 was higher compared with decaffeinated coffee 30 min after the beverage intake (Fig. 4). Table 3 shows the overall results of the mixed-model analysis with metabolic parameters for each treatment reported as LS means with their standard errors. No significant differences in glucose (P=0·72), insulin (P=0·49) and GLP-1 (P=0·43) levels were detected between the treatments over the 285-min trials. C-peptide and GIP levels showed a significant difference between treatments attributed to the presence of sugar. Observing the planned comparison groups, no statistical differences were detected. For example, in the comparison between decaffeinated and regular coffee for C-peptide, the calculated P value was 0·0292 but after B-Y method correction it failed to reach significance (Table 3).
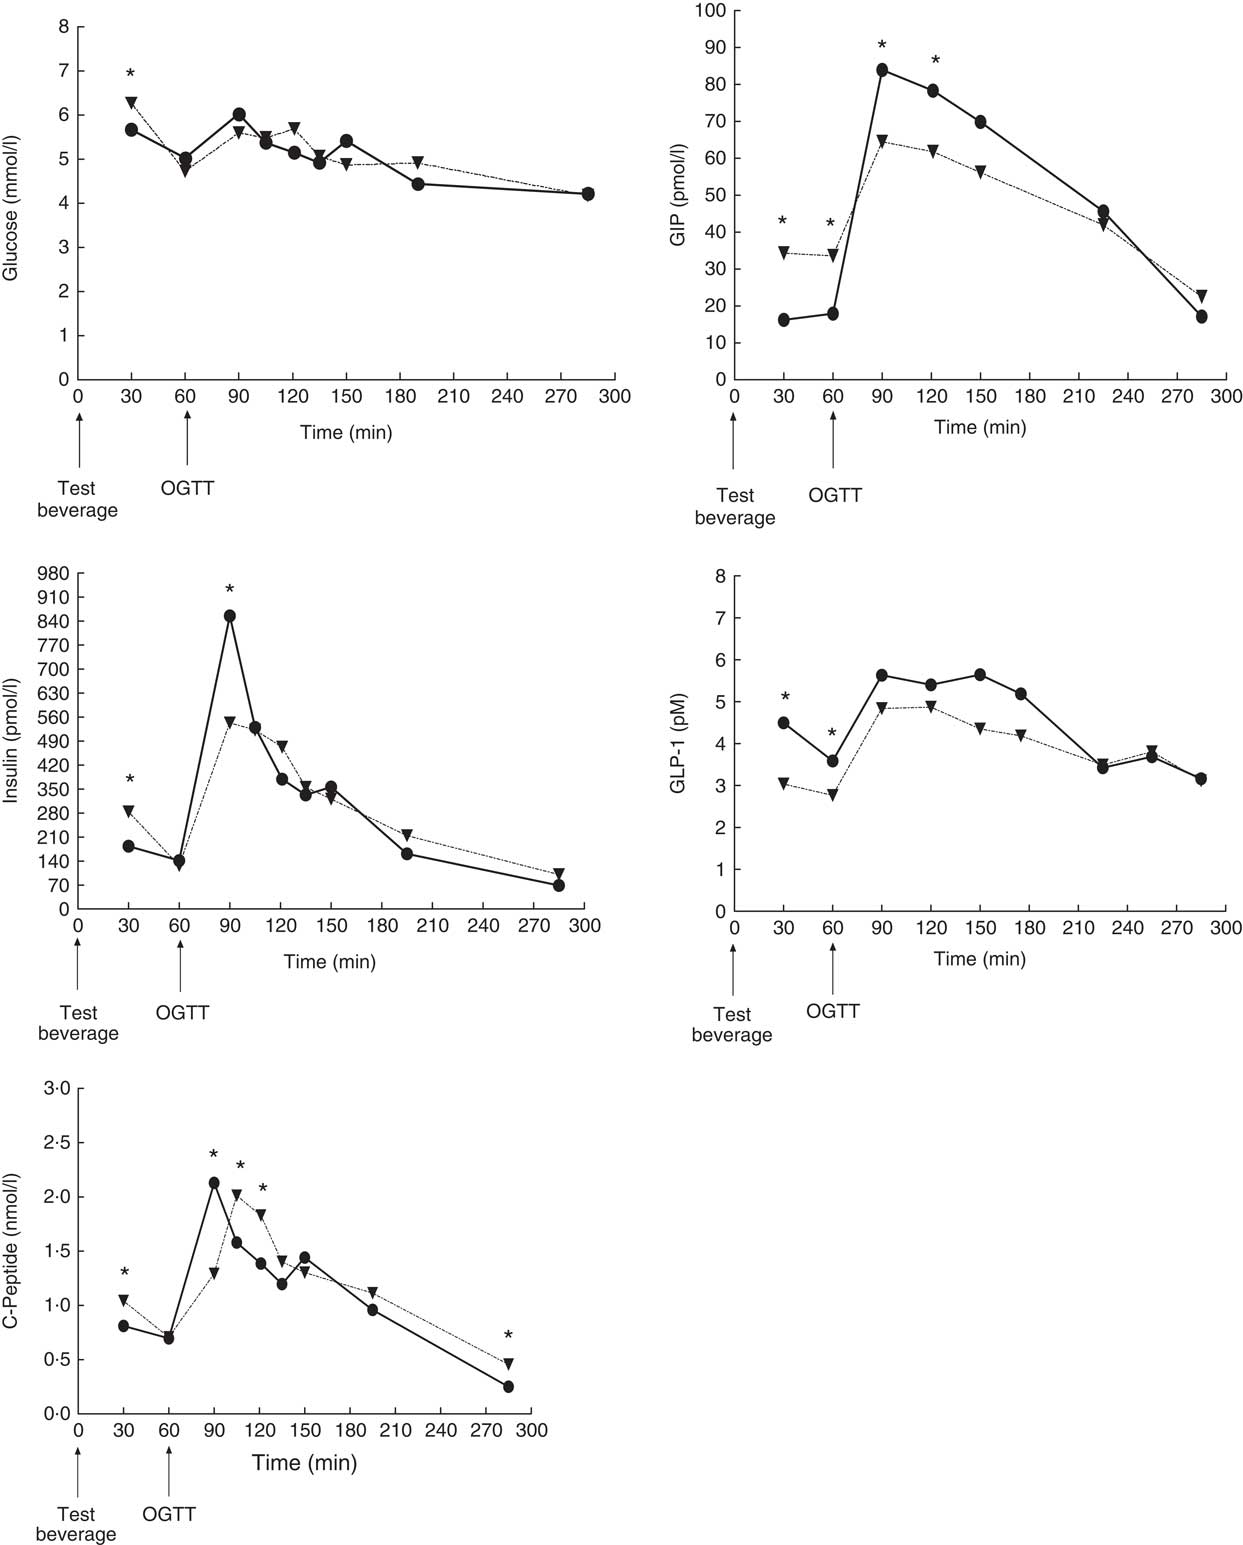
Fig. 3 Response during the Oral Dose Intravenous Label Experiment for glucose, insulin, C-peptide, glucose-dependent insulinotropic peptide (GIP) and glucagon-like peptide-1 (GLP-1) after consumption of regular coffee with sugar (![]() ) and water with sugar (
) and water with sugar (![]() ). * Mean values were significantly different for planned comparisons with t test between the two groups. Time of consumption of the test beverage and the oral glucose tolerance test (OGTT) are indicated in graphs.
). * Mean values were significantly different for planned comparisons with t test between the two groups. Time of consumption of the test beverage and the oral glucose tolerance test (OGTT) are indicated in graphs.
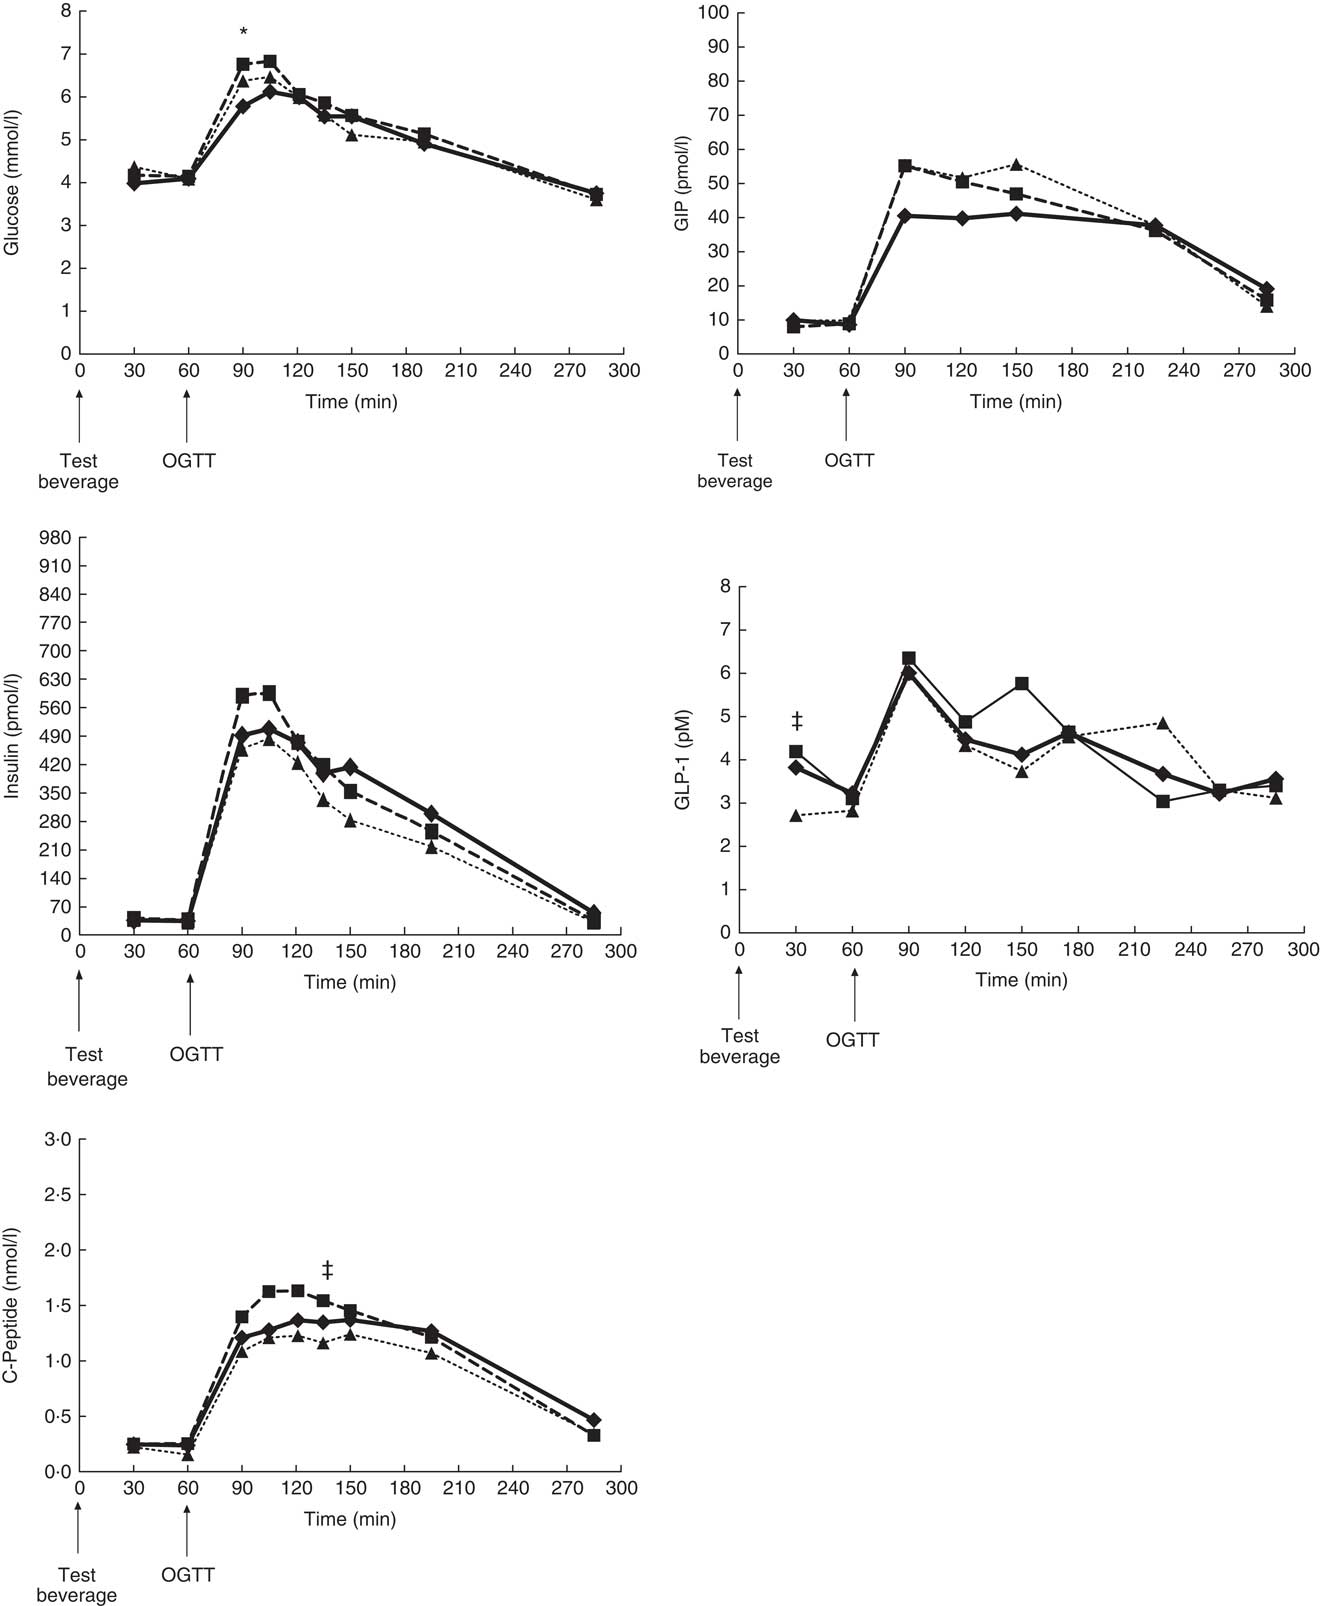
Fig. 4 Response during the Oral Dose Intravenous Label Experiment for glucose, insulin, C-peptide, glucose-dependent insulinotropic peptide (GIP) and glucagon-like peptide-1 (GLP-1) after consumption of regular coffee (![]() ), decaffeinated coffee (
), decaffeinated coffee (![]() ) and water (
) and water (![]() ). Data were analysed using Proc Mixed procedure and data are presented as least square means with omitted standard error for clarity. Mean values compared with Student t test. Significant differences: * regular coffee v. water; ‡ regular coffee v. decaffeinated coffee. A critical value correction for the multiple comparison was applied with B-Y method (P<0·02727). Time of consumption of the test beverage and the oral glucose tolerance test (OGTT) are indicated in graphs.
). Data were analysed using Proc Mixed procedure and data are presented as least square means with omitted standard error for clarity. Mean values compared with Student t test. Significant differences: * regular coffee v. water; ‡ regular coffee v. decaffeinated coffee. A critical value correction for the multiple comparison was applied with B-Y method (P<0·02727). Time of consumption of the test beverage and the oral glucose tolerance test (OGTT) are indicated in graphs.
Table 3 Least square means of metabolic parameters in each treatment group(Mean values with their standard errors; n 17)
GLP-1, glucagon-like peptide-1; GIP, glucose-dependent insulinotropic peptide.
*P value refers to mixed-model procedure (PROC MIXED) with subject as random effect and time as repeated measure to compare the effects of the beverages. No significant difference was detected for planned comparison between the beverages containing sugar. Also no significant difference was detected for comparisons between the beverages without sugar.
Discussion
On the basis of epidemiological studies associating coffee drinking with reduced risk of T2DM, we hypothesised that coffee without sugar (regular or decaffeinated) would improve glucose metabolism in response to a glycaemic load, but our findings only partially support this hypothesis. This clinical trial showed that moderate decaffeinated coffee consumption (2·5 cups or 300 ml) improved Si in healthy young adult men (20–35 years) following an oral glucose challenge, compared with water intake. However, there were no significant effects of regular coffee consumption on glucose, insulin, GLP-1 responses and Si and Sg indexes after the oral challenge. The lack of changes in glucose metabolism parameters after regular coffee consumption may result from the bioactive compounds in coffee, such as CGA and trigonelin, counteracting the effect of caffeine, as the former were previously shown to favourably affect glucose homoeostasis( Reference Tunnicliffe and Shearer 30 , Reference Meng, Cao and Feng 31 ).
Moreover, the addition of 30 g of sugar to regular coffee consumed 1 h before a glucose meal-equivalent had no additional effect on blood levels of glucose, and insulin, and Si over the 285-min response. However, the addition of sugar increased the early insulin secretion response (1 h post-absorption period) and induced a rapid increase in plasma insulin concentration, with a non-significant decrease in the glycaemic response 30–75 min after the oral glucose load follow-up. Louie et al.( Reference Louie, Atkinson and Petocz 13 ) reported that adding 10 g of sugar to coffee reduced the postprandial glycaemic response by approximately 40 %, compared with coffee without sugar( Reference Louie, Atkinson and Petocz 13 ). In contrast to this, our data do not indicate a favourable effect of coffee with sugar when compared with coffee without sugar. However, the reduction of blood glucose increases after an oral glucose overload following coffee with sugar when compared with sugar alone could suggest a favourable effect on postprandial glucose homoeostasis. Regular coffee with sugar primed the secretion of the incretins GLP-1 and GIP. GLP-1 presented a significant increase 30 min after coffee with sugar intake and then GIP at 90 and 120 min after the oral glucose challenge. Blood glucose was significantly decreased at 30 min after coffee consumption compared with water with sugar. These results linked the incretins, GLP-1 and GIP with glucose reduction in the presence of sweetened coffee. In addition, recent identification of norharman β-carboline in coffee, with α-glucosidase inhibiting activity, is another potential explanation for the favourable effects of coffee on glucose homoeostasis, given that this enzyme reduces carbohydrate absorption leading to reduced postprandial glucose levels( Reference Kim 32 ). It should be emphasised that the consumption of the sweetened beverages (regular coffee with sugar or water with sugar) promoted the expected increase in glycaemia and that coffee reduced the initial rise in the response by priming the physiological response.
Studies examining the effect of coffee on glucose metabolism have reported controversial results. Whereas some studies, like ours, found similar glucose and insulin responses 2–3 h after consumption of either regular coffee or water( Reference Johnston, Clifford and Morgan 33 – Reference Gavrieli, Fragopoulou and Mantzoros 39 ), others showed increased 2-h glucose and insulin AUC for regular coffee compared with either water( Reference Beaudoin, Robinson and Graham 40 ) or decaffeinated coffee( Reference Louie, Atkinson and Petocz 13 , Reference Beaudoin, Robinson and Graham 40 , Reference Moisey, Kacker and Bickerton 41 ). Moreover, two studies reported a lower glucose AUC for decaffeinated coffee compared with regular coffee( Reference Greenberg, Owen and Geliebter 42 ) or water( Reference Battram, Arthur and Weekes 43 ). Regarding the effect of coffee on Si indexes, the scenario is similar: Greenberg et al.( Reference Greenberg, Owen and Geliebter 42 ) found a higher Belfiore index (Si) for decaffeinated coffee, Moisey et al.( Reference Moisey, Robinson and Graham 36 ) showed a reduction in the Matsuda index for regular coffee and Buscemi et al.( Reference Buscemi, Verga and Batsis 44 ) observed a reduction in insulin resistance (homoeostasis model-estimated insulin resistance index (HOMA-IR)) for regular coffee. In addition, other studies showed no effect of coffee consumption on the Matsuda index( Reference Beaudoin, Robinson and Graham 40 , Reference Moisey, Kacker and Bickerton 41 , Reference Battram, Arthur and Weekes 43 ), or failed to find any consistent short-term (2–3 h) effects of coffee on Si indices( Reference Robertson, Clifford and Penson 45 , Reference Krebs, Parry-Strong and Weatherall 46 ). Ingestion of the sweetened beverages, resulted in the reduction of Matsuda index values, but no significant difference was observed for other treatments. It is acknowledged that the use of the Matsuda index is limited under study protocols involving a beverage/meal stimulus before the OGTT( Reference Moisey, Robinson and Graham 36 , Reference Beaudoin, Robinson and Graham 40 , Reference Moisey, Kacker and Bickerton 41 , Reference Battram, Arthur and Weekes 43 ), and is only suitable to compare treatments in this setting. Therefore, the Matsuda index provided limited information to assess Si under the proposed protocol. Thus, our finding of improved Si adds an important contribution to the field, as it relies on the strengths of the ODILE test, specifically the determination of an Si index under physiological conditions in a cross-over randomised trial. The ODILE test was validated against the golden standard assessment of Si, the euglycaemic hyperinsulinaemic clamp( Reference Bluck, Williams and Jackson 14 ). However, although insulin dependent glucose disposal data from the ODILE and the clamp are highly correlated, it is noteworthy that those two tests do not measure the same metabolic parameter, possibly because, unlike the clamp, the ODILE test is not carried out under steady conditions. Therefore, it is expected that the partitioning of the glucose load between the various metabolic routes might be different( Reference Bluck, Williams and Jackson 14 ). In fact, conflicting results have been reported for the effects of coffee consumption on glucose metabolism using different indices of Si/resistance assessment (Matsuda and HOMA-IR)( Reference Natella and Scaccini 11 ). Our study presents a robust analysis under physiological conditions of the short-term effects of regular and decaffeinated coffee consumption on glucose metabolism.
The accurate determination of Si/resistance is essential in understanding the pathophysiology of T2DM. Currently, there are two widely accepted methodologies that give accurate measures of Si: the euglycaemic hyperinsulinaemic clamp, and the frequently sampled intravenous glucose tolerance test (FSIVGTT)( Reference Gutch, Kumar and Razi 47 ). Although widely employed, the FSIVGTT has some limitations, which are overcome by the incorporation of a small bolus dose of labelled glucose near the period of maximum hyperglycaemia after the oral glucose load. The ODILE protocol has been proposed by Bluck et al. and has been shown to be effective, as it enables the separation of glucose disposal measurements from endogenous glucose production, and increases the accuracy of the estimates of the physiological parameters( Reference Bluck, Williams and Jackson 14 , Reference Bluck, Clapperton and Coward 17 ). Accordingly, this study offers a novel approach to understanding the effects of coffee consumption on glucose homoeostasis. To our knowledge, this is the first randomised clinical trial to have used the ODILE test as the experimental model for glucose and insulin assessment.
Our finding of improved Si after consumption of decaffeinated coffee is consistent with epidemiological data showing reduced T2DM incidence in regular consumers of decaffeinated coffee( Reference Bhupathiraju, Pan and Manson 4 – Reference Jiang, Zhang and Jiang 6 ). Moreover, the tendency for higher Sg values in the regular coffee treatments requires further investigation under normal physiological conditions due to the role of Sg in the regulation of glucose tolerance by the glucose-induced stimulation of glucose uptake and suppression of its own production( Reference Dube, Errazuriz-Cruzat and Basu 48 ). However, even though our study was not powered to detect differences in Sg it shows a moderate trend.
Strengths and limitations
This study has some strengths and limitations. The cross-over randomised design and the use of the ODILE test interpreted by the two-compartment minimal model are the main strengths. Similarly, the sample size was defined according to the power calculations performed for the Si parameter, and the male-only sample eliminated any potential sex-specific effects. The PROC MIXED analysis is consistent with the protocol (time follow-up) and the study design (William square). In addition, the coffee dose used was moderate and calculated to correspond to a commonly consumed dose. However, it should be highlighted that there are some challenges related to studying coffee consumption because there is no standardised definition for the volume of coffee that makes up one cup, the caffeine content of different coffees can vary, and the method of preparation influences the amount of caffeine and non-caffeine constituents. Our protocol measured the effect of one coffee treatment followed by a glucose tolerance test based on the 45–60 min peak caffeine plasma levels after a coffee beverage intake( Reference Teekachunhatean, Tosri and Rojansthien 49 ). Other polyphenolic compounds that might undergo extensive metabolism and modification may not have been detected in our follow-up. It should also be noted that we selected habitual coffee consumers in order to minimise possible adverse effects of acute coffee consumption in less frequent consumers. In addition, subjects were asked to abstain from coffee in the 24 h preceding each intervention so that recent coffee consumption would not affect the effects of the tests beverages on glucose homoeostasis. However, we did not assess adherence to coffee abstinence by tools other than the interview. In addition, we cannot rule out that preference for sweetened coffee over non-sweetened coffee might have affected our findings, given that sweetening coffee is a common habit among Brazilians and that alimentary chemosensation has been shown to be linked with glucose homoeostasis( Reference Dotson, Zhang and Xu 50 ). Moreover, although the sample size of seventeen subjects was calculated to be sufficient to provide power, we acknowledge that the number of subjects included in the present study is smaller when compared with other coffee trials. Also, our findings cannot be generalised to other population groups, such as people with diabetes, women or non-habitual coffee consumers.
In conclusion, our results indicate that, in the short-term, consumption of decaffeinated coffee improves Si compared with water, and that the consumption of coffee with sugar has no adverse effects on glucose metabolism in healthy men. Nevertheless, further research, including long-term interventional studies, is needed to fully elucidate the mechanisms underlying the effects of coffee on glucose homoeostasis and the reduced risk for T2DM.
Acknowledgements
The authors are grateful to Leandro Faleiros Garcia and Alessandra Gaspar de Sousa for coffee preparation and blinding; Werte Chaves for technical assistance with blood collection; Bruna Teles and Luiz Araújo for technical assistance with incretins and C-peptide analyses; SABIN Laboratory of Clinical Analysis (Brazil) for determination of glucose and insulin concentrations; Edina Miazaki for assistance with the PROC MIXED model in SAS; Dr Michelle Venables for helpful suggestions to the manuscript; and the Stable Isotope Team, at Medical Research Council (MRC)-Elsie Widdowson Laboratory, formally MRC-Human Nutrition Research (UK) for collaboration on GC/C/IRMS and minimal model analyses. The authors are deeply grateful and indebted to Les Bluck, who passed away prematurely and could not witness the conclusion of this article, and express the profound admiration and recognition for the full support he provided during the planning, conduction and laboratory analysis of this research.
The study was funded by National Council for Scientific and Technological Development (CNPq, Brazil, grant no. 473074-2010-9) and MRC-Elsie Widdowson Laboratory (UK, Physiological Modelling of Metabolic Risk – MC_UP_A090_1005 and Nutrition Surveys and Studies – MC_U105960384).
Authors’ contributions are as follows: C. E. G. R., C. L. R. d. S. P. and T. H. M. d. C. conducted research, contributed to laboratory and data analysis and wrote the manuscript; S. W. contributed to laboratory and data analysis (modelling), and revised the manuscript; L. J. C. B. contributed to study design and data analysis (modelling); T. H. M. d. C., J. G. D., A. A. A. and A. L.-P. contributed to study design, data analysis and wrote the manuscript. All authors approved the final manuscript and had access to the full data set. C. E. G. R. and T. H. M. d. C. are the guarantors of this work.
The authors declare that there are no conflicts of interest.
Supplementary material
For supplementary material/s referred to in this article, please visit https://doi.org/10.1017/S000711451800034X


