


As a commonly used international standard for defining anthropometric characteristics in adults, BMI has been widely used as a risk factor for the prevalence of several diseases(Reference Nuttall1). It represents an index of an individual’s fatness, calculated as weight (kg) per height squared (m2). BMI cut-off points proposed by Chinese BMI criteria(Reference Zhou2) are: underweight (BMI < 18·5 kg/m2), normal weight (18·5 kg/m2 ≤ BMI < 24·0 kg/m2), overweight (24·0 kg/m2 ≤ BMI < 28·0 kg/m2), and obesity (BMI ≥ 28·0 kg/m2). Based on the analysis of the China Health and Nutrition Survey data, Xi et al.(Reference Xi, Liang and He3) reported an increase of 1·2 kg/m2 in mean BMI values among Chinese adults during the period of 1993–2009, and that the prevalence of overweight increased from 9·4 % in 1993 to 15·7 % in 2009 and the prevalence of obesity increased from 4·0 to 10·7 % during 1993–2009. As a developing country, China’s rapid economic growth has led to changes in diet and physical activity patterns, which have led to an increase in overweight and obesity epidemics(Reference Jaacks, Gordon-Larsen and Mayer-Davis4).
In the past decades, overweight and obesity have received increasing attention. Due to its growing prevalence and substantial morbidity and mortality, obesity has become an important public health issue. Overweight and Obesity are known as risk factors for cancers and various chronic diseases such as chronic kidney diseases, asthma, the metabolic syndrome, early atherosclerosis, non-alcoholic fatty liver disease and type 2 diabetes(Reference Huang, Lin and Lim5–Reference Despres and Lemieux8). Significant factors in overweight and obesity epidemic are imbalanced diet and lack of physical activity(Reference James9). However, they are not the whole story. Recently, gut microbiota has been implicated as one of the influencing factors that further promote obesity and metabolic disorders in obese subjects(Reference Bäckhed, Ding and Wang10–Reference Qin, Li and Cai12). On the other hand, low BMI is also associated with alternation in the gut microbiota. Ghosh et al.(Reference Ghosh, Gupta and Bhattacharya13) investigated that dysbiosis of gut microbiota is linked to child malnutrition. Another report indicated that bacteria belonging to Gemmiger, Dorea, Roseburia, Alistipes, Lactobacillus and Bifidobacterium genera have a potential role in leanness(Reference Aguirre, Bussolo de Souza and Venema14).
The human gut microbiota (defined as microbes that live in the gastrointestinal tract) is estimated to contain at least 1014 bacteria and archaea composed of more than 1000 species(Reference Ley, Peterson and Gordon15). Moreover, the genome of the microbiome in the human intestine is thought to contain at least 150 times the number of human genes, and the biomass of the gut microbiota may reach up to 1·5 kg(Reference Qin, Li and Raes16,Reference Bäckhed, Ley and Sonnenburg17) . About 3 years after birth, the gut flora tends to mature. From then on, it mainly consists of four phyla (Firmicutes, Bacteroidetes, Actinobacteria and Proteobacteria), among which the Firmicutes and the Bacteroidetes account for about 90 % of all the bacterial species in the gut(Reference Ley, Peterson and Gordon15,Reference Dethlefsen, McFall-Ngai and Relman18) . The abundant and diverse microbiota in the gastrointestinal tract play an important role in host physiology, including immune modulation, maintenance of the gut barrier and involvement in nutrient metabolism(Reference Sekirov, Russell and Antunes19). However, the disruption of the fine balance between the gut microbiota and its mammalian host may lead to the pathogenesis of many diseases. Emerging data have linked intestinal dysbiosis to several gastrointestinal diseases including inflammatory bowel disease, irritable bowel syndrome, non-alcoholic fatty liver disease and gastrointestinal malignancy(Reference Parekh, Balart and Johnson20). Furthermore, an altered gut microbiota is associated with obesity, diabetes and atherosclerosis(Reference Karlsson, Tremaroli and Nielsen21).
Most of the species in the human gut are strictly anaerobic and are difficult to culture, which limits the investigation of their individual physiological and metabolic potential. Molecular methods especially next-generation sequencing (NGS) has revolutionised the knowledge of the gut microbiota at a rapid pace and enable to describe the diversity and composition of the gut microbiota. Kasai et al.(Reference Kasai, Sugimoto and Moritani22) investigated the human gut microbiota in a Japanese population using NGS and terminal restriction fragment length polymorphism (T-RFLP) analysis, which revealed that obese and non-obese subjects had different gut microbiota compositions, and certain bacterial species were significantly associated with each group. However, in terms of the gut microbial composition, especially the proportion of the phyla Firmicutes and Bacteroidetes in lean and obese humans, several studies drew conflicting conclusions. A study suggested that the gut microbiota of obese people seem to have an increased level of Firmicutes and a reduced level of Bacteroidetes(Reference Turnbaugh, Ley and Mahowald23). On the contrary, Schwiertz et al.(Reference Schwiertz, Taras and Schafer24) reported a lower ratio of Firmicutes in overweight adults compared with lean controls. And Duncan et al.(Reference Duncan, Lobley and Holtrop25) suggested no differences among Firmicutes and Bacteroidetes according to BMI. Discrepancies between these results may be due to dietary habits, host physiology, hormonal factors as well as the methodologies used in their analyses(Reference Kasai, Sugimoto and Moritani22,Reference Tims, Derom and Jonkers26) .
It is known that there are differences in body shape and lifestyle between Chinese and people from Western countries, thus the category of BMI between them is also different. BMI is classified according to the internationally recognised WHO classification in Western countries(27): BMI < 18·5 kg/m2 for lean, BMI = 18·5 – 24·9 kg/m2 for normal weight, BMI = 25 – 29·9 kg/m2 for overweight and BMI >30 kg/m2 for obesity; thus, the present study followed the Chinese BMI criteria(Reference Zhou2): lean (BMI < 18·5 kg/m2), normal weight (18·5 kg/m2 ≤ BMI < 24·0 kg/m2), overweight (24·0 kg/m2 ≤ BMI < 28·0 kg/m2) and obesity (BMI ≥ 28·0 kg/m2). In addition, previous works mostly are based on murine studies, so the relevance in human biology will require much more research, which may be another reason for the conflicting results. Furthermore, earlier research has not paid adequate attention to the population of lean. To make up the gap in the research in China, we carried out the study to explore the association between gut microbiota composition and BMI by 16S rRNA sequencing on the Illumina MiSeq platform in college students of Lanzhou University in China.
Methods
Study participants
The participants in Lanzhou University were selected by a cross-sectional questionnaire study(Reference Qin, Chen and Liu28). The inclusion criteria were male, age >18 years, no history of bowel diseases, did not have acute or chronic diarrhoea recently and had not taken antibiotics in the previous 1 month. A total of nine lean, nine overweight/obesity and ten normal-weight college students were enrolled in the present study. The number of study participants per group was originally planned to be twenty-eight, which was sufficient to obtain a power of 80 % (type II error rate β = 20 %) when type I error was set to 5 %. But few participants were willing to sign informed consent in terms of the collection of faecal specimens. And to ensure consistency in baseline information of all participants, a few samples were excluded. Eventually, twenty-eight participants were enrolled in our study. Basic information such as age, dietary, physical activity, was examined by questionnaire. The definitions of these variables are as follows: Breakfast was defined as ‘no’ if participants never take breakfast and ‘yes’ in other condition. Eating speed was defined as ‘normal’ if participants spend more than 5 min on each meal and ‘fast’ if less than 5 min. Midnight snack was defined as ‘yes’ if participants take midnight snack every day and ‘no’ in other circumstance. Snack was defined as ‘yes’ if participants take snacks every day and ‘no’ in other circumstance. Exercise was defined as ‘no’ if participants never do exercises and ‘yes’ in other cases. Stress was defined as ‘yes’ if participants were always in a state of pressure. And drink/smoke was defined as ‘no’ if participants never drink and smoke and defined as ‘yes’ in other degree of drink and smoke. All individuals were males within a narrow range of age (18–27 years). And all subjects were classified based on the international BMI cut-off values of Chinese BMI criteria(Reference Zhou2). In the present study, subjects with a BMI < 18·5 kg/m2 were classified as lean, subjects with a BMI between 18·5 and 24 kg/m2 as normal and those with a BMI ≥24 kg/m2 as overweight/obesity, for we did not have enough subjects with a BMI ≥28 kg/m2 to make statistical analyses.
Ethics, consent and permissions
The trial protocol and all amendments were approved by the ethics committee of School of Public Health, Lanzhou University. All subjects gave written informed consent to participate in the study.
Sample collection, transportation and storage
Stool samples were collected twice from each individual. To collect the faecal samples, each participant was given a sterile plastic bottle with a screw cap and required to collect stool samples between 06.00 and 08.00 hours before breakfast. Fresh stool samples were collected from each participant in dormitory, packed in ice and then transported to the laboratory within 30 min. Each stool sample was divided into three Eppendorf tubes once arriving at our laboratory. One approximately 250–350 g went through pre-treatment immediately and the others were stored. All the samples were stored at –80°C until genomic DNA extraction. In terms of pre-treatment, faecal samples (200 mg) were washed with 2·0-ml PBS buffer, shaken well, then centrifuged at 3000 rpm for 5 min, and supernatant was collected. This procedure was repeated three times, and each supernatant was collected in a 1·5-ml Eppendorf tube. After centrifugation at 12 000 rpm for 10 min, the precipitate was stored at –80°C(Reference Matsuki, Watanabe and Fujimoto29,Reference Matsuki, Watanabe and Fujimoto30) . After a week (7 d), the collection procedure was repeated at the same time and place.
DNA extraction
First, the pre-treated samples collected for the first and second time were mixed. Then genomic DNA was extracted from faecal samples using E.Z.N.A. stool DNA kit (Omega) following the manufacturer’s instructions. The DNA concentration and quality were determined by agarose gel electrophoresis (1 % wt/vol agarose in Tris-acetate-EDTA buffer) and with a NanoDrop ND-2000 spectrophotometer (NanoDrop Technologies). All DNA samples were stored at –80°C until further processing.
Illumina MiSeq sequencing
Next-generation sequencing library preparations and Illumina MiSeq sequencing were conducted at GENEWIZ, Inc. DNA samples were precisely quantified using a Qubit 2·0 Fluorometer (Invitrogen) and DNA quality was checked on a 0·8 % agarose gel once again. DNA, 5–50 ng, was used to generate amplicons using a MetaVxTM Library Preparation kit (GENEWIZ, Inc.). A panel of proprietary primers was designed to anneal to the relatively conserved regions bordering V3–V4 hypervariable regions. The V3 and V4 regions were amplified using forward primers containing the sequence ‘CCTACGGRRBGCASCAGKVRVGAAT’ and reverse primers containing the sequence ‘GGACTACNVGGGTWTCTAATCC’. Besides the 16S target-specific sequence, the primers also contained adaptor sequences allowing uniform amplification of the library with high complexity ready for downstream NGS sequencing on Illumina Miseq(Reference Walker, Martin and Scott31). DNA libraries were validated using an Agilent 2100 Bioanalyzer (Agilent Technologies) and quantified by Qubit and real-time PCR (Applied Biosystems). DNA libraries were multiplexed and loaded on an Illumina MiSeq instrument, according to the manufacturer’s instructions (Illumina). Sequencing was performed using a 2 × 250 or 2 × 300 paired-end configuration; image analysis and base calling were conducted by the MiSeq Control Software on the MiSeq instrument.
Real-time PCR analysis of Firmicutes and Bacteroidetes
Quantitative real-time PCR was performed to analyse the phyla Firmicutes and Bacteroidetes to further confirm the pyrosequencing data. Each reaction mixture contained SYBR Premix Ex TaqII (Takara) 10 μl, forward primer 2 μl, reverse primer 2 μl at a concentration of 0·4 μM, template DNA 5 μl, diethyl pyrocarbonate (DEPC) H2O 1 μl in a final volume of 20 μl. The copy number of the target DNA was determined by comparison with serially diluted standards (103–108 copies of plasmid DNA containing the respective amplicon for each set of primers) run on the same plate. The amplification program consisted of one cycle at 95°C for 30 s, followed by forty cycles at 95°C for 5 s, 60°C for 30 s and 72°C for 35 s. The melting curve was obtained by slow heating at temperatures from 60 to 95°C for 15 s with continuous fluorescence collection. PCR were performed with CFX96 system (Bio-Rad). Bacterial quantity was expressed as log10 bacteria copies per g of stool.
Bioinformatic analyses
The QIIME (version 1.8) (Kuczynski et al.(Reference Kuczynski, Stombaugh and Walters32)) analysis package was used for 16S rRNA data analysis. The paired-end sequences were assembled and assigned to samples based on barcode and truncated by cutting off the barcode and primer sequence. In the next step, quality filtering on joined sequences was performed and sequence that did not fulfil the following criteria was removed: sequence length <200 bp, ambiguous bases, sequences containing n, mean quality score ≥20. Then the sequences were compared with the reference database (RDP Gold database) using UCHIME algorithm to detect chimeric sequence and then the chimeric sequences were removed. After these filtering steps, the effective sequences were used in the final analysis. The effective sequences were clustered at 97 % sequence identity into operational taxonomic units using the clustering program VSEARCH (1.9.6) against the Silva 119 database. The Ribosomal Database Program classifier was applied for the assignment of operational taxonomic units representative sequences into the bacterial taxonomy at confidence threshold of 0·8 against the Silva 119 database. The Ribosomal Database Program classifier used the Silva 119 database, which has taxonomic categories predicted to the species level. For the α-diversity metrics, richness estimators (ACE and Chao1), diversity indices (Shannon and Simpson) were calculated in QIIME. What’s more, the weighted and unweighted UniFrac distance matrix (Lozupone and Knight(Reference Lozupone and Knight33)) were calculated and visualised with principal coordinate analysis was used in QIIME performing the β-diversity metrics. Metagenomic biomarker discovery was also conducted by linear discriminant analysis effect size (LEfSe) on the web-based Galaxy(Reference Afgan, Baker and Batut34).
Statistical analysis
Before statistical analysis, total sum scaling normalisation was conducted in total number of reads of each sample. The normal distributions of variables were assessed using the Kolmogorov–Smirnov test. The Kruskal–Wallis test was used to compare the composition of gut microbiota among three BMI category groups (lean, normal and overweight/obesity). Pearson’s correlation (parametric) or Spearman’s correlation (non-parametric) was used to examine the relationship between BMI, richness estimators (ACE and Chao1), diversity indices (Shannon and Simpson), Good’s coverage and gut microbiota composition of each sample. All analyses were performed using IBM SPSS software version 21. P values of less than 0·05 were considered significant.
Results
Characteristics of participants
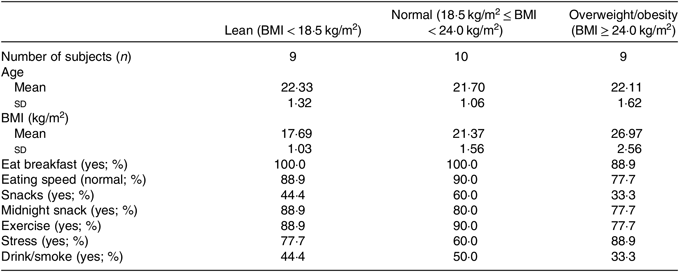
A total of nine lean, nine overweight/obesity and ten normal-weight college students were enrolled in the present study. All subjects were male. Basic information of all participants is shown in Table 1.
Table 1. Descriptive characteristics of study participants
(Numbers of subjects; mean values and standard deviations; percentages)
Characteristics of sequencing results
Illumina MiSeq sequencing were conducted, and 6 651 576 raw reads were obtained from all twenty-eight isolated faecal DNA. After quality filtering, 30 409–191 280 effective sequences were collected from each faecal sample, resulting in a total of 2 526 732 sequences from twenty-eight samples. The total number of reads, number of bp and the mean length of the reads obtained from the original fastq file of each faecal sample before and after quality control filters are presented in online Supplementary Table S1.
All the sequences were delineated into operational taxonomic units with 97 % sequence similarity threshold. The Good’s coverage of each group was over 99·8 %, indicating that the 16S rDNA sequences identified in the groups represented the majority of bacteria appeared in the samples of the present study. The associations between BMI and operational taxonomic units, the estimators of microbial richness (ACE and Chao1) and diversity (Shannon and Simpson) are summarised in Table 2. There was a statistically significant difference in Shannon indexes (3·68 (sd 0·34) v. 3·27 (sd 0·50), P = 0·038) and Simpson indexes (0·83 (sd 0·38) v. 0·77 (sd 0·72), P = 0·019) between lean and overweight/obesity, demonstrating that notably lower diversity of gut microbiota was found in overweight/obesity participants. To further explore the relationship between BMI and gut microbial diversity, Pearson’s correlation was conducted. It was indicated that BMI had a negative correlation with Shannon indexes (r –0·460, P = 0·014) as well as Simpson indexes (r –0·452, P = 0·016) (Fig. 1), which confirmed that gut bacterial diversity decreased with the increase in BMI.
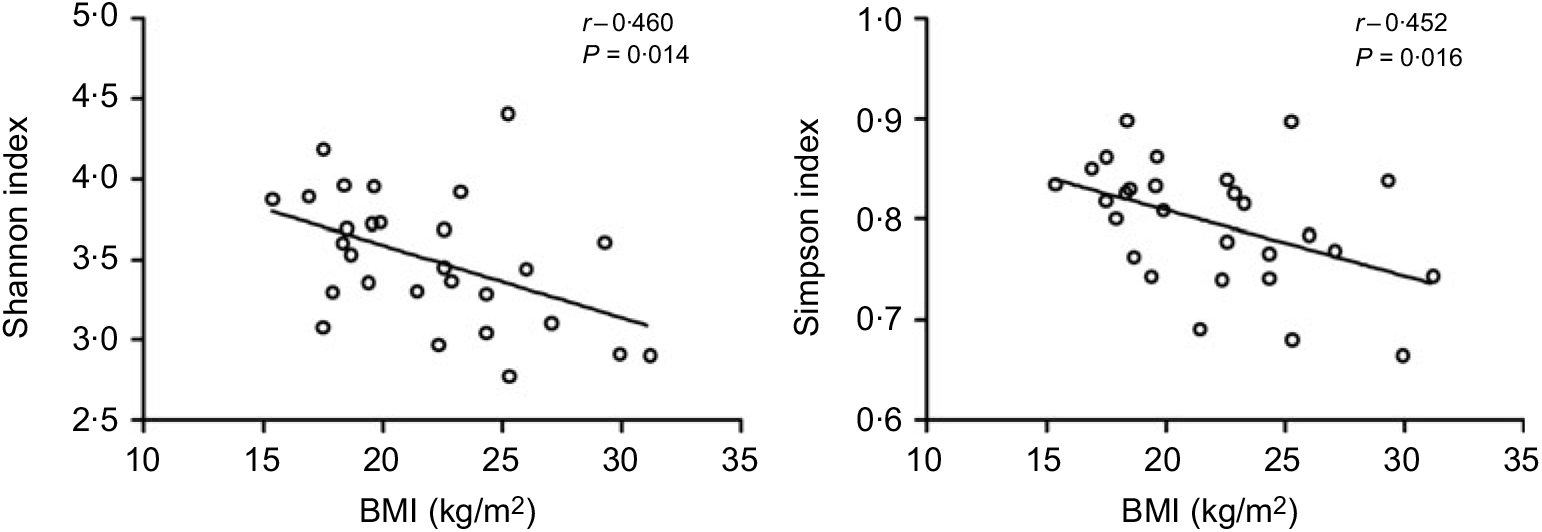
Fig. 1. Association between BMI and gut microbial diversity derived by Pearson’s correlation.
Table 2. Summary of sequencing data in the present study
(Medians; mean values and standard deviations)
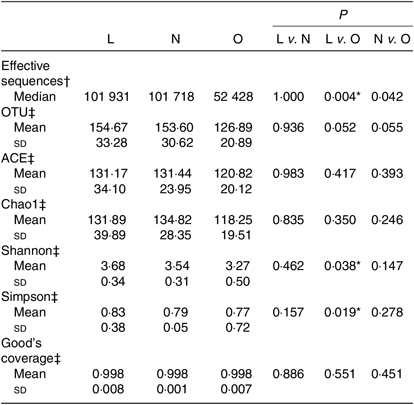
L, lean; N, normal; O, overweight/obesity; OTU, operational taxonomic units.
* Significant difference (P < 0·05).
† Kruskal–Wallis test.
‡ One-way ANOVA.
Comparison of gut microbial community among groups
Based on the Ribosomal Database Program database, all sequences were classified from the phylum to species. The overall gut microbiota compositions for each individual at the phylum and genus level are shown in Figs. 2 and 3, where the microbial composition varied greatly among individuals. The dominant bacterial phyla are the Firmicutes and the Bacteroidetes. However, there is no statistical difference in the distribution of the Firmicutes and the Bacteroidetes among three groups (P > 0·05). Furthermore, the ratio of Firmicutes:Bacteroidetes was analysed, and no difference was observed among the three groups, as confirmed by real-time PCR (online Supplementary Table S2).
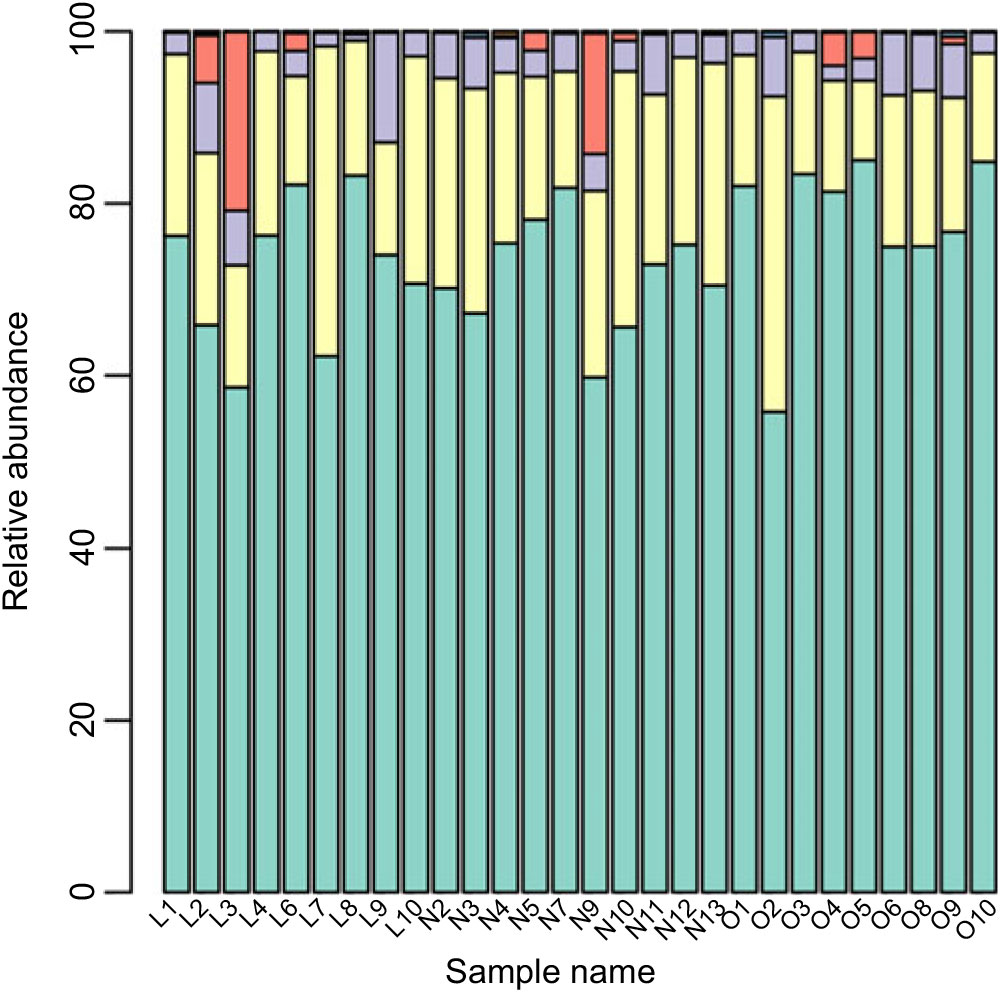
Fig. 2. Gut microbiota compositions for each individual at the phylum level. ![]() , Bacteroidetes;
, Bacteroidetes; ![]() , Firmicutes;
, Firmicutes; ![]() , Proteobacteria;
, Proteobacteria; ![]() , Fusobacteria;
, Fusobacteria; ![]() , Actinobacteria;
, Actinobacteria; ![]() , Cyanobacteria;
, Cyanobacteria; ![]() , Synergistetes;
, Synergistetes; ![]() , candidate_division_TM7;
, candidate_division_TM7; ![]() , other.
, other.
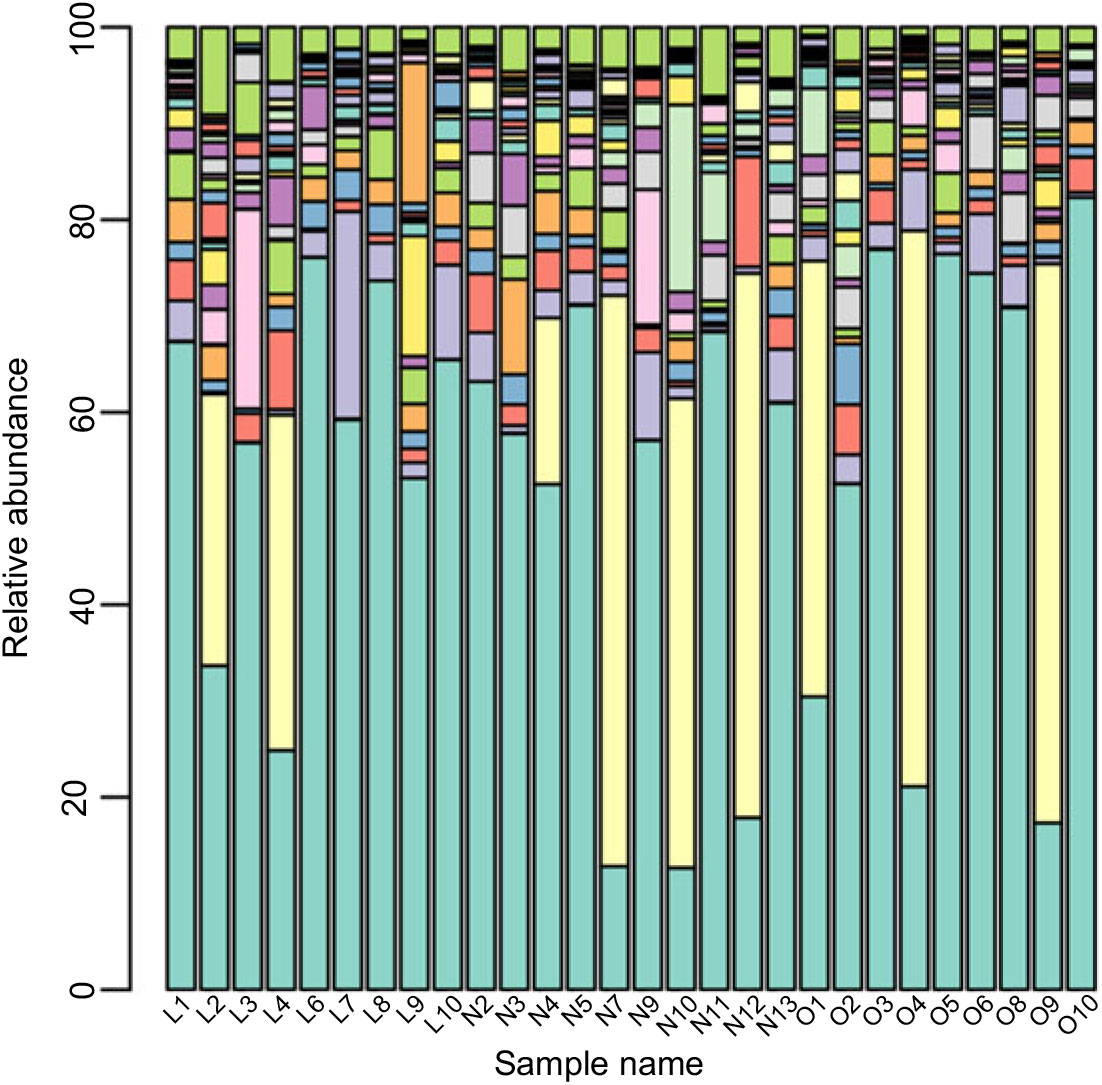
Fig. 3. Gut microbiota compositions for each individual at the genus level. ![]() , Bacteroides;
, Bacteroides; ![]() , Prevotella;
, Prevotella; ![]() , Lachnospira;
, Lachnospira; ![]() , Pseudobutyrivibrio;
, Pseudobutyrivibrio; ![]() , Faecalibacterium;
, Faecalibacterium; ![]() , Phascolarctobacterium;
, Phascolarctobacterium; ![]() , Alistipes;
, Alistipes; ![]() , uncultured_bacterium;
, uncultured_bacterium; ![]() , Parasutterella;
, Parasutterella; ![]() , Parabacteroides;
, Parabacteroides; ![]() , Dialister;
, Dialister; ![]() , Sutterella;
, Sutterella; ![]() , uncultured;
, uncultured; ![]() , Roseburia;
, Roseburia; ![]() , Subdoligranulum;
, Subdoligranulum; ![]() , Incertae_Sedis;
, Incertae_Sedis; ![]() , Blautia;
, Blautia; ![]() , Alloprevotella;
, Alloprevotella; ![]() , Escherichia-Shigella;
, Escherichia-Shigella; ![]() , Odoribacter;
, Odoribacter; ![]() , Veillonella;
, Veillonella; ![]() , Haemophilus;
, Haemophilus; ![]() , Butyricimonas;
, Butyricimonas; ![]() , Ruminococcus;
, Ruminococcus; ![]() , Dorea;
, Dorea; ![]() , Barnesiella;
, Barnesiella; ![]() , Paraprevotella;
, Paraprevotella; ![]() , Anaerostipes;
, Anaerostipes; ![]() , Coprococcus;
, Coprococcus; ![]() , Bifidobacterium;
, Bifidobacterium; ![]() , other.
, other.
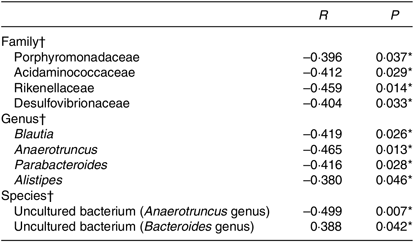
Although the major taxa explaining the alteration of microbiota structure were not reflected at the phyla level, the differences were found at the genus and species level. Differences in bacterial composition among the three groups at genus and species level are shown in Table 3. At the genus level, the abundances of Blautia, Anaerotruncus and Klebsiella were significantly higher in the lean group compared with the overweight/obese group (P < 0·05). At the species level, the abundance of two uncultured bacteria belong to Dialister and Anaerotruncus genera was lower in the overweight/obese group compared with the lean group (P < 0·05) as well as Klebsiella pneumoniae.
Table 3. Phylotypes with significant difference among the three groups
L, lean; N, normal; O, overweight/obesity.
* Significant difference (P < 0·05).
† Kruskal–Wallis test.
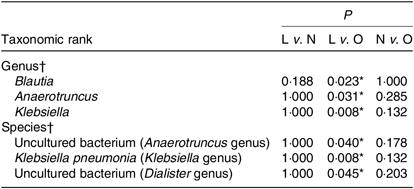
Correlation analysis of BMI and gut microbiota
To further explore the relationship between gut microbiota and BMI, Spearman’s correlation was conducted (Table 4). It was revealed that Porphyromonadaceae, Acidaminococcaceae, Rikenellaceae, Desulfovibrionaceae were to decrease in line with the increase in BMI at the family level (r –0·396, P = 0·037; r –0·412, P = 0·029; r –0·459, P = 0·014; r –0·404, P = 0·033). Porphyromonadaceae was associated with cognitive decline and inflammatory responses(Reference Scott, Ida and Peterson35,Reference Shao, Shao and Li36) . Acidaminococcaceae and Desulfovibrionaceae were potentially related to diet-induced obesity(Reference Zhao, Zhang and Ma37). And Rikenellaceae tends to exist in the gut of people with good metabolic state(Reference Lippert, Kedenko and Antonielli38). At the genus level, Blautia, Anaerotruncus, Parabacteroides and Alistipes were negatively correlated with BMI (r –0·419, P = 0·026; r –0·465, P = 0·013; r –0·416, P = 0·028; r –0·380, P = 0·046), in which Blautia was known as SCFA producer(Reference Zhang, Zhao and Xu39). The species in uncultured bacterium (Bacteroides genus) were in positive linear relationship with BMI (r 0·388, P = 0·042), while another species in uncultured bacterium (Anaerotruncus genus) were in negative linear relationship with BMI (r –0·499, P = 0·007).
Table 4. Correlation analyses between gut microbiota and BMI
* Significant difference (P < 0·05).
† Spearman’s correlation analyses.
Microbiome signatures in lean students v. overweight/obese students
The LEfSe method was used to determine the taxa at different taxonomic levels were enriched in the lean and obese groups (Fig. 4). At the genus level, Parasutterella were overrepresented in the obese group (linear discriminant analysis score ≥ 4), while Blautia, Megasphaera, Klebsiella, uncultured Lachnospiraceae and Anaerotruncus were enriched in the lean group (linear discriminant analysis score ≥ 2·5). At the species level, uncultured Parasutterella species and uncultured Roseburia species were enriched in the obese group; while uncultured Anaerotruncus species, unidentified rumen bacterium 12_110, uncultured Dialister species, bacterium_NLAE_zl_H512, uncultured Lachnospiraceae species, Klebsiella pneumoniae and uncultured Megasphaera species were enriched in the lean group.
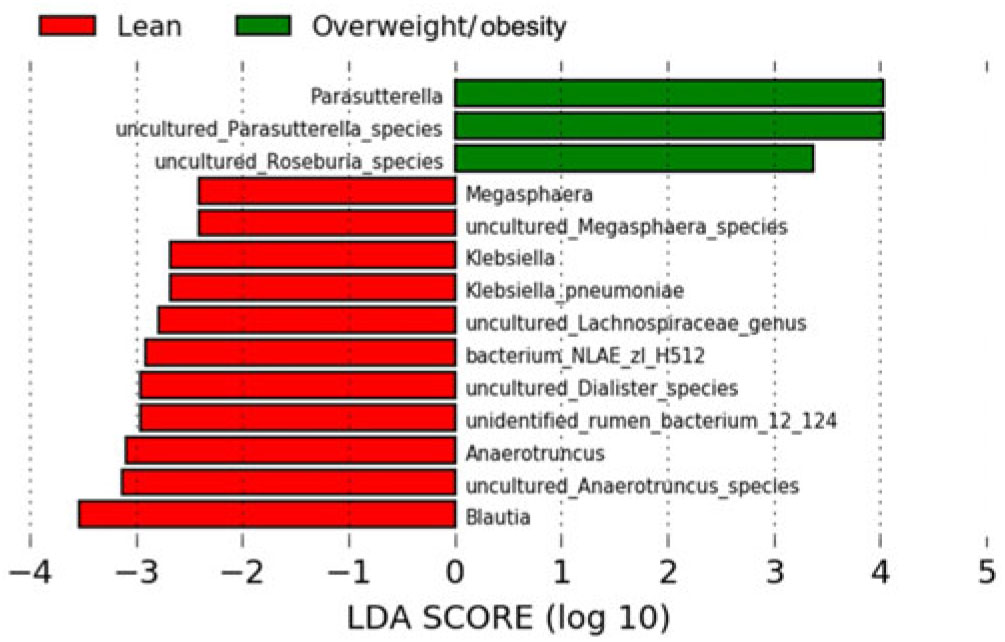
Fig. 4. Bacterial taxa differentially represented between the lean and obesity groups identified by linear discriminant analysis (LDA) effect size.
Beta diversity of gut microbiota associated with BMI
To further analyse whether the structure of the bacterial community in the gut microbiota differs among three groups, the weighted UniFrac principal coordinate analysis were analysed. No obvious separation among lean, normal and overweight/obesity groups was observed by principal coordinate analysis. The results were demonstrated by PC1, PC2 and PC3, accounting for 49·3, 16·3, 10·7 % of total variations (online Supplementary Fig. S1).
Discussion
Previous studies of obesity-associated gut microbiota mainly targeted people living in Western countries, few studies have been performed on the Chinese population. Therefore, in the present study, 16SrRNA sequencing on the Illumina MiSeq platform were used to explore the gut microbiota of lean, overweight/obese and normal-weight college students from Lanzhou University in China.
We demonstrated that the diversity of the gut microbiota was negatively correlated with BMI. That is to say, the microbial community of overweight/obese people was characterised by a reduced diversity. This result is consistent with the previous studies(Reference Cotillard, Kennedy and Kong40–Reference Turnbaugh, Hamady and Yatsunenko42). Also, in another study, Andoh et al.(Reference Andoh, Nishida and Takahashi43) conducted 16S rRNA sequencing on faecal samples of ten obese and ten lean Japanese volunteers, which used the same sample size as we did, and found that the Shannon diversity index was significantly higher in the lean group compared with the obese group, indicating that the faecal microbial structure of lean people was more complex as compared with the obese people. It has been reported that diet is the main factor affecting the diversity of intestinal flora(Reference Rothe and Blaut44,Reference Wu, Bushmanc and Lewis45) , which account for 57 % of the total structural variation in gut microbiota(Reference Zhang, Zhang and Wang46). Overall, we found gut microbial diversity was different among three groups and decreased with the increase in BMI. Although microbial richness decreased in the overweight/obese group, it was not statistically significant. However, other studies drew different conclusions regarding the microbial richness(Reference Cotillard, Kennedy and Kong40,Reference Le Chatelier, Nielsen and Qin47) . Le Chatelier et al.(Reference Le Chatelier, Nielsen and Qin47) found that obese individuals with low gut microbial richness tended to present with dysmetabolism including insulin resistance, high fasting serum TAG and LDL-cholesterol and tended to have low-grade inflammation.
Analysis on the distribution of gut microbiota among three groups showed that the dominant bacterial phyla of all subjects are the Firmicutes and the Bacteroidetes, and there was no statistical difference in the distribution of the two phyla among the three groups, which was similar to some studies(Reference Duncan, Lobley and Holtrop25,Reference Jumpertz, Le and Turnbaugh48–Reference Haro, Rangel-Zuniga and Alcala-Diaz50) . However, a number of studies showed different results. It has been reported that in obese people, the abundance of the phylum Firmicutes increased while the abundance of the Bacteroidetes decreased(Reference Turnbaugh, Ley and Mahowald23,Reference Ley, Turnbaugh and Klein51,Reference Furet, Kong and Tap52) , whereas Schwiertz et al. suggested that overweight individuals had a lower abundance of Firmicutes compared with lean controls(Reference Schwiertz, Taras and Schafer24). Although several research suggested that the increase in the Firmicutes and the decrease in the Bacteroidetes are associated with the occurrence of obesity(Reference Turnbaugh, Ley and Mahowald23,Reference Ley, Backhed and Turnbaugh53) , the need for focusing more on specific species belonging to these two phyla rather than just comparing them at the phyla level was emphasised in some studies(Reference Cani, Osto and Geurts54,Reference Kallus and Brandt55) . In our study, although no difference in the distribution of gut microbiota was shown at the phyla level, the distribution of the two genera (Blautia and Anaerotruncus) and one species (uncultured bacteria from Anaerotruncus genus) which all belonged to the phylum Firmicutes was higher in lean group compared with the overweight/obese group. Further analysis was conducted for the ratio of Firmicutes:Bacteroidetes, and no significant difference was observed in our study. To further verify our results, we analysed the distribution of the two phyla as well as their abundance ratio with real-time PCR and obtained the same result. Consistent with our results, one study also did not observe significant differences in Firmicutes:Bacteroidetes ratio between the normal-weight group and the obese group(Reference Zhang, DiBaise and Zuccolo56). And similar results have been reported by Andoh et al. and Haro et al.(Reference Andoh, Nishida and Takahashi43,Reference Haro, Rangel-Zuniga and Alcala-Diaz50) . Contradictory studies on the Firmicutes:Bacteroidetes ratio at the phyla of the gut microbiota were also reported(Reference Kasai, Sugimoto and Moritani22,Reference Ley, Turnbaugh and Klein51) . A higher Firmicutes:Bacteroidetes ratio was reported to be associated with obesity due to the increased generation of SCFA(Reference Santacruz, Collado and Garcia-Valdes57). However, both phyla Firmicutes and Bacteroidetes can produce SCFA by fermenting the fibre in the diet(Reference Baothman, Zamzami and Taher58). And using the mouse model, Murphy et al. studied the relationship between intestinal microbial composition and energy harvesting capacity. Their results showed that the distribution of microbial phyla is independent of intestinal SCFA concentration and energy harvest(Reference Murphy, Cotter and Healy59). And Duncan et al. highlighted that the Bacteroidetes:Firmicutes ratio plays no important role in human obesity(Reference Duncan, Lobley and Holtrop25). Possible explanations for these discrepancies between the results of various studies may include species difference, cohort size, ethnic differences in physiology and analytic methods.
Our results also discovered that the abundance of Porphyromonadaceae, Acidaminococcaceae, Rikenellaceae, Desulfovibrionaceae, Blautia, Anaerotruncus, Parabacteroides, Alistipes and uncultured bacteria (Anaerotruncus and Bacteroides genera) were in a linear relationship with BMI. Moreover, LEfSe showed that a variety of intestinal genera and species were enriched in lean group and overweight/obesity group, respectively, and the linear discriminant analysis score of Blautia, Anaerotruncus and its uncultured species, Parasuterella and its uncultured species was higher than 3. A study indicated that the abundance of the Firmicutes family Ruminococcaceae, Bacteriodetes family Rikenellaceae and Porphyromonadaceae, Firmicutes genus Blautia and Bacteriodetes genus Parabacteroides were increased in rats fed a high-fat diet, which suggested a link between these intestinal microbes and metabolism(Reference Lecomte, Kaakoush and Maloney60). Moreover, a study revealed reduced weight gain and metabolic improvement in diet-induced obese mice after vancomycin intervention, and several taxa changed in relative proportions during this intervention including Porphyromonadaceae, Rikenellaceae, Desulfovibrionaceae, etc. at family level and Blautia, etc. at the genus level(Reference Clarke, Murphy and O’Sullivan61).
Our study showed that Blautia was negatively correlated with BMI and was enriched in lean people. Zhu et al. detected a decreased abundance of Blautia in obese children, whether with or without nonalcoholic steatohepatitis(Reference Zhu, Baker and Gill62). Another study also observed that Blautia decreased in men with BMI greater than 33 kg/m2, which was in good agreement with our result(Reference Haro, Rangel-Zuniga and Alcala-Diaz50). Moreover, Jeffrey et al. demonstrated that children born to obese mothers v. non-obese mothers had a lower Blautia spp. and Eubacterium spp.(Reference Galley, Bailey and Kamp Dush63) A study developed a new therapeutic agent berberine compounds and determined their anti-hyperlipidaemia activity, it revealed that the berberine compound treatment also resulted in an enrichment of beneficial bacteria (e.g. Bacteroides, Blautia) with the decrease in hyperlipidaemia(Reference Li, Shu and Xu64). The genus Blautia is classified as follows: family – Lachnospiraceae, order – Clostridiales, class – Clostridia and phyla – Firmicutes(Reference Liu, Finegold and Song65), which was known as SCFA producer(Reference Zhang, Zhao and Xu39,Reference Duncan, Barcenilla and Stewart66) . SCFA-producing bacteria have been previously shown to benefit the host through protecting the mucosa from damage induced by pathogens, supplying colonocyte nutrients, mitigating inflammation, etc.(Reference Maslowski, Vieira and Ng67,Reference De Filippo, Cavalieri and Di Paola68) Decrease in such bacteria has been commonly observed in metabolic diseases such as type 2 diabetes(Reference Qin, Li and Cai12). However, it still remains ambiguous whether SCFA contribute to or rather prevent obesity development because SCFA are not only determined by SCFA-producing bacteria but also dietary fibre. Therefore, the exact association between SCFA-producing bacteria, SCFA and BMI needs further investigation. All in all, our results were consistent with the hypothesis that gut microbiota composition was related to BMI, and further study is needed to better understand the role of gut microbiota in obesity.
Cross-sectional study is a kind of descriptive study. It could describe the present situation and help to find out clues to the aetiologies. However, one limitation of cross-sectional study is that it fails to demonstrate the chronological order of causes and consequences. For the present study, we cannot determine whether BMI caused the changes in gut microbiome or whether gut microbiome caused the changes in BMI. On one hand, there is growing evidence that the gut microbiota plays an important role in the development of obesity. Backhed et al. first found that compared with germ-free mice, conventionally raised mice contain 42 % more total body fat, even germ-free mice eat more. What is more, for adult germ-free mice, which received microbiota from the distal intestine (caecum) of conventionally raised mouse, their body fat increased rapidly, accompanied by insulin resistance(Reference Bäckhed, Ding and Wang10). The possible explanation is that particular microbes from gut microbiota could affect energy acquisition and fat storage by fermenting SCFA. However, on the other hand, BMI may also modulate the gut microbiota. Both rapid weight loss due to a very low-energy diet and weight loss due to bariatric surgery can change the characteristics of intestinal flora(Reference Aleman, Bokulich and Swann69,Reference Liu, Hong and Xu70) . And one research demonstrated that high-fat diet, which may lead to obesity, could cause a significant increase in bile acid in mice gut, followed by changes in the composition of gut microbiota(Reference Zheng, Huang and Zhao71). A number of studies showed that dietary factors and lifestyles may also influence the composition of intestinal flora. David et al.(Reference David, Maurice and Carmody72) showed that both animal-based diet and plant-based diet could rapidly alter microbial community structure. Another study performed on mice demonstrated that dietary changes could explain 57 % of the total structural variation in gut microbiota(Reference Zhang, Zhang and Wang46). Moreover, physical exercise could alter the diversity and composition of intestinal flora of rats(Reference Petriz, Castro and Almeida73). Therefore, it has been confirmed that some confounding variables such as diet and lifestyle may affect the results in the present study, and further multivariate analysis is required to explore their contribution to gut microbiota. And prospective cohort study and randomised controlled trial should also be used in future studies to further confirm causality.
Our study explored the association between BMI and gut microbiota in twenty-eight healthy Chinese college students using NGS. We recruited men as our participants, which eliminated a confounding factor, sex. However, some limitations still existed in the present study. We may not have had a sufficient sample size to detect small differences in taxonomy, but the results were consistently significant among three groups. And in some of the articles(Reference Yasir, Angelakis and Bibi41,Reference Andoh, Nishida and Takahashi43) we quoted, the same sample size (nine or ten in each group) was used as we did and significant results were obtained. And since no females were included in the study, the confounding factor of sex is eliminated; and hence, further investigations involving women and a larger sample size are needed to confirm these results. Another limitation is that smoking and drinking were pooled together as one variable, which is probably not clear enough to combine the effect of both factors.
In conclusion, to the best of our knowledge, this is the first report to study the relationship between gut microbiota composition and BMI according to Chinese BMI categorisation. We found that microbial diversity and gut microbiota composition were associated with BMI, and a variety of gut microbial genera and species were enriched in lean group and overweight/obesity group, respectively. The discrepancy between our study and other reports may be due to the various factors such as differences in BMI categorisation, cohort size and environmental factors. And the function and role of some specific gut microbiota are still unknown, which remain to be studied in the future.
Acknowledgements
We thank the twenty-eight donors who contributed stool samples to this project.
This research was supported by the National Natural Science Foundation of China (81501734), the Foundamental Research Funds for Central Universities (lzujbky-2015-260) and Undergraduate Research Experience Program grant (201610730163) from the China National Research fund.
X. W. was in charge of the interpretation of the results and manuscript editing. Y. L., X. Q., H. J., S. C. and W. S. performed the experiments. Y. L. and X. Q. were responsible for the analysis of data, interpretation of the results and writing the manuscript. All authors had responsibility for the literature search, performing real-time -PCR analyses, sequence comparisons and revisions of the article. All authors approved the final version of the manuscript.
The authors declare that there are no conflicts of interest.
Supplementary material
For supplementary material/s referred to in this article, please visit https://doi.org/10.1017/S0007114519001909


