


Breast-feeding v. infant milk formula (IMF) feeding is epidemiologically associated with a lower incidence of childhood, adolescent and adulthood obesity(Reference Arenz, Ruckerl and Koletzko1,Reference Gillman, Rifas-Shiman and Camargo2) . The difference in obesity incidence could, in part, be due to (metabolic) ‘programming’, a stimulus/insult during a critical or sensitive window of development, with long-term (even lifelong) effects on an organism(Reference Koletzko, von Kries and Monasterolo3–Reference Lucas5). Distinct compositional or physicochemical differences between human milk and formulae have been suggested to underlie the observed long-term differences in body weight (BW) and fat mass gain(Reference Teller, Schoen and van de Heijning6,Reference Bourlieu and Michalski7) . A major difference between human milk and IMF, potentially relevant for metabolic programming, concerns the emulsification characteristics of the (milk) fat. Fat provides the largest fraction (50 %) of energy in human milk and also supplies essential building blocks for growth and development(Reference Andreas, Kampmann and Mehring Le-Doare8). Fat in human milk is present as an emulsion of fat (globules) in water. In native human milk, the fat globules are emulsified by the milk fat globule membrane (MFGM)(Reference Gallier, Vocking and Post9). The MFGM consists of a unique tri-layer phospholipid membrane(Reference Gallier, Vocking and Post9), extensively reviewed by Patton & Keenan(Reference Patton and Keenan10). Human milk fat globules have a mode diameter (the diameter most abundant by particle volume) of approximately 3–5 µm(Reference Andreas, Kampmann and Mehring Le-Doare8,Reference Patton and Keenan10) . The physicochemical structure of milk fat globules (the MFGM, i.e. its phospholipid membrane and large diameter) modulates gastrointestinal lipolysis, postprandial lipaemia and, to some extent, the postabsorptive metabolism of absorbed fats(Reference Bourlieu and Michalski7,Reference Werner, Havinga and Perton11,Reference Martins, Mortimer and Miller12) .
Infant formulae contain adequate amounts of essential nutritional components for growth and development(Reference Ahern, Hennessy and Ryan13). Nevertheless, the biochemical and physicochemical composition of infant formulae has continued to be an area of research and innovation, primarily aimed to further ‘humanise’ infant formulae(Reference Ahern, Hennessy and Ryan13). Most infant formulae contain lipids from vegetable sources, which are primarily emulsified by protein aggregates, do not contain MFGM and have much smaller fat globules with a mode diameter of 0·2 µm in diameter(Reference Michalski, Briard and Michel14,Reference Baars, Oosting and Engels15) . When the physicochemical structure of MFGM is mimicked in an experimental IMF (eIMF) and fed to mice in early life, these mice gain less BW and fat mass when challenged with a Western-style diet later in life, when compared with mice fed a control IMF (cIMF)(Reference Baars, Oosting and Engels15–Reference Ronda, van de Heijning and de Bruin18). The eIMF is a concept IMF with large, phospholipid-coated lipid droplets (mode diameter 3–5 μm; Nuturis®)(Reference Gallier, Vocking and Post9). BW gain is not different from controls during early-life IMF feeding(Reference Ronda, van de Heijning and de Bruin18). Upon prolonged exposure to a Western-style diet, the beneficial effects of eIMF on BW and fat mass gain diminish over time, indicating the limits of early-life programming in a challenging later-life environment(Reference Ronda, van de Heijning and de Bruin18). The transient nature implies that the capability to gain BW and fat mass is not permanently affected. Thus, the lower BW and fat mass gain may be due to a less positive energy balance, instead of permanently impaired capacity to store lipids per se.
The beneficial effects of MFGM-enriched infant formulae on BW and fat mass gain are only observed when adding MFGM as a coating to IMF containing large lipid globules and not upon adding MFGM as a coating to IMF containing small lipid globules(Reference Baars, Oosting and Engels15). The beneficial effects on BW and fat mass gain are also not found upon adding phospholipids in their free form(Reference Schipper, Abrahamse and Kegler19). Distinct physicochemical differences may thus underlie the observed long-term effects on BW and fat mass gain. In rats, gavage of human milk, v. formula, leads to a more rapid chylomicron (CM) production(Reference Vurma, DeMichele and Tso20). Breastfed infants, v. formula-fed infants, have a higher TAG:apo B48 ratio, suggesting that the CM are larger in volume and carry a larger fat load in these infants(Reference Teller, Schoen and van de Heijning6). Thus, differences in physicochemical structure may result in different rates of lipid uptake: lipids from human milk could be more rapidly absorbed than infant formulae. In adulthood, the rate of fat absorption is related to the postabsorptive trafficking and the metabolic ‘fate’; rapid absorption leads to higher β-oxidation rates at the expense of lipid storage(Reference Vors, Pineau and Gabert21). This could imply that, in adulthood, rapid fat absorption leads to rapid lipoprotein lipase (LPL)-mediated hydrolysis and tissue uptake of CM-TAG. Likely, CM particle diameter will be larger upon a high rate of fat absorption compared with a low rate of fat absorption(Reference Vors, Pineau and Gabert21).
Based on these considerations, we hypothesise that early-life eIMF v. cIMF feeding differentially programmes the rate of absorption and/or postabsorptive trafficking of fat in later life(Reference Teller, Schoen and van de Heijning6,Reference Martins, Mortimer and Miller12,Reference Vors, Pineau and Gabert21,Reference Naito and Wisse22) . In obese v. control subjects, the activity of the rate-limiting enzyme for the tissue uptake and storage of absorbed lipids (lipoprotein lipase) in adipose tissue is higher(Reference Schwartz and Brunzell23). It is not well understood in which external factors influence the tissue uptake and storage of absorbed lipids, when the dietary lipids have identical properties. We speculate that these factors may be the diet (i.e. a high- or low-fat diet (HFD or LFD, respectively)), the amount of energy intake or the adiposity (i.e. the amount of adipose tissue). We incorporated both aspects into our experimental design. In this study, we tested the hypothesis in HFD (obesogenic) and LFD (non-obesogenic) conditions. Here, we consider an obesogenic condition one wherein excess BW and fat mass accumulates or is maintained. In previous works, we noted that BW and adiposity were similar between eIMF and cIMF at postnatal (PN) day 70, after which eIMF-fed mice gained less BW and fat mass(Reference Ronda, van de Heijning and de Bruin18). To disentangle the possible immediate effects of the IMF diets, the effect of BW or fat mass, and the programming effect, we chose a time point immediately prior to the observed divergence in BW and fat mass: PN day 63–70. We tested the hypothesis by quantifying the rate of fat absorption and the postabsorptive lipid trafficking in mice that were fed eIMF or cIMF in early life, followed by either a LFD or a HFD into adulthood.
Materials and methods
Animals and study design
Experimental procedures were approved by an external independent animal experiment committee (CCD, Central Animal Experiments Committee, The Netherlands), after positive advice by the Committee for Animal Experimentation of the University of Groningen. Subsequently, the study design was approved by the local Animal Welfare Body. Procedures complied with the principles of good laboratory animal care following the European Directive 2010/63/EU for the use of animals for scientific purposes. All animals were kept in the same temperature-controlled room (20–22°C, 45–65 % humidity, lights on 08.00–20.00 hours) in type 1L (360 cm2) polysulfone cages bearing stainless-steel wire covers (UNO BV), with wood shaving bedding, Enviro-dri® (TecniLab) and cardboard rolls. All mice were handled by the same researcher. Virgin C57BL/6JOlaHsd breeders (34 M, 80 F) 10–12 weeks of age (Envigo) were mated(Reference Oosting, Kegler and Wopereis16) in 2–3 F + 1 M groups. Males were removed after 2 d. Pregnancy was confirmed by a >2 g increase in BW after 1 week and occurred in fifty-four females in total. Non-pregnant females were mated again for a maximum of four times. Delivery day was recorded as PN day 0. Pups were randomised between dams, and litters were culled to 4 M + 2 F on PN day 2. Male offspring were weaned at PN day 21 and housed with siblings in pairs. The diets were provided as freshly prepared ‘dough balls’ (40 wt% water, prepared and exchanged daily) from PN days 16 to 42(Reference Oosting, Kegler and Wopereis16,Reference Oosting, van Vlies and Kegler17) . This study was not blinded; diets were visually distinct. Breeders and female offspring were euthanised (CO2) at weaning and were not further used in this study. From PN42 onwards, mice were fed a LFD (16 % energy from fat, D10012G, Research Diets), or a HFD (45 % energy from fat, D12451 Research Diets Inc.) and tap water ad libitum. Euthanasia was performed between PN days 63 and 70. Online Supplementary Fig. S1 shows a visual representation of the study design.
Programming diets
Two IMF powders (Nutricia Cuijk B.V.) were used. The IMF powders had a similar macro- and micronutrient content (Table 1); both lipid moieties comprised about 50 % vegetable oil and 50 % milkfat and had a similar fatty acid profile (Table 2). The programming diets were created by mixing 71·77 % of a fat-free American Institute of Nutrition (AIN)-93 G-compliant diet with 28·23 % of IMF powders. The resulting mixture was AIN-93 G compliant. Diet designs are explained in more detail elsewhere(Reference Gallier, Vocking and Post9). IMF powders (283 g/kg feed) were supplemented with protein and carbohydrate (ssniff-Spezialdiäten GmbH) to obtain AIN-93G-compliant diets, with a fat moiety (approximately 7 wt%) derived entirely from IMF(Reference Reeves, Nielsen and Fahey24).
Table 1. Composition of the diets*
(Mean values and standard deviations; percentages)
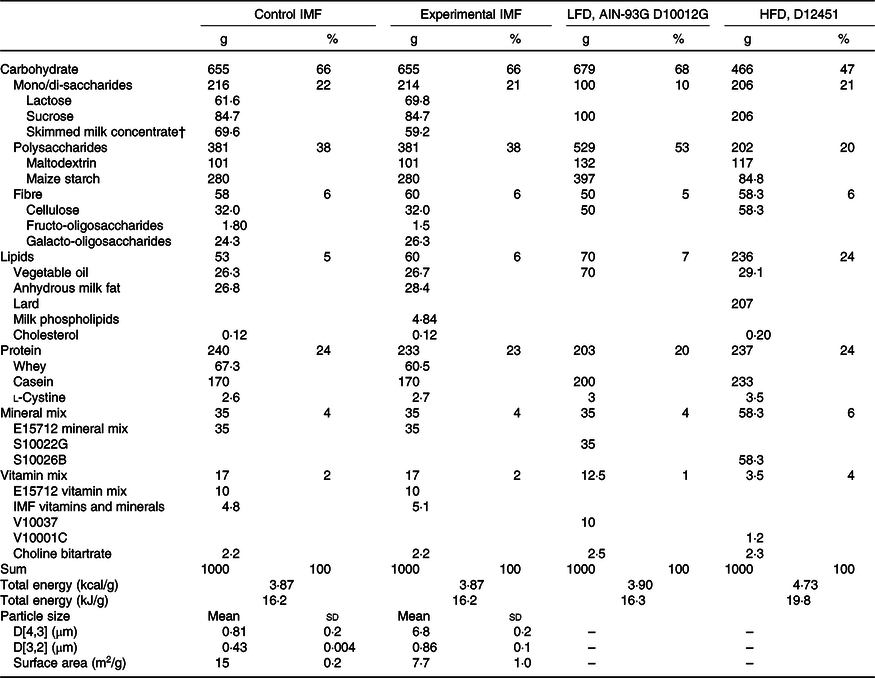
IMF, infant milk formula; LFD, low-fat diet; AIN, American Institute of Nutrition; HFD, high-fat diet; PN, postnatal.
* Calculated nutrient composition (in g/kg) of the programming diets (PN days 16–42) and the low-/high-fat diet (PN days 42–70). The programming diets were created by mixing 71·77 % of a fat-free AIN-93 G-compliant diet with 28·23 % of IMF powders. The resulting mixture was AIN-93 G compliant, and its lipid fraction was fully derived from IMF lipids.
† Skimmed milk concentrate is an ingredient of the IMF and is primarily composed of lactose and milk protein with minor amounts of milk fat.
Table 2. Fatty acyl chain composition of the diets*
(Percentages)
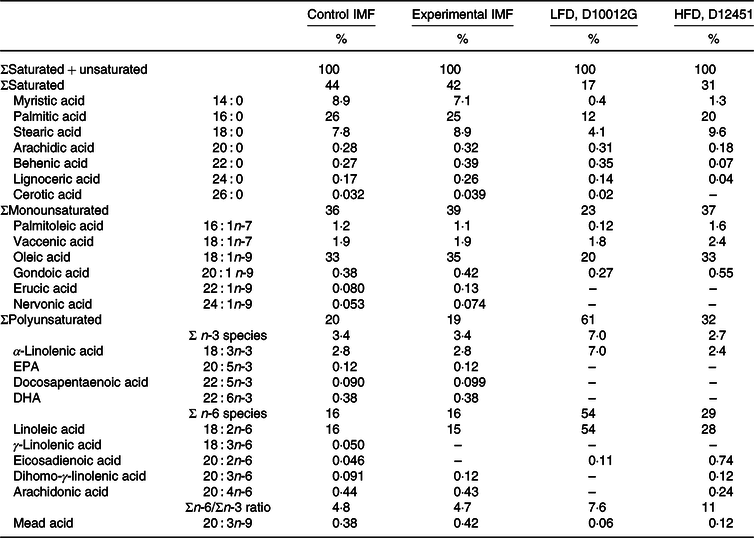
IMF, infant milk formula; LFD, low-fat diet; HFD, high-fat diet; PN, postnatal.
* Fatty acid composition (expressed as the % of total fatty acyl moieties) of the programming diets (PN days 16–42) and the low-/high-fat diet (PN days 42–70), as measured by fatty acyl chain profiling.
Body composition
Lean and fat mass were quantified by time-domain NMR (LF90II, Bruker Optics) not requiring fasting or anaesthesia, as previously described(Reference Ronda, van de Heijning and de Bruin18).
Euthanasia
For reasons of clarity, procedures for euthanasia are described per experiment.
At PN day 21: Unfasted male offspring were anaesthetised (isoflurane/O2) (during light phase; at 09.00 hours) and killed by heart puncture to obtain a blood sample.
At PN day 42: Mice were anaesthetised (isoflurane/O2) after a 4-h fasting period (during light phase; from 09.00 to 13.00 hours) and killed by heart puncture to obtain a blood sample.
Between PN days 63 and 70:
LFD-plasma: Upon intraperitoneal injection of the LPL inhibitor poloxamer-407 (1 g/kg BW, BASF Corp., in approximately 200 µl sterile PBS solution), fasting mice (midnight to 09.00 hours) were intragastrically administered at t = 0 h a lipid bolus (100 µl) containing 25 % olive oil, 75 % medium-chain TAGS oil, 1 mg triolein-1,1,1-13C3 and 1 mg oleic acid-9,10-2H2. Blood was drawn at t = 0, 1, 2, 3 and 5 h in heparinised haematocrit capillaries (Vitrex).
LFD-organ: Fasting mice (midnight to 09.00 hours) were intragastrically administered at t = 0 h a lipid bolus (100 µl) containing 25 % olive oil, 75 % medium-chain TAG oil, 10 mg triolein-1,1,1-13C3 and 1 mg oleic acid-9,10-2H2. Tissues were collected at t = 4 h.
HFD-plasma: Upon intraperitoneal injection of the LPL inhibitor poloxamer-407 (1 g/kg BW in approximately 200 µl sterile PBS), fasting mice (midnight to 09.00 hours) were intragastrically administered at t = 0 h a lipid bolus (100 µl) containing 25 % olive oil, 75 % medium-chain TAG oil, 1·7 mg triolein-1,1,1-13C3, 1 mg oleic acid-9,10-2H2, 1·9 mg palmitic acid-1,2,3,4-13C4 and 4·9 mg stearic acid-1-13C. Blood was drawn at t = 0, 1, 2, 3 and 5 h in heparinised haematocrit capillaries.
HFD-organ: Fasting mice (midnight to 09.00 hours) were intragastrically administered at t = 0 h a lipid bolus (100 µl) containing 25 % olive oil, 75 % medium-chain TAG oil, 9·4 mg triolein-1,1,1-13C3, 7·9 mg oleic acid-9,10-2H2, 2·4 mg palmitic acid U-13C16 and 4·8 mg stearic acid-1-13C. Tissues were collected at t = 4 h.
At dissection, mice were anaesthetised (isoflurane/O2) and killed by heart puncture for collection of a blood sample. Tissues were snap-frozen in liquid N2. Blood samples were spun down at 1300 g for 15 min.
Stable isotope-labelled triolein (13C) and oleic acid (2H) were purchased from Cambridge Isotope Laboratories, Inc. Stable isotope-labelled palmitic acid-1,2,3,4-13C4 and stearic acid were purchased from ISOTEC. Stable isotope-labelled palmitic acid U-13C16 was purchased from CorTecNet.
Assays
Plasma was analysed using commercially available kits for TAG (Roche; catalogue no. 11877771216), total cholesterol (Roche, catalogue no. 11491458 216), free cholesterol (FC, Spinreact; catalogue no. 41035), NEFA (Sopachem; catalogue no 157819910935) and phospholipids (Sopachem; catalogue no. 157419910930). Esterified cholesterol was calculated as the difference between total and FC.
Plasma bile acids
Plasma bile acid species were quantified from 25 µl plasma samples using LC-MS, as previously described(Reference Nagy, van Montfoort and Dikkers25). To 25 µl of plasma, we added a mixture of internal standards (stable isotope-labelled bile acids) in methanol. Samples were centrifuged at 15 800 g , and the supernatant was transferred and evaporated at 40°C under a stream of N2. Samples were reconstituted in 200 µl methanol:water (1:1), mixed and centrifuged at 1800 g for 3 min. The supernatant was filtered using a 0·2 µm spin filter at 2000 g for 10 min. Filtrates were transferred to vials, and 10 µl was injected into the LC-MS/MS system. The system consisted of a Nexera X2 Ultra HPLC system (SHIMADZU) and coupled to a Sciex Qtrap 4500 MD triple quadrupole mass spectrometer (SCIEX). Bile acids were separated with an ACQUITY UPLC BEH C18 Column (1·7 µm × 2·1 × 100 mm) equipped with an ACQUITY UPLC BEH C18 VanGuard Pre-Column (1·7 µm × 2·1 × 5 mm) (Waters). Data were analysed with Analyst MD 1.6.2 software.
Fatty acyl chain profiling
Cryogenically crushed tissues were homogenised in Potter-Elvehjem tubes in PBS solution. A known quantity of tissue was transferred to glass tubes, capped with silicone–PTFE septum screw caps. Cryogenically crushed adipose tissue was homogenised in Dounce tubes in chloroform:methanol (ratio 2:1), a known quantity of tissue transferred to glass tubes and dried under a stream of N2 at 45°C. Lipids from a known quantity of plasma, tissue or food were trans-methylated at 90°C for 4 h, liquid–liquid extracted twice using hexane, transferred to a clean tube, dried at 45°C under a stream of N2, dissolved in hexane and transferred to GC vials with inserts. Samples were analysed by GC and MS as previously described(Reference Verkade, Hoving and Muskiet26,Reference Bandsma, Wiegman and Herling27) . The GC system consisted of 6890N network GC (Agilent Technologies) and was equipped with a HP-ULTRA 1 (50 m length × 0·2 mm diameter, 0·11 µm film thickness, Agilent) column. The GC-MS system consisted of a 7890A GC system coupled to a 5975C mass spectrometer (Agilent) with the same HP-ULTRA 1 column and used an ammonia gas carrier. Oleate methyl ester ammonium ions were monitored at m/z 314–318, palmitate methyl ester ions were monitored at m/z 288–292 and 303–304 and stearate methyl ester ions were monitored at m/z 316–320. Ions were monitored under selected ion recording. The normalised mass isotopomer distributions measured by GC-MS (m0–mx) were corrected for natural abundance of 13C by multiple linear regression, described in more detail elsewhere(Reference Lee, Byerley and Bergner28,Reference Ronda, van Dijk and Verkade29) .
Statistical analysis
Group sizes were calculated(Reference Rosner30) based on an anticipated difference in the slope of fat absorption of 20 %, an expected spread of 17·5 % for LFD study arms. These data were obtained from previous experiments in our laboratory. HFD feeding is known to introduce additional heterogeneity(Reference Burcelin, Crivelli and Dacosta31). We chose an expected spread of 20 % for HFD study arms with α 0·05 and β 0·80. Given these numbers, we required twelve for LFD groups and sixteen for HFD groups. The sizes of groups in the lipid trafficking arm were similarly calculated to be twelve for LFD and sixteen for HFD given the same assumptions. Statistics were performed using SPSS 23 (IBM Corporation). Time series are plotted as medians and interquartile ranges. Single-time data are plotted as Tukey box plots and scatter plots. Analyses were carried out on all mice or samples whenever technically feasible, and material was available. No data were excluded. Data were tested for normality using Q-Q plots. Data which appeared normally distributed were analysed using the two-way ANOVA test, followed by Bonferroni-corrected simple main effects analyses (one-way ANOVA). Data which did not appear normally distributed were analysed using the Kruskal–Wallis H test, followed by the Dunn–Bonferroni post hoc test. Fig. 1(a), (b), (f) (FC, cholesteryl ester and NEFA) and Fig. 3 were tested parametrically. The remaining figures were tested using the mentioned non-parametric tests. P < 0·05 was considered to indicate statistical significance.
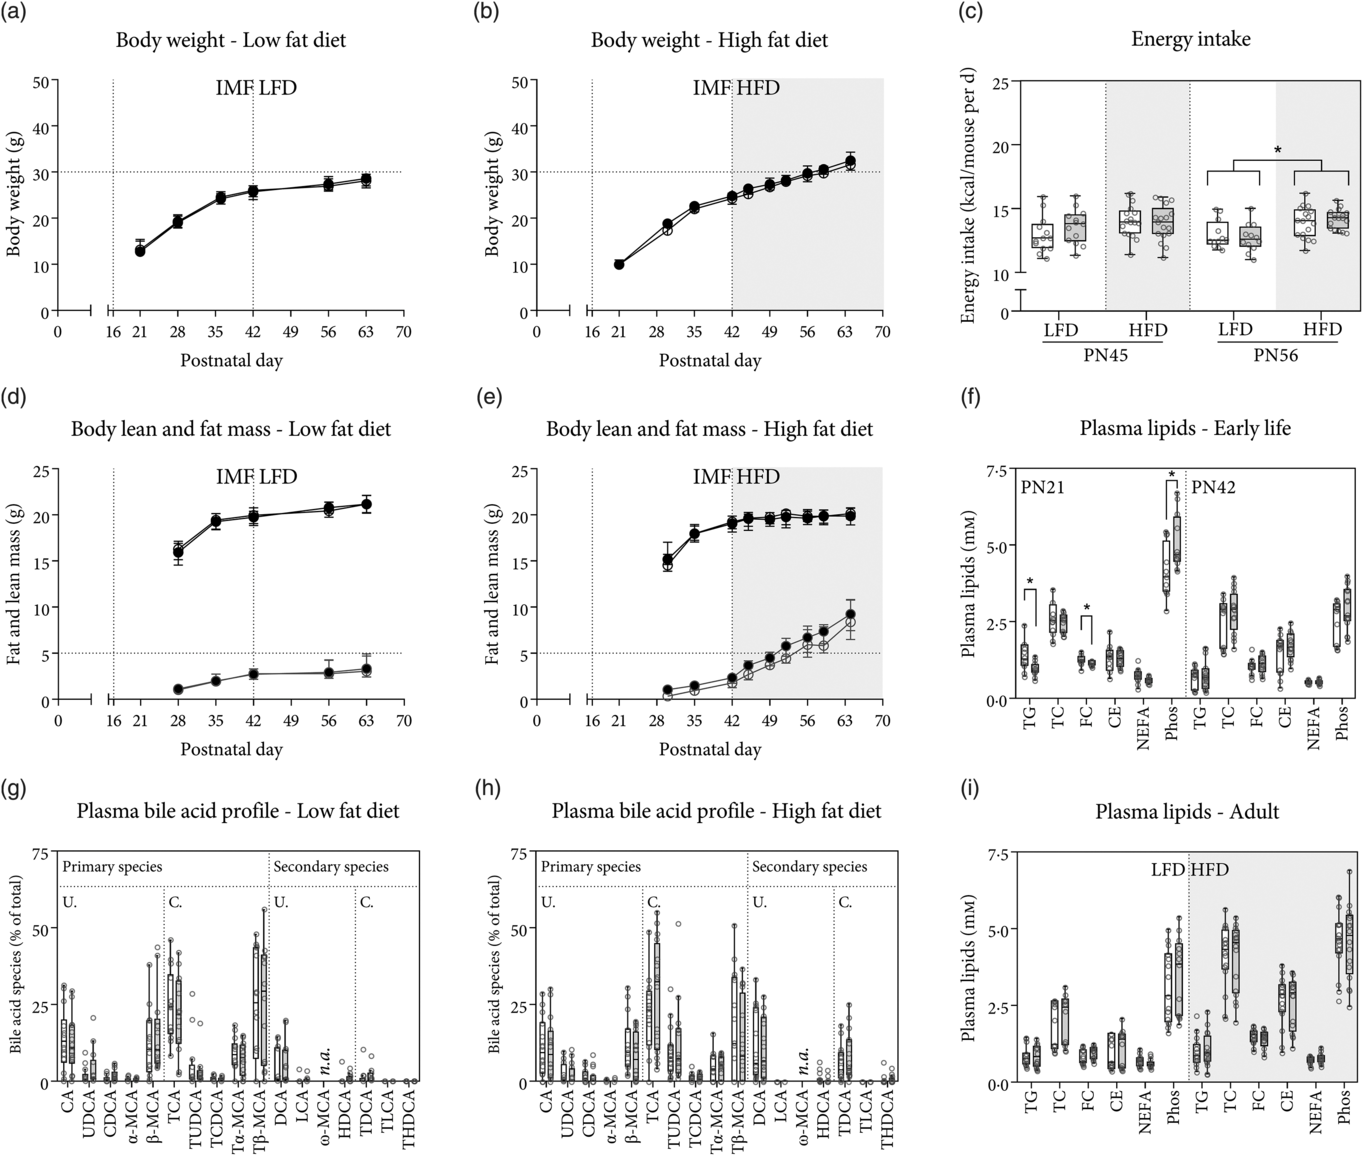
Fig. 1. Body weight, lean mass and fat mass gain in early life and during low-fat diet (LFD) or high-fat diet (HFD) feeding. Mice were fed either rodent diet made using a control infant milk formula (cIMF) or experimental IMF (eIMF) from postnatal (PN) days 16–42, and either LFD or HFD from PN days 42 to 63–70. Body weight gain on LFD (a) and HFD (b). Lean and fat mass gain on LFD (16 % energy from fat; d) and HFD (45 % energy from fat; e). Energy intake was calculated from food intake and the manufacturer’s provided energy content and shown in kcal/mouse per d for PN day 45 (left) and day 56 (right) (c). Non-fasting plasma lipids at PN day 21 (weaning) and 4 h fasted plasma lipids at PN day 42 (f) and adulthood (PN day 63–70) after LFD or HFD feeding (i). Plasma bile acid species composition in adulthood after LFD (g) and HFD (h). TC, total cholesterol; FC, free cholesterol; CE, cholesteryl esters; Phos, phospholipids; (T) (L) CA, (tauro) (litho) cholic acid; (T) (U/C/H) DCA, (tauro) (urso/cheno/hyo) deoxycholic acid; (T) (α/β/ω)-MCA, (tauro-) α/β/ω-muricholic acid; n.a., not assessed due to chromatographic issues; U./C., unconjugated/taurine conjugated bile acid species. a–i: n ≥ 12. Values represent medians and interquartile ranges (a and b, d and e – ![]() , cIMF;
, cIMF; ![]() , eIMF) or Tukey box plots and scatter plots (c, f–i –
, eIMF) or Tukey box plots and scatter plots (c, f–i – ![]() , cIMF;
, cIMF; ![]() , eIMF). Error bars are not shown when they fall within the symbol. a and b and d and e contain vertical lines at PN day 16 and 42 to illustrate the change to IMF and LFD or HFD, respectively. Horizontal dotted lines are solely for visual aid. * P < 0·05.
, eIMF). Error bars are not shown when they fall within the symbol. a and b and d and e contain vertical lines at PN day 16 and 42 to illustrate the change to IMF and LFD or HFD, respectively. Horizontal dotted lines are solely for visual aid. * P < 0·05.

Fig. 2. Plasma concentrations of absorbed fats in mice fed with rodent diet made using a control infant milk formula (cIMF) or experimental IMF (eIMF) in early life and fed a low-fat diet (LFD) or a high-fat diet (HFD) in later life. The plasma concentration of an intragastrically administered stable isotope-labelled TAG (a and b) and NEFA (c–f) is expressed as % of dose/ml plasma. Calculated linear slope for oleate from triolein (g), oleate from oleic acid (h), and palmitate and stearate from palmitic and stearic acid, expressed as % of dose/ml plasma per h. Fats were prevented from being hydrolysed and thus removed from the plasma by using a lipoprotein lipase inhibitor (Poloxamer 407; intraperitoneal 1 g/kg body weight in approximately 200 µl sterile PBS). (a–f – ![]() , cIMF;
, cIMF; ![]() , eIMF) medians and interquartile ranges. (g–i –
, eIMF) medians and interquartile ranges. (g–i – ![]() , cIMF;
, cIMF; ![]() , eIMF) Tukey box plots and scatter plots. a and d: n 11–12; b and c, e and f: n 15–16, g and h: n 11–16, I: n 15–16. Error bars are not shown when they fall within the symbol.
, eIMF) Tukey box plots and scatter plots. a and d: n 11–12; b and c, e and f: n 15–16, g and h: n 11–16, I: n 15–16. Error bars are not shown when they fall within the symbol.
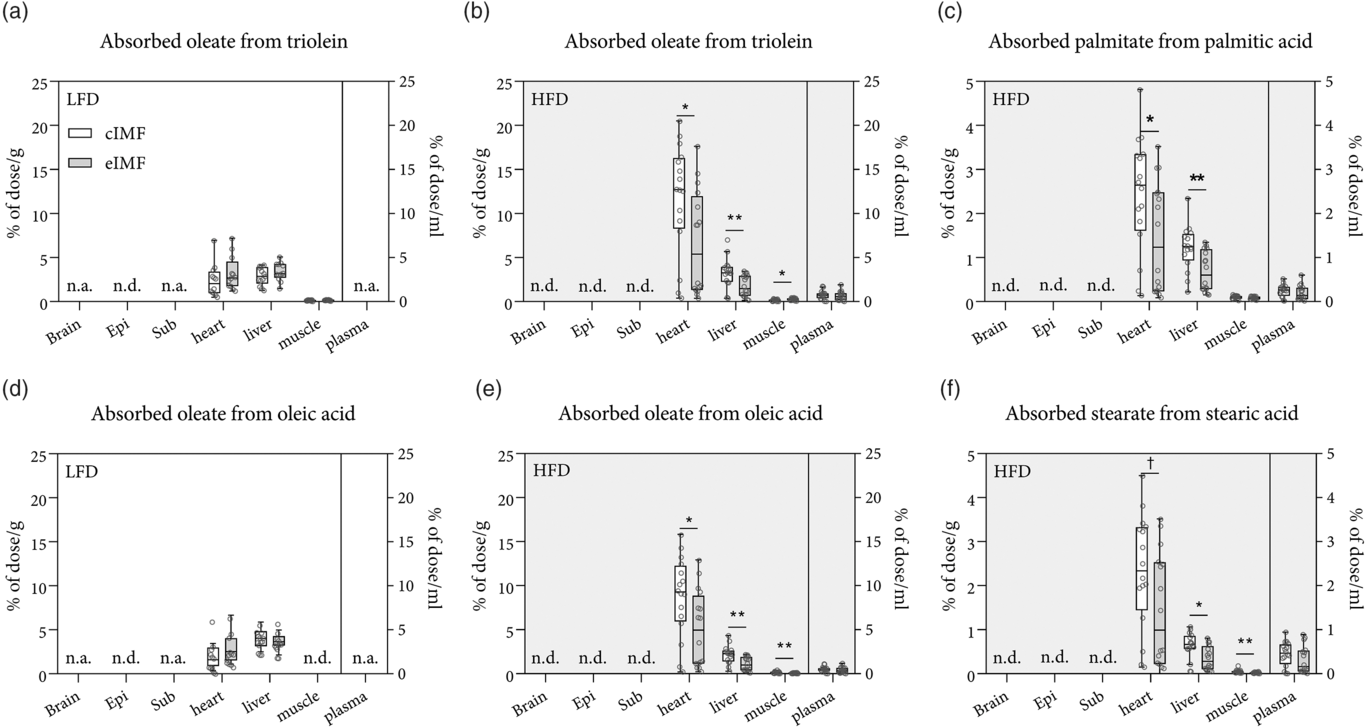
Fig. 3. Tissue concentration of absorbed fats in mice fed with rodent diet made using a control infant milk formula (cIMF) or experimental IMF (eIMF) in early life and fed a low-fat diet (LFD) or a high-fat diet (HFD) in later life. The tissue concentrations of intragastrically administered isotope-labelled TAG (a and b) and NEFA (c–f) are expressed as % of dose/g for tissues or % of dose/ml for plasma. Brain, whole brain homogenate; Epi, epididymal fat pad; Sub, subcutaneous inguinal fat pad; muscle, whole gastrocnemius skeletal muscle homogenate; plasma, heart puncture plasma sample; n.a., not assessed; ND, not detected, below detection limit. a and d: n 12–13; b and c, e and f: n 14–16. Tukey box plots and scatter plots. ** P < 0·01, * P < 0·05, † P < 0·1. (a–f) ![]() , cIMF;
, cIMF; ![]() , eIMF.
, eIMF.
Results
Early-life growth and fat mass gain upon low-fat or high-fat diet feeding
BW gain (Fig. 1(a) and (b)), as well as fat and lean mass gain on LFD and HFD (Fig. 1(d) and (e)), was similar when comparing eIMF with cIMF groups for the duration of the study. BW, lean mass and fat mass were similar between all groups at PN day 42. At PN day 56, the diet (LFD v. HFD) had a statistically significant effect on the BW (P < 0·001). During the period of IMF feeding (until PN day 42), BW were similar between eIMF and cIMF. From PN days 42 until 63, BW were similar between eIMF and cIMF. BW were higher in HFD-fed compared with LFD-fed groups for eIMF and cIMF (both +8 %, P < 0·001). At PN day 63, the diet had a statistically significant effect on the BW (P < 0·001). The IMF did not affect the BW. BW was higher (+15 and +14 %, both P < 0·001) in HFD v. LFD for eIMF and cIMF groups, respectively. There was a difference in the lean and fat mass of the four groups (LFD-cIMF, LFD-eIMF, HFD-cIMF and HFD-eIMF) at PN days 56 and 63 (both P < 0·01). Lean and fat mass were not different between eIMF and cIMF at PN days 56 and 63. At PN day 56, when comparing HFD with LFD, lean mass was lower in eIMF (–5 %, P < 0·01) but similar in cIMF-fed mice. Fat mass was higher in HFD- v. LFD-fed mice (+100 and +94 %, both P < 0·01) for eIMF and cIMF, respectively. At PN day 63, when comparing HFD with LFD, lean mass was lower for eIMF and cIMF (both approximately −6 %, P < 0·01). Fat mass (+156 and +149 %, both P < 0·01) was higher in HFD v. LFD for eIMF and cIMF, respectively. Daily energy intake at PN day 45 was similar between the four groups (Fig. 1(c)). At PN day 56, daily energy intake was different between groups (P = 0·001). Energy intake was higher in HFD-fed v. LFD-fed mice, independent of early-life feeding with eIMF or cIMF (+9 %, P < 0·05, Fig. 1(c)). Plasma lipids were compared between four groups (PN day 21 eIMF and cIMF, and day 42 eIMF and cIMF, Fig. 1(f)). There was a statistically significant difference in plasma TAG (P = 0·001) and phospholipids (P < 0·001) between these groups. At PN day 21, plasma TAG, cholesterol and phospholipids were similar between eIMF and cIMF. Plasma NEFA tended to be lower in eIMF v. cIMF, but this difference was not statistically significant (–19 %, P = 0·064). At PN day 42, plasma lipids were similar between eIMF and cIMF. Comparing PN days 42–21, plasma TAG were similar in eIMF-fed mice but lower (–51 %, P < 0·01) in cIMF. FC and cholesteryl ester levels were similar for eIMF- and cIMF-fed mice. Plasma NEFA was lower at PN day 42 compared with day 21 for eIMF (–11 %, P = 0·002) and cIMF-fed mice (–28 %, P < 0·001). Plasma phospholipids were lower at PN day 42 compared with day 21 for both eIMF (–42 %, P < 0·001) and cIMF-fed mice (–39 %, P < 0·01). In later life (approximately PN day 63), after 4 h of fasting, plasma lipids were similar between IMF groups in LFD- and HFD-fed mice (Fig. 1(i)). Comparing HFD with LFD, plasma TAG levels were similar between HFD and LFD. Plasma total cholesterol (97 and +131 %, both P < 0·001), FC (+53, and +81 % both P < 0·001) and cholesteryl ester (+135 and +173 %, both P < 0·001) were higher in HFD- v. LFD-fed mice in eIMF and cIMF groups, respectively. Plasma NEFA levels were higher in HFD v. LFD eIMF-fed mice (+27 %, P < 0·05) but similar in cIMF mice fed HFD or LFD. Plasma phospholipid levels were similar in eIMF mice fed HFD or LFD but were higher in HFD v. LFD cIMF mice (+48 %, P < 0·05, Fig. 1(i)). The relative composition of the plasma bile acid pool at PN day 63 was compared between the diets and between the IMF. The relative levels of TUDCA (P = 0·001), Tα-MCA (P = 0·039), LCA (P = 0·001), TDCA (P = 0·001), THDCA (P = 0·011) and the fractional sums of the primary and secondary (microbiome-converted) plasma bile acid species (P = 0·007) were significantly different between the four groups. Plasma bile acid species were similar between eIMF and cIMF mice in later life (Fig. 1(g) and (h)). Also, plasma bile acid species were comparable between IMF groups in early life (PN days 21 and 42, data not shown). Comparing HFD with LFD at PN day 63, it appeared that mice which were fed a HFD had a higher (approximately 2·5-fold higher in HFD v. LFD, P = 0·011) percentage of secondary bile acids species at the expense of primary bile acid species (Fig. 1(g) and (h)).
Rate of fat absorption in mice fed with experimental or control infant milk formula in early life and fed a low- or a high-fat diet in later life
We investigated whether early-life eIMF v. cIMF feeding changed the rate of fat absorption in LFD and HFD-fed mice in later life. For this, fasting mice were intraperitoneally administered a LPL inhibitor followed by an intragastrically administered lipid bolus containing stable isotope (2H or 13C)-labelled lipid tracers. Plasma concentrations of labelled oleate from administered triolein in LFD-fed mice (Fig. 2(a)) and HFD-fed mice (Fig. 2(b)) were similar between eIMF and cIMF. The calculated slopes of the administered lipids (Fig. 2(g)–(i)) did not show that there was a statistically significant difference between the diet and IMF groups. The calculated slope of plasma oleate M + 1 appearance, representing the rate of triolein absorption was similar between eIMF and cIMF fed LFD: 3·2 (sd 1·8) and 3·9 (sd 2·1) and HFD 2·6 (sd 1·7) and 3·8 (sd 3·0) % dose/ml per h (Fig. 2(g)). Plasma concentrations of administered NEFA in LFD-fed mice (Fig. 2(d)) and HFD-fed mice (Fig. 2(e)) were similar between eIMF and cIMF. The calculated slope of plasma oleate M + 2 appearance, representing the rate of free oleic acid absorption, was similar between groups (Fig. 2(h)). Also, plasma concentrations of labelled palmitate (Fig. 2(c)) and stearate (Fig. 2(f)) in HFD-fed mice were similar between eIMF and cIMF. The calculated rate of triolein and free oleic acid absorption appeared similar between HFD- and LFD-fed mice.
Tissue concentrations of absorbed fats in mice fed experimental or control infant milk formula in early life and fed a low- or high-fat diet in later life
We determined whether early-life eIMF v. cIMF feeding changed later-life postabsorptive trafficking of an identical intragastrically administered lipid bolus after LFD or HFD feeding in later life. For this, mice were intragastrically administered a lipid bolus containing stable isotope-labelled (2H and 13C) lipid tracers. Postabsorptive lipid trafficking, that is, to which tissues the administered lipids were trafficked, was assessed by collecting tissues 4 h after intragastrical bolus administration. Data were expressed as a percentage of the administered dose (Fig. 3(a)–(f)). There was a statistically significant interaction between the IMF and the diet for absorbed oleate from triolein in the heart (P = 0·025), oleate from triolein in the liver (P = 0·004), and for oleate from oleic acid in the heart (P = 0·024). The amount of absorbed oleate from triolein in HFD eIMF- v. HFD cIMF-fed mice was lower in the heart (–44 %, P < 0·01), lower in the liver (–46 %, P < 0·01) and higher in the gastrocnemius muscle (+80 %, P < 0·05). The amount of absorbed oleate from oleic acid in HFD eIMF- v. HFD cIMF-fed mice was lower in the heart (–49 %, P = 0·03), lower in the liver (–49 %, P = 0·02) and lower in the gastrocnemius muscle (–71 %, P = 0·004). The concentration of palmitate from palmitic acid in HFD eIMF- v. HFD cIMF-fed mice was lower in heart tissue (–40 %, P = 0·038), liver tissue (–44 %, P = 0·004), but similar in muscle tissue and plasma. The concentration of stearate from stearic acid in HFD eIMF- v. HFD cIMF-fed mice tended to be lower in heart tissue (–39 %, P = 0·058), but this comparison was not statistically significant. Stearate from stearic acid had a lower concentration in HFD eIMF- v. HFD cIMF-fed mice in liver tissue (–44 %, P = 0·011) and muscle tissue (–67 %, P = 0·007). When comparing HFD with LFD, the amount of absorbed oleate from triolein was higher in the heart (+107 and +396 % P < 0·001 and P < 0·05) for eIMF- and cIMF-fed mice, respectively. The amount of oleate from triolein in the liver between HFD and LFD was lower (–48 %, P < 0·01) in HFD v. LFD eIMF-fed mice but similar in HFD and LFD cIMF-fed mice. The amount of oleate from triolein in the gastrocnemius muscle was similar between HFD and LFD in cIMF- and eIMF-fed mice. The amount of absorbed oleate from oleic acid was similar between HFD and LFD eIMF-fed mice, but higher (+325 %, P < 0·001) in HFD v. LFD cIMF-fed mice. When comparing HFD with LFD, the amount of oleate from oleic acid in the liver was lower in eIMF (–71 %, P < 0·001) and cIMF (–47 %, P < 0·001)-fed mice The concentration of administered lipids in whole brain and adipose depots (epididymal adipose depot and inguinal adipose depot) was very close to or below the limit of detection. Correction for tissue protein content did not statistically change the aforementioned comparisons (data not shown).
Discussion
In this study, we tested the hypothesis that eIMF v. cIMF programmes the uptake rate and/or postabsorptive trafficking of lipids in later life. It was anticipated that adiposity and/or HFD-feeding affects the uptake rate and the storage of absorbed lipids(Reference Vors, Pineau and Gabert21,Reference Schwartz and Brunzell23) . Therefore, our study was designed to test the hypothesis in LFD and HFD conditions prior to the expected time point at which eIMF- and cIMF-programmed mice started to divergence in their adiposity(Reference Ronda, van de Heijning and de Bruin18). In previous works, we observed that the adiposity started to diverge at approximately PN day 70, that is, 28 d after commencing a HFD(Reference Ronda, van de Heijning and de Bruin18). We showed (Fig. 1) that the adiposity was similar between eIMF and cIMF mice at the time point at which we measured lipid absorption rates and lipid trafficking. We verified that bile acid composition, which can be a critical determinant for lipid absorption efficiency(Reference Hofmann32), was similar between IMF groups. As adiposity and bile acid composition are similar between eIMF and cIMF, they are unlikely to be a strong determinant for lipid absorption rate or lipid trafficking. The results in our model indicate that the rate of fat absorption in later life is not affected by early-life eIMF feeding (Fig. 2). However, our data do demonstrate that postabsorptive lipid trafficking is a trait that is modifiable by early-life feeding with eIMF (Fig. 3). It is tempting to speculate that these postabsorptive differences, which are only apparent under challenging (HFD feeding) conditions, are related to the previously observed long-term difference in BW and fat mass gain(Reference Ronda, van de Heijning and de Bruin18).
In humans, the rate of fat absorption determines, to some extent, the ‘fate’ of dietary fat, that is, storage or oxidation, especially in obese subjects(Reference Vors, Pineau and Gabert21). Fats which are rapidly absorbed are oxidised faster compared with fats which are less rapidly absorbed(Reference Vors, Pineau and Gabert21). This parameter is coined ‘lipid partitioning’. It is currently not known whether the rate of fat absorption affects the ‘destination’ of dietary fat, that is, to which tissue (such as the heart, or the liver) it is transported. We refer to this parameter as ‘lipid trafficking’. Our data indicate that the postabsorptive differences between IMF groups (under challenging HFD conditions) are likely not related to the rate of fat absorption, as plasma concentrations of absorbed fats were similar between IMF groups (Figs. 2 and 3).
It is known, at least in rats, that metabolically active tissues such as the heart, skeletal muscle and adipose tissue increase their fatty acid uptake with body adiposity(Reference Luiken, Arumugam and Dyck33). The heart, skeletal muscle and adipose tissue of obese rats display a higher fatty acid uptake rate compared with lean littermates(Reference Luiken, Arumugam and Dyck33). HFD v. LFD feeding lowers the non-fasting RER, a calculated measure obtained by dividing the exhaled quantity of CO2 by the exhaled quantity of O2 (Reference Marvyn, Bradley and Mardian34). The RER can be used to estimate the whole-body contribution of fatty acid oxidation to the total energy production as fatty acid oxidation typically requires more atmospheric oxygen per exhaled carbon dioxide volume, thereby lowering the RER(Reference Marvyn, Bradley and Mardian34). These indirect calorimetry data illustrate that fatty acid oxidation is increased by switching from LFD to HFD, which logically implies that fatty acid transport towards metabolically active tissues must also be increased. Indeed, insulin-stimulated fatty acid oxidation in the heart is >4-fold higher in HFD-fed obese mice v. LFD-fed lean mice(Reference Shearer, Fueger and Wang35), which mandates a (much) higher cardiac fatty acid uptake rate. Therefore, we consider our HFD v. LFD lipid trafficking findings to be in line with expectations and with literature.
The postabsorptive differences in concentrations of administered lipids in tissue may be caused by tissue-specific differences in LPL activity. LPL is the rate-limiting step in tissue uptake of plasma TAG and is present in the vascular bed of extrahepatic tissues including the heart, skeletal muscle and adipose tissue(Reference Bharadwaj, Hiyama and Hu36,Reference Castellano-Castillo, Moreno-Indias and Fernandez-Garcia37) . LPL is regulated at transcriptional and post-translational level(Reference Castellano-Castillo, Moreno-Indias and Fernandez-Garcia37,Reference Kersten38) . LPL has a higher binding affinity and activity for larger lipoprotein particles compared with smaller lipoprotein particles(Reference Bharadwaj, Hiyama and Hu36,Reference Xiang, Cianflone and Kalant39) . The difference in LPL’s binding affinity for small and large lipoprotein particles is not well understood and appears counterintuitive considering that surface area is usually correlated positively, and not negatively, with enzyme activity. The apparent negative correlation between LPL binding affinity and lipoprotein surface area may, however, contribute to the ability of LPL to rapidly respond to large (postprandial) variations in plasma TAG levels(Reference Vors, Pineau and Gabert21). Absorption of large amounts of fat typically results in larger CM(Reference Teller, Schoen and van de Heijning6,Reference Vors, Pineau and Gabert21) . LPL hydrolyses TAG from lipoprotein particles (including CM) resulting in NEFA. Plasma NEFA are taken up by tissues via active saturable processes (CD36) and by passive non-saturable processes (non-CD36)(Reference Bharadwaj, Hiyama and Hu36). The hydrolysis of CM-TAG eventually leads to the formation of CM remnants. CM remnants penetrate the liver sinusoidal endothelial fenestrations, bind to hepatocytes and are taken up and cleared from the plasma(Reference Crawford and Borensztajn40).
Considering the aforementioned modifiers of LPL activity, the differences in postabsorptive lipid trafficking between HFD-fed IMF groups may be due to differences in the amount of LPL protein in the various extrahepatic vascular beds per se, and/or differences in CM diameter. It is known that LPL activity is higher in adipose tissue of obese than in that of lean human subjects(Reference Schwartz and Brunzell23). Weight loss in obese subjects induces an increase in adipose tissue LPL activity, which returns to baseline activity levels upon rebound weight gain(Reference Schwartz and Brunzell23). To some extent, LPL protein levels are regulated via epigenetic means by DNA methylation of the LPL promotor region(Reference Castellano-Castillo, Moreno-Indias and Fernandez-Garcia37). The degree of LPL promotor methylation positively associates with abnormalities of the metabolic profile and basal and postprandial TAG(Reference Castellano-Castillo, Moreno-Indias and Fernandez-Garcia37). It is not known whether a relationship exists between LPL activity and whole-body energy balance per se. Though, a higher rate of lipid absorption, leading to a greater CM diameter, does result in a more rapid development of the sensation of hunger in obese human subjects and vice versa(Reference Vors, Pineau and Gabert21). This observation suggests that either LPL activity, the rate of plasma lipid disappearance and/or the rate of tissue lipid appearance may be related to the sensation of hunger(Reference Vors, Pineau and Gabert21). It is still unclear what is the cause and effect. However, if LPL activity does contribute to the sensation of hunger, then this would be an interesting parameter to explore in the context of obesity. The specific link between early-life nutrition and later-life LPL activity, if any, would be an interesting avenue to further explore in a future study.
Circulating fats enter the liver mostly via LPL-independent routes, namely via the uptake of CM remnants(Reference Crawford and Borensztajn40). We noted that, at the time of sampling, plasma levels of labelled fats were similar between HFD-fed IMF groups. It could be that labelled fats were still being absorbed from the gut, replenishing the plasma pool. Therefore, the observed lower concentrations of absorbed fats in the livers of eIMF-primed HFD-fed mice suggest that CM remnants contained less labelled TAG at the time of hepatic uptake(Reference Crawford and Borensztajn40). If this were true, it would indicate that extrahepatic tissues are more extensively hydrolysing CM-TAG in eIMF v. cIMF mice(Reference Bharadwaj, Hiyama and Hu36).
In the interpretation of our tissue data (Fig. 3), we assume that differences in tissue levels of administered fats are mostly due to differences in tissue uptake of plasma fats. Alternatively, the effects may be related to differences in β-oxidation rates between the two groups. Within the 4 h time frame, approximately 5 % of the total administered palmitate, stearate and oleate can be expected to be oxidised and thus removed from the measurable pools(Reference DeLany, Windhauser and Champagne41). Previously, it was noted that, upon a Western-style diet challenge, gene expression and protein levels of mitochondrial oxidative capacity markers were higher in skeletal muscle and adipose tissue in eIMF compared with cIMF-fed mice(Reference Kodde, van der Beek and Phielix42). These observations could indicate that part of the differences in measured labelled fats, at least in skeletal muscle tissue, is due to β-oxidation. However, given the magnitude of the differences in labelled fats (Fig. 3), we assume that the majority of the differences are due to differences in lipid trafficking, and only partially due to β-oxidation.
This study was part of a series of experiments designed to test an eIMF with a lipid structure more similar to human milk(Reference Gallier, Vocking and Post9,Reference Baars, Oosting and Engels15–Reference Ronda, van de Heijning and de Bruin18,Reference Kodde, van der Beek and Phielix42) . For bringing the eIMF to market, its safety and tolerance (in infants) must be evaluated. A recently completed trial (Dutch trial register NTR3683) and its accompanying paper found and reported that the eIMF was safe and well tolerated(Reference Breij, Abrahamse-Berkeveld and Vandenplas43). That is, the number or severity of adverse events was similar between eIMF and a commercially available cIMF(Reference Breij, Abrahamse-Berkeveld and Vandenplas43). In healthy term infants, early-life growth (i.e. daily weight gain) was equivalent between eIMF and the cIMF(Reference Breij, Abrahamse-Berkeveld and Vandenplas43). Follow-up (5 years) of infants fed eIMF in early life (Dutch Trial Register NTR5538) is expected to provide insights into BMI, and the prevalence of overweight and obesity at 3, 4 and 5 years of age. The results obtained in the present study suggest that eIMF programming may be especially relevant for groups at risk of becoming overweight in young adult life(Reference Ronda, van de Heijning and de Bruin18). Previously, we demonstrated that the effects of this early diet (eIMF v. cIMF) in our model were transient and tended to disappear after approximately PN day 130 (after 12 weeks of HFD feeding)(Reference Ronda, van de Heijning and de Bruin18). It is not clear whether the transiency of the effect is caused by the duration of the exposure to the challenging diet or by the accumulated total BW or fat mass.
Conclusion
The present study shows that when mice are fed with eIMF or cIMF in early life and fed a LFD or HFD in later life, the rate of fat absorption, upon intragastric administration of an identical lipid bolus, is similar between IMF groups. Thus, the rate of fat absorption in later life does not seem to be affected by an early-life diet containing large phospholipid-coated lipid globules (eIMF). Instead, postabsorptive lipid trafficking may, in a challenging (HFD-fed) environment, be modifiable by early-life feeding with eIMF. It is tempting to speculate that changes in postabsorptive trafficking are related to the observed effects on later-life BW and fat mass gain upon a persistent long-term obesogenic challenge.
Acknowledgements
We thank Renze Boverhof, Matilda Arvidsson Kvissberg, Mirjam Lohuis, Rima Mistry, Fan Liu, Michelle Brad, Dilys Eikelboom (Department of Pediatrics, University Medical Center Groningen) and Violeta Stojanovska (Department of Obstetrics, University Medical Center Groningen) for technical and analytical assistance.
Support for this study has been obtained from Danone Nutricia Research. The funder contributed to the study design and the preparation of the manuscript. The funder did not contribute to the conduct of the study, analysis of samples or data and interpretation of findings.
B. J. M. H., H. J. V. and O. A. H. O. R. formulated the research question and designed the study. R. H., A. J. and O. A. H. O. R. carried out the study. I. A. M., A. J., V. W. B., T. H. D., M. K. and O. A. H. O. R. analysed the data. H. J. V., F. K., E. M. B., B. J. M. H. and O. A. H. O. R. wrote the paper.
B. J. M. H. and E. M. B. are employed by Danone Nutricia Research. H. J. V. was a consultant for Danone Nutricia Research outside the submitted work, for which his institution was compensated financially. Other authors have no known conflicts of interest.
Supplementary material
For supplementary material referred to in this article, please visit https://doi.org/10.1017/S0007114520002421


 Open access