

The Chairman (Professor A. J. G. Cairns, F.F.A.): This sessional research meeting is entitled How Medical Advances and Health Interventions Will Shape Future Longevity.
I am here in my role as the director of the Actuarial Research Centre (ARC) of the Institute and Faculty of Actuaries (IFoA). In my day job I am a professor at Heriot-Watt University. As ARC director, I am supported by two associate directors, an ARC manager and three project managers at the IFoA.
One of the key roles of the ARC directors is to provide support for, and oversee progress on, the profession’s commissioned research projects.
The ARC was established in 2012 as a joint project between the IFoA and the Scottish Financial Risk Academy.
Today the ARC is a global network which delivers industry-relevant, cutting-edge research programmes that address some of the significant challenges in actuarial science through a partnership of the actuarial profession, the academic community and industry. The ARC’s current research programmes involve partnerships with institutions and organisations in North America and Europe. The IFoA is committed to further developing the ARC’s internationally relevant program of research to maximise the impact and benefits that the ARC research will bring to the global actuarial user community.
Apart from the Big Health research programme that we will hear about tonight, our current major programmes also include modelling and management of longevity and morbidity risk and optimising future pension plans.
Tonight’s sessional event is the Use of Big Health and Actuarial Data for Understanding Longevity and Morbidity Risks. This collaborative programme seeks to develop novel statistical and actuarial methods for modelling mortality, modelling trends in morbidity, assessing basis risk and evaluating longevity improvements based on big health and actuarial data.
The research programme objectives have the following aims: identifying and quantifying the key factors affecting mortality and longevity, such as lifestyle choices, medical conditions and/or interventions – we will hear of some of that tonight; modelling of temporal changes in the factors affecting morbidity and mortality; evaluating plausible scenarios in mortality trends due to particular medical advances or lifestyle changes on the population of insureds or of relevance to the actuarial community; and developing tools to forecast the longevity risk of a book based on realistic scenarios of uptake of various health behaviours and/or interventions or on particular disruptions to population health.
The multidisciplinary team is led by Professor Elena Kulinskaya at the University of East Anglia (UEA). The programme supports three PhD students in actuarial science. Professor Elena Kulinskaya is the principal investigator, and Nigel Wright is one of the research programme’s co-investigators.
The paper and the presentation show how estimated mortality hazards can be translated into hypothetical changes in life expectancies at the individual and the population levels. Typical calculations are illustrated by two examples of medical interventions and their impact on life expectancy: beta-blockers in heart attack survivors, and blood pressure treatment in hypertensive patients.
The second example also illustrates the dangers of applying the results from clinical trials to much wider real-life populations.
Professor Elena Kulinskaya is a professor of statistics at the UEA. Nigel Wright is a co-investigator for this ARC research programme. He is an actuary working in the life data science team within Aviva. He is also an Honorary Senior Lecturer at the UEA.
Professor E. Kulinskaya: My talk today will be about how to quantify longevity changes due to various medical advances. We all know that both medical and social advances are the main drivers of the increase in longevity. But the issue is whether we can say exactly how much a particular medical intervention may add to the lifespan of the population or an individual. In medicine, in principle, when something new is being introduced, first of all there is not one but several so-called randomised control trials which attempt to see the effect of a particular new medical advance.
Randomised control trials basically have, say, two arms. There will be an arm with a new treatment and an arm with the current standard treatment. Patients will be randomly assigned to these two arms. Because of this random assignment to the two arms, the idea is that randomisation takes care of all possible biases and any difference which we can see between the arms is due to the treatment alone. Randomised control trials are considered to be the gold standard in medicine.
However, eligibility for randomised control trials is usually very, very limited to people who have this particular condition but no other conditions. There are very restrictive selection criteria. Another problem with randomised control trials is that they are usually of a short duration. Funding lasts between, say, 3 and 5 years at most. No one after a clinical trial usually knows the long-term consequences and subsequent medical interventions.
If randomised control trials show that the treatment works, the next step would be to put this medical advance into practice. In the United Kingdom it would be the National Institute for Health and Care Excellence (NICE) who would decide whether this treatment will be available on the National Health Service (NHS). After that we would need a lengthy lead time to observe the effects of this new intervention on population longevity. We are trying to make this last step quicker. That is really what this is about.
So what do we do? First of all, we use a large database of primary care data called The Health Improvement Network (THIN) data. It is important that we have the data at the individual level so that, for each particular patient who comes to see their doctor over sometimes a whole lifetime of the patient, we see various conditions that patients have, various drugs that patients can take and so on. We can actually model both the uptake of medical treatment and the effect of the treatment on longevity, given particular individuals have certain social demographic factors and so on.
Usually, we would use survival models such as Cox’s regression, which I will tell you about later. We would fit it to individual level data. The conclusions from this population-based data are generalisable to the general population.
So, a bit more about the THIN data. Data collection started in 2003, covering 11 million patients, currently 3.7 million active patients. The data are collected over 562 general practices, covering approximately 6% of the UK population. It is considered to be typical of the UK population after adjustment for various social demographic characteristics.
What comes into the data are all the diagnoses, all the prescriptions, consultations, blood tests, some lifestyle factors, such as alcohol uptake or smoking, body mass index (BMI) and some socio-economic factors such as Index of Multiple Deprivation (IMD), for example, air and water quality, racial composition within a postcode and so on.
In our research we are using a particularly large subset of THIN and that is data on everyone who was born before 1960, and up to 1 January 2017. This comprises 3.5 million patients. We added three socio-economic status variables: IMD; Townsend score; and Mosaic. The Mosaic is a consumer classification by Experian, and it is pretty popular in insurance-related modelling. Multiple deprivation index and Townsend score are more popular in government statistics and social sciences.
I am going to start from our first example on beta-blockers after acute myocardial infarction. Acute myocardial infarction is a heart attack. There are 188,000 heart attacks in the United Kingdom each year. The survival rate is about 7 in 10 people. This means we have more than 900,000 people in the United Kingdom who have survived a heart attack. There are roughly twice as many males as females. So this is quite a large sub-population of people who survive heart attacks.
The research question, which was actually part of the research by my PhD student Lisanne Gitsels, was what are the survival prospects associated with a history of a single or multiple acute heart attack in the general population at various ages, and how can the survival prospects be modified by various treatments?
We published this paper in British Medical Journal Open last year. It is open access. I will start by telling you about the results of that paper, a medical paper and then we will talk about translating it into things of interest to actuaries.
First of all, how was the study on heart attacks designed? It was a population-based retrospective cohort study. At the time we used a previous subset of THIN which was a bit smaller, and that covered people who were born between 1920 and 1940. The data stopped in May 2011. Our main risk factor of interest was heart attack. We are going to tell you about one of the interventions here, beta-blockers, which is one of the possible treatments after a heart attack. We did look at others and I will mention them very briefly as well.
We looked at the four cohorts of patients who have had heart attacks before the ages of 60, 65, 70 and 75. We chose those ages because those are important ages for retirement planning. For example, a person who has had a heart attack comes to buy an annuity. How should we price that annuity?
What we have done also is to match cases to three controls from the same sex, year of birth and General Practitioner (GP) practice. We have done that because, especially in the younger ages, 55–64, say, heart attack is not very widespread. Luckily, only about 6% of men and about 2% of women have heart attacks. For every woman who had a heart attack at an early age, 98 women will not have had a heart attack.
We do not want these 98 women in our study because they will just cause too much noise. What we want is a pretty balanced study which has a ratio of cases to controls, say, 1:3, because this would allow us to look at the data in much more detail and we will not lose any efficiency in our statistical analysis.
We are very keen to match cases to control from the same GP practice because we discovered that the GP practice means a lot for your health and longevity. That has a very strong effect partly because those are people who live in the same conditions, in the same area, have the same environmental characteristics, perhaps, but also maybe the quality of their GP matters.
We followed those four cohorts until death, transfer to another GP practice or the end of our data which was 2011. Unfortunately, when people transfer out from a GP practice we lose them; we cannot follow them across practices. So at that stage cases and controls were removed.
In Figure 1 the Lexis diagram shows how our cohorts were moving across. On the X axis you will see the years that our medical records cover from 1987 to 2011. The Y axis is the ages of our patients. The four yellow lines are our four cohorts; people who have had heart attacks before 60, 65, 70 and 75 years old.
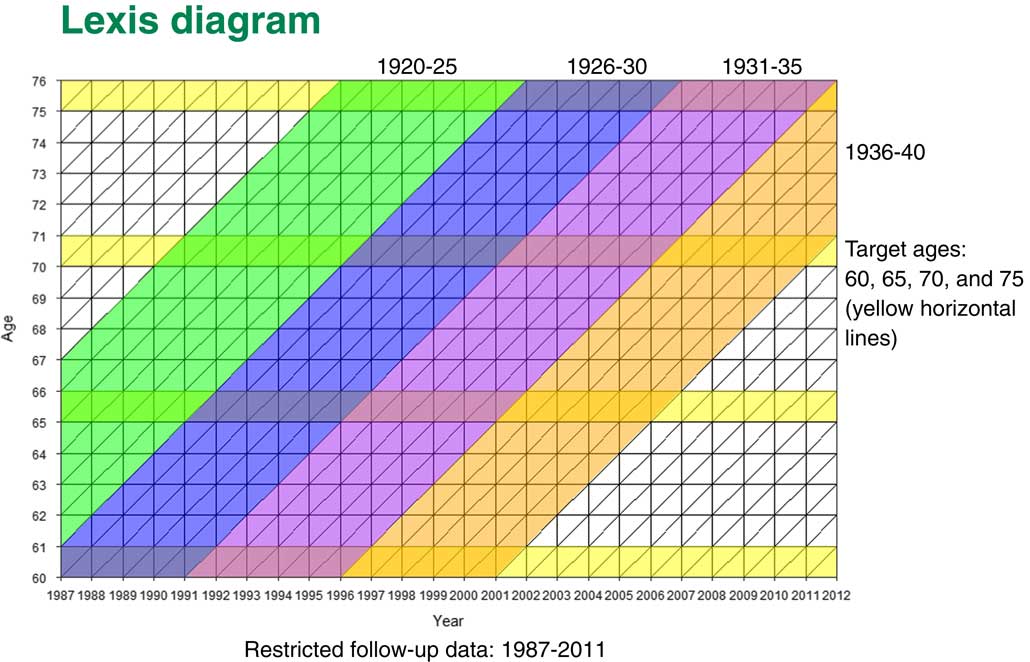
Figure 1 Lexis diagram
You can see that, for instance, that for people in the 60 years cohort, they would be born between 1927 and 1940. We will follow them up from 60 until they go through various other ages. People who come to the 70 year old cohort would be born between 1920 and 1940. Once more we would be following them up, but for a shorter period of time.
What happens is that some patients who have had heart attacks before age 60 are also part of the next cohort. If they did not transfer from the GP practice they would also be part of the group of people who have had heart attacks before age 65. But some of those people will die; some people transfer to another practice; and we would have some other patients who have had heart attacks between the ages of 60 and 65. So our cohorts are not completely independent. They have some of the patients from the previous cohorts but they also have new ones.
For those patients, we looked at quite a few treatments which are recommended after a heart attack. Coronary revascularisation is basically heart surgery. It can be either coronary artery bypass or it can be angioplasty. We also looked at various drugs treatments like ACE inhibitors, aspirin, beta-blockers, calcium-channel lockers and statins.
We have a lot of confounders; we needed to adjust for those. These include sex; year of birth; socio-economic status; various medical conditions such as angina; heart failure; other cardiovascular conditions (valvular heart disease, peripheral vascular disease and cerebrovascular disease); chronic kidney disease; diabetes; hypertension; and hypercholesterolaemia, and also some lifestyle factors such as alcohol consumption, BMI and smoking status.
Lifestyle factors are not recorded very well in primary care. We had more missing data than for medical parameters. There we needed to use multiple imputation – a multilevel multiple imputation – to fill in the missing data before doing the analysis. We have done two different analyses, one for the full cases and one for imputed data. We discovered that we did not have much difference between the two, which was encouraging.
Finally, our main outcome was time to death. We carry out a survival analysis from the target entry age to death, transfer out from the GP practice or to end of study.
In Figure 2 you can see the numbers. Our 60-year-old cohort is the smallest. We have the largest cohorts for ages 70 and 75. You can see that we have quite a high percentage of deaths from 19% at the youngest ages to 24% for the oldest cohort. But what is important is that we have quite a few years follow-up, even though the average follow-up is not that high in the oldest cohort. But maximum follow-up is fairly long in each cohort.
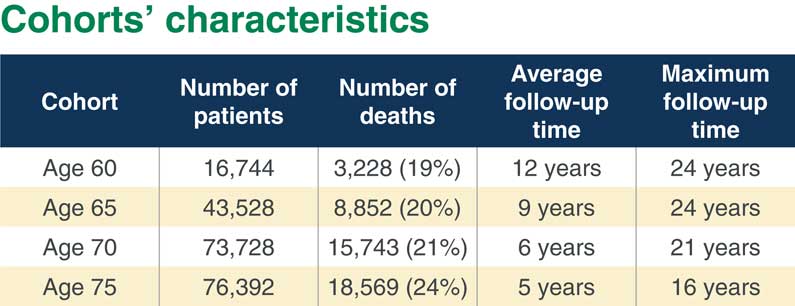
Figure 2 Cohorts’ characteristics
Now I will come to some statistical methods. What we are going to talk about here is the hazard of mortality. In statistics we call them hazards. In actuarial science they are usually called “force of mortality” or “mortality intensity”.
The type of regression model that I am going to talk about is called the Cox’s proportional hazard regression model, which is used all the time in medicine.
As we can see in Figure 3, we consider the hazard, or force of mortality, for patient i at time x. The Cox’s model makes a pretty strong assumption that this hazard can be factorised into two independent factors. The first factor denoted by µ 0(x) is the so-called baseline hazard of mortality. That depends only on age, x. The second factor is the subject’s risk score. That risk score depends on a number of predictors. Beta would be regression coefficients for that risk score.
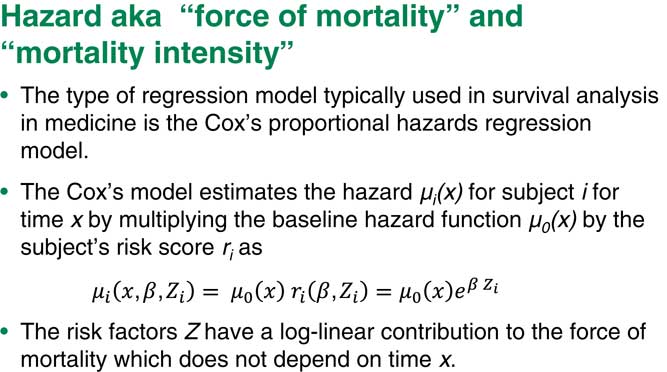
Figure 3 Hazard aka “force of mortality” or “mortality intensity”
The main assumption is that this part does not depend on time. Basically, the relative risk is constant over time. This is, of course, a pretty strong assumption, which we can test for. If it is not we can do other things to make sure our model still works.
This is the main assumption of the Cox’s model and that is why it is called the proportional hazards model. Usually we also assume that the risk score is in exponential, log-linear form. The Cox’s regression does not look at the hazards themselves, it looks at the so-called hazard ratios, or ratios of the force of mortality between the two levels of a factor, that is, between two subpopulations.
Suppose we have two people who are different just on one risk factor and all the rest are exactly the same. If we take the ratio of the hazards for subject i and subject j, the other hazards will just cancel out and what we are left with would be a very simple term which includes the regression coefficient corresponding to exactly this one factor times the difference in the values of those risk factors, the i and the j.
Assume that this is a binary factor, for example, that the individual, i, has baseline level and that j has the next level of risk factor up. So I will end up with the hazard ratio you can see in Figure 4.
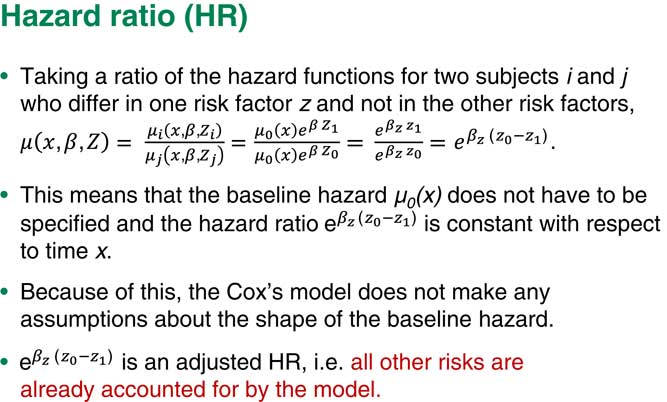
Figure 4 Hazard ratio
One of the main consequences of our assumption of proportional hazards is you do not really need the baseline hazard. We can ignore it. It does not matter what the exact shape of the baseline hazard is because we are only really interested in the coefficients for each of our risk factors. So we do not usually look at the shape of the baseline hazard.
Another important point here is that because we also put various other factors into the model, our term corresponding to the factor Z is a so-called adjusted hazard ratio. That means that this is a hazard ratio, given that all other risks are already adjusted for and already accounted for by the model.
You can see in Figure 5 what we obtained from our study of survival prospects after a heart attack. There are two different parts. In the upper part are hazards of patients who have had heart attacks compared to those who did not have heart attacks at four target ages. You can see that the heart attack hazard ratio here is very high, the hazard of death for people who have had a heart attack is 1.8 compared to people who did not have heart attack. This hazard ratio is depicted on this graph which is called a forest plot. The 95% confidence interval is also shown on the graph.
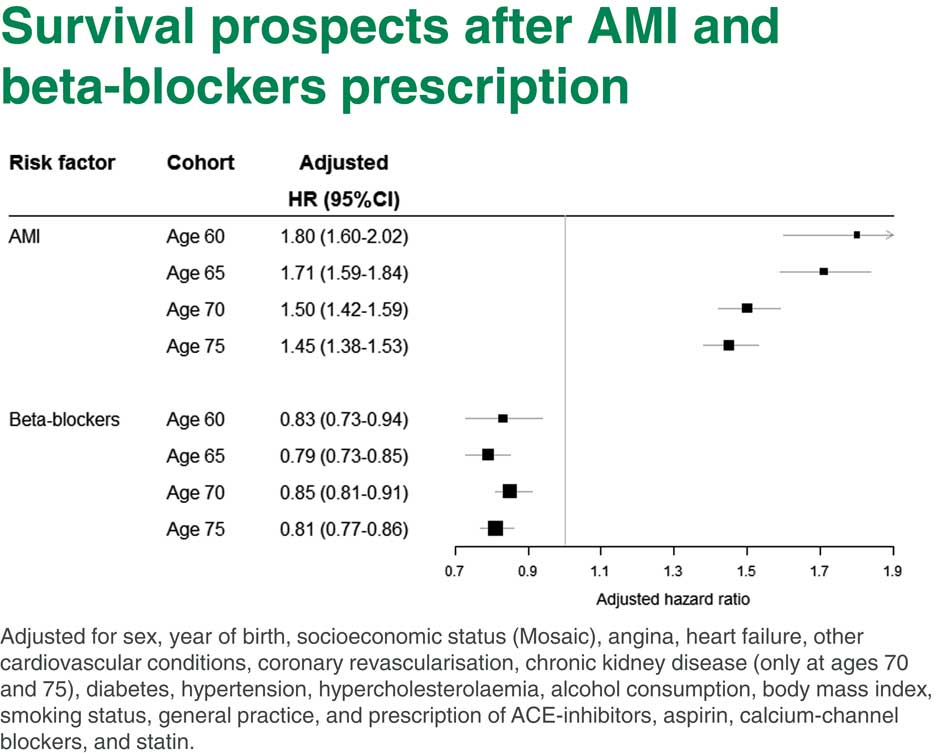
Figure 5 Survival prospects after Acute Myocardial Infarction (AMI) and beta-blockers prescription
You can see straight away that the hazard is actually going down with age, which makes sense. If you had had a heart attack before age 60, your hazard of death is higher than if you had a heart attack by the age 75. Even at age 75 it is pretty high. It is 1.45, that is, the hazard of death is almost 1.5 times higher for people who have had a heart attack.
Now, the lower part is comparing heart attack survivors who had or did not have beta-blockers. Once more, people who have had heart attacks by age 60 and were prescribed beta-blockers after the heart attack have a reduced hazard of mortality compared to people who were not prescribed beta-blockers. You can see that those heart attack hazard ratios are roughly the same at all ages. They are about 15% to 20% lower for people who were prescribed beta-blockers after a heart attack at any age.
So it looks like beta-blockers would be a pretty beneficial intervention which may increase the life expectancy of people after a heart attack. There is a long list of things we adjusted for in this model shown at the bottom of Figure 5.
Our next question is how to translate those findings into individual and population life expectancy calculations.
I will start from what to do for an individual. What we are going to do for an individual is that we are going to translate differences in hazards into changes from current age to effective age. That would help to explain consequences of various conditions or lifetime choices to, say, insurance clients, or patients in public health and basically to nudge clients to pursue a healthy lifestyle which is quite important in life-insurance or health-insurance.
For example, we could explain that if you lose five kilos you would be like someone 1 year younger. Already, as you know, effective ages are used in various insurance applications to apply correct rating.
How am I going to translate the hazard ratio into a change in effective age? You all know that survival after a certain age, say between ages 50–85 – let us be cautious – can be described by the so-called Gompertz survival law. The Gompertz law is very, very simple. The log of the hazards under the Gompertz law is just linear. The slope of this line is approximately 1.1 currently in the United Kingdom.
Figure 6 actually shows you that this is true. This shows how the force of mortality looks in the United Kingdom based on 2010 period life tables. You can see that it is pretty linear for both males and for females.
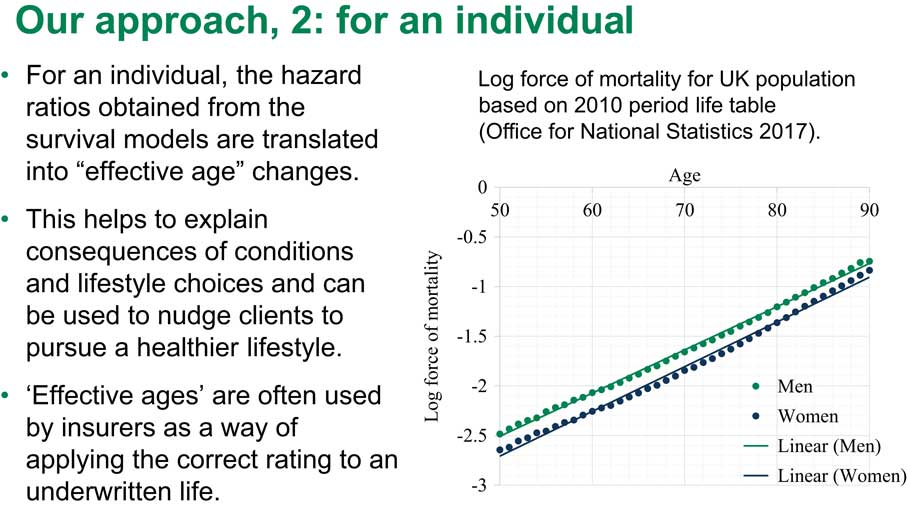
Figure 6 Our approach, 2: for an individual
We are going to use this very simple Gompertz law to figure out the change in effective age. Suppose we have a person at age x, who did not have a heart attack. They would have a low hazard of mortality. But if they did have a heart attack, their hazard increases. We know the hazard ratio from our model. They have a higher hazard of mortality.
We can compare this increased rate of death after the heart attack to a risk for someone who did not have a heart attack but who is older. That older person would have exactly the same risk as a person who did have a heart attack. So this is how we translate this increase in the log hazard of mortality into an increase in effective age. We translated it from one axis to another. This is a very simple calculation because we can just take the log hazard ratio divided by the log of our slope to obtain the increase in effective age. This is how much the effective age was increased due to a heart attack; and of course if you look at something like beta-blockers, we would be looking at a decrease in effective age after a heart attack due to this intervention.
Figure 7 shows how the log force of mortality for heart attack survivors looks with and without beta-blockers. Here I have graphs for 65- and 70-year-old females and males. The black line shows the hazard of mortality for people without heart attacks compared to the blue line, the hazard of mortality for females who did have heart attacks. You can see that it is higher.

Figure 7 Log force of mortality for AMI survivors with and without beta-blockers
When we look at the women who had beta-blockers, the green line, it is higher than the black line, but lower than the blue line. What is important here is that as you can see those lines seem to be pretty linear so we could apply Gompertz law for our calculations of effective age.
Figure 8 shows the results of our translation. If at age 60 a male has had a heart attack, their effective age is increased by 5.8 years, on average. Because the hazard diminished with age, if they have had a heart attack at age 75, their effective age will increase by 3.7 years, on average. There is a confidence interval here as well. If those people were prescribed beta-blockers, their effective age would be diminished by 1.8 years at age 60 or by 1.6–2.3 years at other ages.

Figure 8 How do beta-blockers change effective age?
You can see the total in the final column. Those are effective age changes for people who had both heart attacks and beta-blockers. You can see this is much better as we managed to save about 2 years of effective age. The same is true for women.
As I said, those calculations apply for individual patients but we also want to know what happens at a population level. What do we do for a population life expectancy? Suppose we have a population of heart attack survivors and this life expectancy is actually a weighted average of two life expectancies; one for people who did have beta-blockers, and one for people who did not have beta-blockers, denoted by 1 and 0. But the weights in this weighted average are determined by the prevalence of prescription of beta-blockers at that age.
If, for example, we have 60% of people prescribed beta-blockers at age 60, we would use 60% and 40% as the weights. Looking at this equation, what we really want to do is split this life expectancy, which we know from the period life tables, into those two components. This is easy to do, especially if we have a Gompertz distribution. We know the prevalence; we can figure it out from our primary care data prevalence of prescription. As I said, we know this and we know also the hazard ratio, that is, we know the distance between the two straight lines.
There is only one parameter we do not know for this equation. This is, say, the intercept for the first black line. But we can very easily find this intercept even for a non-linear equation.
After that we would know the life expectancy of people with and without a prescription for beta-blockers and we could play with various scenarios. For example, we could suppose the prevalence of prescription of beta-blockers grows from 60% to 80%, what will happen to population life expectancy? It would be very easy to think that out.
Of course, we first need to come up with prevalences. Figure 9 shows prevalences for different treatments which are used for people who have had a heart attack. The black line, for example, is statins and the red line is aspirin. You can see that by 2010 practically everyone who has had a heart attack would be prescribed both statins and aspirin.
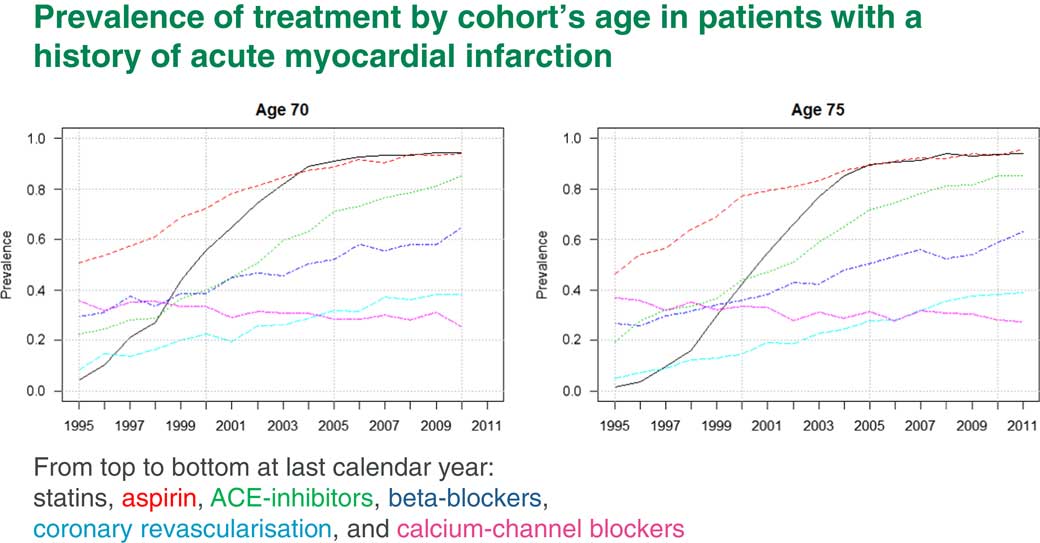
Figure 9 Prevalence of treatments by cohort’s age in patients with a history of acute myocardial infarction
The increase in life expectancy due to those interventions is already incorporated into life expectancy. We will not get any more out of this. The blue line is beta-blockers. Beta-blockers by 2010 are only at a level of about 60%. Here we have some scope to increase life expectancy if everyone is prescribed beta-blockers after a heart attack.
This fact was picked up after our publication of the paper I mentioned to you. There was a review about it in the Journal of Hospital Medicine which told the hospital doctors to start prescribing beta-blockers to all heart attack survivors because they seemed to be very good.
How exactly would the prescription of beta-blockers affect population life expectancy? In Figure 10 you can see result of our split of life expectancy. This is overall life expectancy at age 60, 65, 70 and 75. We split this overall life expectancy into two components: people with and without heart attacks. You can see that people who have had heart attacks lost about 4.5 years. We then split the life expectancy for people after heart attack further into those who have had beta-blockers and those who did not have beta-blockers. You can see that once more there is quite a bit of difference between them.

Figure 10 Period life expectancy for heart attack survivors
We can play with different prescription prevalence scenarios. For example, what would life expectancy be if we did not have any beta-blocker prescriptions, and what would life expectancy be if we had 100% prescription?
Now I am very briefly going to introduce a second example which is about intensive systolic blood pressure control. There was a very influential trial in the United States, SPRINT, which looked at intensive blood pressure control but it was stopped early because it appeared that people in one of the arms had much more benefit out of intensive blood pressure control than the other arm, people on standard treatment.
The current guidelines in the United States at that time, and currently in the United Kingdom, are to keep systolic blood pressure controlled at 140 mmHg.
In the intensive arm of the SPRINT trial they tried to keep blood pressure at 120 mmHg or below. As I said, it looked as if it had really good results both for morbidity and also for survival.
Even so, they did have quite a few adverse renal outcomes for people in intensive arm. That trial was so impressive that the American Heart Association changed its hypertension guidelines last autumn. Now in the United States everyone who has a systolic blood pressure of 130 mmHg or more is considered to be hypertensive, and they would first try to be treated with lifestyle interventions, but then they would be put on drugs.
In the UK the current NICE guideline is still 140 mmHg. But NICE is looking at a revision of its blood pressure guidelines.
What we wanted to do, when we saw the SPRINT results, was to see whether our primary care data supports the benefits of intensive blood pressure control.
What we have done is that we tried to imitate the SPRINT design. We found almost 55,000 patients in THIN aged between 50 and 90 years who were treated for hypertension between 2005 and 2013 and followed-up to 2017.
What we wanted was people who already had hypertension which was out of control, which was above 140, and who obtained therefore a new prescription. As a result of that prescription, some people would get a drop in their blood pressure to below 140. That would be our control arm. Some people got a drop in their blood pressure to below 120. That would be our intensive arm. We then tried to see what resulted from those different scenarios as far as longevity and various outcomes were concerned.
Regarding the results, as I said in SPRINT, they had very, very beneficial results in the intensive treatment arm. They had a hazard ratio of 0.73. That means that there were much, much smaller hazards of death in the intensive treatment arm compared to the standard treatment. This is a pretty big change. That would lead to a decrease in effective age of about 3.5 years. Because of this new American Heart Association guideline, the question arises as to whether we should expect a boost in the life expectancy in the United States in the next few years.
Our answer is probably not, because when we looked at it, in THIN, we found that the treatment was actually not beneficial. It appeared to be harmful. Our intensive arm patients had an increased hazard ratio of death of 1.35, which would translate into an increase in effective age of 1.7–1.8 years.
In both studies, the more intensive the treatment, the more drugs or the higher dosage the patient will have. This will increase both the hazards of mortality and also the hazards of adverse renal outcomes.
We also looked at the baseline hazards for the SPRINT study. Here we had a pretty strange shape for the hazards. If you look at Figure 11, you can see that it appears to be pretty linear for about 8 years, but then it starts dropping a bit. The question is, why? I can think of two possible explanations.
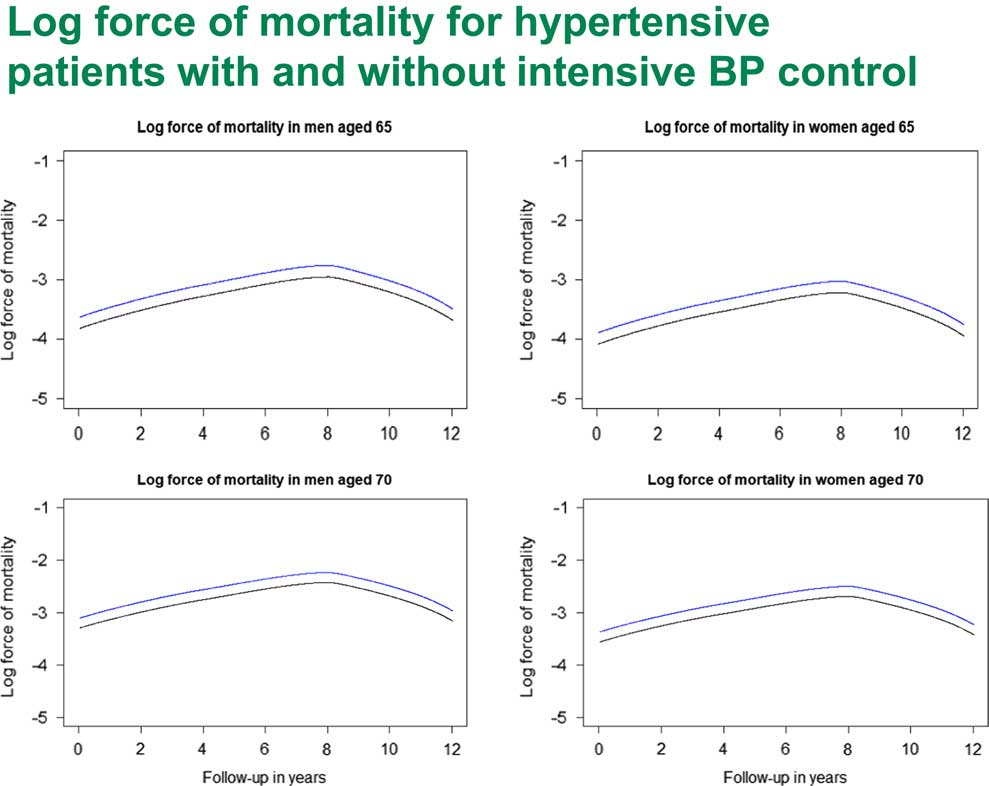
Figure 11 Log force of mortality for hypertensive patients with and without intensive Blood Pressure (BP) control
The first explanation which came into my mind is that many actuaries are familiar with this kind of shape of hazard when you look at the survival of the oldest after 90 years of age. Usually that is explained by heterogeneity, that weaker people die out first. By the time you get to over 90, you are dealing with a particular genetic subpopulation who really have very good genes and can live forever. This is one explanation.
Then I realised that there might be another explanation here as well. When we were selecting those patients, remember we selected people who had hypertension. But they came to their doctor and had a first intervention and lowered their blood pressure. But there were quite a few people who would not go to their GP, or their interventions might not be successful. You do not see those people here. It may be for those people the hazard actually went up so that on average we did have Gompertz law but we had a pretty benign sub-population, people who did do something about their blood pressure. This requires more research to understand exactly what is going on.
Mr N. R. Wright, F.F.A.: Modelling mortality experience in individual level health data from large health databases can establish and quantify drivers of changes in mortality and help to predict how these changes may change over time. We have shown how you can change that into individual and population level life expectancies. If you have a model that allows differences in prevalence and treatments within the population, then you can transpose results so they apply to a sub-population in which you are interested, particularly, for example, if you have insured lives or a particular pension scheme. You can allow for what you think of as the prevalence of treatment within that sub-population, which addresses the question of basis risk that Andrew mentioned was part of our project brief.
In the paper there is an example of how you can do this using hazards of mortality associated with risk factors in which you are interested; the prevalence of those risk factors and an underlying life table for a population. It is a fairly simple method and if you want to do something more complicated then the aim is that the project will produce material that you can use to do more complicated calculations, if that is what you feel you need.
Changes in the prevalence of the risk factor of interest are reflected in the life expectancy of the population at the population level, so you can see how much the factor of interest has already contributed to changes in past longevity improvements.
For example, you see that in the example of aspirin. Prescriptions are now pretty much 100%, so you are not going to expect increased longevity improvements as a result of that treatment. Also, you can see how continuing trends of the risk factor can influence the future life expectancies.
The approach can look at the prevalence of known treatments or conditions. It is never going to provide a complete answer, because you do not know what is going to go on in the future in terms of new conditions and new treatments.
For all that, you can still use it for projecting. Questions like: are you past the peak of mortality improvements resulting from treatments that you know about, for example, beta-blocker prescriptions? And you can see how much more mortality improvement, longevity improvements, you could expect from beta-blockers. You can also answer questions such as how much medical improvement you need to maintain a particular trend in mortality improvement. You can give a comparison, so you need something as big as statins to come through in the next however long in order to maintain a level of longevity improvements that you are interested in. You can answer questions such as what the impact of another medical advance the size of statins would be.
As we said, this paper comes out of work that is funded by the ARC. The case studies presented here are the effect of beta-blockers following a heart attack and the effect of intensive blood pressure control. We have also looked at statin prescription. That is also published in papers that Professor Elena Kulinskaya and Lisanne Gitsels have put together with Nick Steel, who is another academic, a professor at UEA, who is also on the project.
Then as part of the project (the funding continues to 2020), there is a list of medical conditions and health interventions we are working our way through, including stroke and type II diabetes as well as heart attacks. We are looking at health interventions as well as the effect of statins, blood pressure targets and hormone replacement therapy.
To keep yourself up-to-date or to find out more, you can go to our website which has links to various presentations, published articles and even a few videos.
The Chairman: It is very much one of the aims of the ARC not just to do the fundamental research, but to take that through to the application end of the spectrum and develop the impact in an actuarial setting, but also for this project, for example, there are other types of impacts that we would like to see as a possibility. For example, the health guidelines through the National Institute for Clinical and Health Excellence. If people have comments on that they would be very welcome to make them.
Ms N. Oliver: I am a longevity mortality consultant. My question really relates to the increase in so-called multi-morbidity, where somebody has two or more conditions and, in particular, the increasing concern around polypharmacy.
As you mentioned, the Randomised Control Trial (RCT) is the gold standard for assessing the effectiveness of the treatment but, of course, those trials were undertaken on people who were not taking any other medication. There is increasing evidence around the effects of one treatment against another.
Can you also comment further on people who are not taking beta-blockers? There are often concerns by patients in terms of unpleasant side-effects. Are there other illnesses that those people have that prevent them from taking, say, a prescribed beta-blocker or a statin? I am really thinking about the impacts of other treatments, not just illnesses, but also any possible ways of being able to account for those issues.
Prof Kulinskaya: You have seen that in our models we have adjusted for quite a few, different health conditions including diabetes, renal disease and cardiovascular disease. We also adjusted for lots of different medications. We try to take all this into account. That is exactly where the primary care data are very helpful.
Of course, what we cannot do is, whilst we know the data of the prescriptions, we do not know the data on whether the patients are taking those prescriptions. Up to that limitation, we have a more or less accurate picture of at least current prescriptions. What I was talking about here was actually a design where we looked at whether people were prescribed statins by a certain age, for instance, or whether they had a heart attack by a certain age.
Now we are trying to follow patients over time and see a more realistic scenario, like ones dropping off statins and then returning to statins once more, that kind of thing. That will be our next paper.
The Chairman: Just as a follow-up to that, in the modelling work that you are doing, the Cox model, have you been able to look at interactions between some of the confounding variables and the prescriptions?
Prof Kulinskaya: Yes. We usually look at quite a few interactions. We start from a very wide model, which includes all possible predictors and interactions and then we do a better selection ending up with the model which has only significant interactions and effects. So, yes, we looked at various interactions of different prescriptions and diseases.
The Chairman: Do you find then that with polypharmacies, multiple prescriptions, do you see an impact there?
Prof Kulinskaya: Even in the SPRINT trial that I was mentioning, we found that if people have more than two prescriptions for blood pressure or if they have high dosages, then yes, that resulted in higher hazards of mortality and also in renal side effects.
Mr D. M. Pike, F.F.A.: I have two questions that I should like to ask. The first is; did the data allow you to distinguish between patients who had died of a heart related condition and those who died of an unrelated condition?
The second question I have is; were you able to consider at all why some patients, only 60% of patients, had been prescribed beta-blockers, and if there are reasons why doctors prescribed those 60% and not the other 40%? If, for instance, they only prescribed beta-blockers to patients who had had just a mild heart attack or recovered well from a heart attack, that might make it inappropriate for you to extrapolate the results to the whole population.
Prof Kulinskaya: I will answer the first question first. That was about cause specific mortality. The answer will be disappointing, I suppose. We do not have causes of death in our data. It was a conscious decision because the data would have been much, much more expensive, but also to be honest, I do not believe in cause-specific recording. I think it is very accurate. Everyone dies from pneumonia, regardless of what they really had – that kind of thing. So the answer is no.
Coming to the question why, I think, beta-blockers prescriptions do not represent special selection or rationing because beta-blockers are pretty cheap. Mainly it was due to lack of knowledge by hospital doctors. That is why our work was picked up by the Journal of Hospital Medicine.
There are much more expensive interventions, of course, such as heart surgery. We looked at who is getting intervention and who does not. There is a pretty clear socio-economic component. There is a gender component. Women have much less heart surgery than men, for instance.
Usually every new intervention, when it starts, is being delivered to people in the top socio-economic level and then it slowly goes down to the other levels.
Mr I. McLellan, F.F.A.: I have two quick questions. I was not aware of the THIN database, and am interested in terms of how that has grown over time. Do you see more practices, et cetera, adding to that data set or do you see challenges in terms of people becoming more concerned about their data in the wider sense and looking to opt out, or not have that information shared?
Secondly, the more practical question is, I think, the point that Nigel made at the end in terms of being able to look and think about what if we had no statins mark 2 or some other type of intervention? Based on your modelling, what kind of time scales do you think, based on what you know, from when a new treatment started to be recorded, would you be able to get some credible and significant results so you could start to answer those kinds of questions? Is it always 20 years of data or is there a point when after only a few years the data set is big enough to be able to make some more definitive statements?
Mr Wright: Regarding the second question, I suppose if you are looking at longevity material then you need it long enough for people to have died, and particularly if you are looking at something that is improving longevity you need to have long enough so you notice that they have not died, which takes even longer.
You can see examples of the take-up of different medical interventions, medical treatments, in the graph that Elena showed earlier on. Different things take different times to come in and for people to realise how good they are, so you can look at different gradients for those take-up rate graphs.
There is other material that you can look at, as Elena was saying, if you have differences by gender or by age or by socio-economic factors.
Prof Kulinskaya: I am sure that you are aware that insurance has a very bad image as far as access to health data are concerned. So we did have some problems in obtaining the data. I have to say that we had two different subsets over time.
We started back in 2010 with the first subset, which was for people born between 1920 and 1940. It was much easier to obtain that data than to obtain data for this project because between those two dates there was a scandal about the way insurance companies are using our data. It is pretty difficult to get access to the data even when all ethics conditions are satisfied.
We keep hoping that it will improve. Personally, I do not see why pharmaceutical companies would have a better reputation; but it appears that it is easier for them.
Many health data providers specifically state on their website that this is only available for health research; and, strictly speaking, insurance research is not health research. So yes, it is difficult, but it is not impossible.
Dr H. C. Patterson: You mentioned RCTs at the beginning of your presentation. I am interested in other forms of more conventional medical research of the other kind of studies, like long-term prospective cohort studies. I am interested to know whether you found any comparable age match data among, say, post-marketing surveillance studies, or any long-term prospective studies to compare whether you are getting a similar ballpark of hazard ratios compared to the retrospective matched work that you have done.
It will be interesting, because those studies have been around from before big data became so popular, and if they were similar it might, in some way, increase the credibility of big data to a more traditional audience. If they did not match, it might raise interesting questions about why they did not.
Prof Kulinskaya: We did look at other sources of data. There are several interesting studies; for example, there is the English Longitudinal Study of Age (ELSA), and there are other kinds of traditional studies.
Those studies are very well designed. From that point of view, they are much less prone to error, and possible bias, than primary care data. On the other hand, they are unfortunately very small as far as I am concerned, if you look at some health conditions which do not strike everyone. For example, when you look at dementia, there were recently several papers which were published about dementia from ELSA, or another study like that, and the sample sizes they work with are about 500/700 cases. That is certainly not enough to build a proper model as far as I am concerned.
On the other hand, I am more enthusiastic about the primary care data which is kind of big data. But, yes, we do have lots of issues. It requires quite a lot of attention to design a study to be able to remove at least a major part of possible biases in this data.
Mr A. Scott: I am not an actuary. I am a civil servant. I am the Director of Population Health at the Scottish Government. I am responsible for public health and primary care and mental health.
I have two questions. I do not quite understand all the details of the actuarial modelling. But a couple of things struck me as relevant. What do these studies and other related studies tell you about how you might influence medical practice? Is there something you might do to improve the image of the insurance business by changing medical practice in some way in applying this data differently?
Second, one of the things I am responsible for creating is the new body Public Health Scotland which will hold NHS data for everybody in Scotland.
I wonder what it is that you would do to improve the quality and reach of health data in Scotland if you had an opportunity to do so.
Mr Wright: In terms of influencing public health, as well as providing material for actuaries like me who have worked in an insurance company, in the project team we have Nick Steel, who is a medical doctor as well as being an academic doctor. Using insight that he has, some of the results that we have been coming up with, as Elena said, have been published in medical journals as well as this sort of thing.
So it is, we hope, helping to guide the beta-blocker prescription levels, for example. What we are finding on the comparison with the SPRINT trial, we feed that into decisions about treatment of high blood pressure – and what counts as high blood pressure.
In terms of improving quality and reach of data, one of the main problems that we have had with THIN is that it is GP material, and we do not really know what goes on in a hospital. There does not seem to be much of a link between what the GP records when you go and see him in a surgery and what happens at the hospital, and what may be sent out to a consultant in a hospital. But in terms of what is recorded, and what we can see in THIN, there is often a big gap.
In the list of conditions that we were looking at, you would want to put cancer in there. But cancer in the THIN data set is pretty problematic. Most of the cancer care that goes on will be going on at a hospital. You might know that the doctor had concerns about cancer and sent you off to a hospital, and what you get back and gets recorded in the THIN data set is patchy at best. People in the health service know that linking between different parts of the health service is problematic.
Prof Kulinskaya: I enthusiastically support this answer. The main issue for any health research, and for our research as well, is good linkages between different health data sets. For cancer, for instance, even hospitals do not have good data. I know. I did work with hospital data as well. It is the cancer register which has good data. What we really want is a link between primary care, secondary care and specialised registers such as cancer registers, the National Joint Register and any other registers. That would be really nice if you could achieve that. I personally would be thrilled to work with Scottish data.
Mr Wright: That is the second bit as well. Having done all that linkage, you have to let Elena have the data.
The Chairman: To follow-up on that very briefly, in terms of primary care data, are there things that could be improved within that? For example, in your presentation you mentioned that recording things like BMI and smoking are patchy. How much do you think that your work could be improved if that particular aspect of the primary care data were also improved? A follow-up maybe for Mr Scott is how easy would it actually be to improve that to a reasonable level?
Prof Kulinskaya: I mentioned that we used a pretty sophisticated multilevel imputation method to try to ameliorate problems with the THIN data. Actually, recording of, say, smoking or BMI in primary care improved after the Quality Outcomes Framework was introduced, the doctors started recording it much more consistently. I do not remember off the top of my head, but 25% of, say, BMI data is still missing, so it is quite a big proportion of the data. Of course, it would be much better if it were recorded.
I do not think that we can improve the quality of the data just by legislation or good example. Usually it has improved due to changes in payment, from my experience.
Mr W. D. B. Anderson, F.I.A.: I should like to continue this theme, if I may, of big data and how things might become more useful to insurance companies and risk-takers.
It strikes me that if you have to wait what seems like quite a long time for people to pass away, the data, some people would argue, becomes stale before you get around to using it. Would it be possible within the constraints of this dataset to look at changes in morbidity over time so that if somehow you could describe the typical pathway of a patient’s treatment and you could put in a series of milestones that you have to go through on that particular patient trajectory but could measure effectively how quickly you get from A to B to C to D and see whether those are changing as you follow this longitudinal data set through, and then hook it all up so it works in real time. You do not have to wait to publish a paper but you can just put the results on the Internet for us.
Prof Kulinskaya: Yes. Undoubtedly, we are looking at modelling different health states and trajectories of patients across these states. We are starting modelling morbidity due to diabetes, and so we are thinking about considering different states because, as you know, diabetes would cause various cardiovascular morbidity and other complications, and so on. We might end up doing this kind of analysis with multistate models.
Mr Wright: I think that is often the sort of thing at which drug trials will look. They will look at effects on blood pressure rather than on your eventual death. They will say that this is to treat blood pressure. Blood pressure is just a number, really; it is indirect. What you would really be interested in is quality of life and life expectancy, so they are using that as an interim measure.
Where you have to be careful is if there are side effects that were going to come through. You might have fine blood pressure, but if it is damaging your kidneys then your pathway to death will change. It will no longer go down the blood pressure/heart attack pathway, it will go down the kidney failure/death pathway. It is not going to provide the whole answer.
Mr T. J. Maxwell, F.I.A.: Your presentation clearly showed the benefits of beta-blockers for those who have had heart attacks. Is there any information to show the benefits of starting on beta-blockers before having your first heart attack?
More generally, is it possible to get hold of data to investigate the preventative effects of treatments rather than having to wait for someone who has already had a serious event and hence investigate the effects of preventative medicine on longevity?
Prof Kulinskaya: Yes, absolutely. First, to answer your first question, beta-blockers do not have any effect on people – at least on longevity of people – who do not have heart attacks. Zero. That was easy.
The second one, we did look in much detail as to the effects of statins. As you know, with statins the guidelines also changed a couple of years ago. Previously the guideline by NICE was that everyone who has a 20% risk of a cardiovascular event in the next 10 years would be eligible for statins. Then it changed to 10% risk. There was quite a lot of outcry from the GPs about medicalising people who were practically healthy and who had just 10% risk of something.
We looked at the effects of statins on life expectancy. Our answers were somewhat different from NICE. We had a qualified answer. At younger ages, like 60 or 65, you do not really need statins. There are no benefits. But at older ages, starting statins appears to be beneficial for life expectancy.
The Chairman: We have certainly had a very interesting and varied discussion as well as a very good presentation before that. It remains for me to express my own thanks; and, I am sure, all of us here would like to thank in the usual way the presenters and those who participated in the discussion.


 Open access