


It is well established that migration and ethnic minority status are risk factors for psychotic disorders.Reference Bourque, van der Ven and Malla1 Recent studies have also investigated this association with regard to subclinical psychosis (i.e. psychotic-like experiences (PLE), isolated psychotic symptoms and schizotypal personality, suggesting that they are also risk factors for the extended psychosis phenotype).Reference van Os, Linscott, Myin-Germeys, Delespaul and Krabbendam2, Reference Mason3 In a meta-analysis carried out by Linscott and van Os,Reference Linscott and van Os4 lifetime PLE were associated with ethnic minority status in a non-adjusted analysis (odds ratio 1.3, 95% CI 1.2–1.9), but not with migrant status (odds ratio 0.8, 95% CI 0.3–1.8). However, it is still unclear to what extent specific ethnic groups have a higher risk of subclinical psychosis. Furthermore, no meta-analyses have investigated the association between ethnic minority or migration status and schizotypal traits.
The study of subclinical psychosis in a non-clinical population is based on the hypothesis of a psychosis continuum, where subclinical psychosis and psychotic disorders are continuously distributed in the general population and may share the same risk factors.Reference Verdoux and van Os5 This approach brings new perspectives, maximising statistical power and the possibility to detect confounders, modifiers, and biological and psychosocial factors underpinning the aetiology and development of psychotic disorders. Moreover, in migrant and ethnic minority populations, it provides additional advantages in avoiding specific methodological limits, such as differences in case ascertainement (mainly from barriers to mental healthcare access) and misdiagnoses caused by categorical standardised diagnosis. The investigation of subclinical psychosis is important to identify groups at higher risk of psychiatric disorders and therefore promote prevention and reduce treatment delay. For instance, individuals who report PLE have been shown to be more likely to attend their general practitioners for emotional problems.Reference Murphy, Shevlin, Houston and Adamson6 More recently, PLE in the general population have been associated with increased rates of mental health service use.Reference Bhavsar, Maccabe, Hatch, Hotopf, Boydell and McGuire7 Thus, higher rates of PLE in migrants and ethnic minorities could indicate the need for tailored policies and interventions to improve mental health for these subgroups, as in other relevant public health issues such as cancer screening and diabetes.
We conducted a systematic review and meta-analysis to further explore the association between ethnic minorities, migrant status and subclinical psychosis outcomes. In the narrative review, we described and compared the results according to adjustment variables related to psychosocial risk factors, because there is evidence that the risk of psychosis varies across different ethnic groups in different host countries, suggesting an influence of other risk factors for psychosis, such as psychological stress (e.g. trauma, social defeat or discrimination).Reference Veling8 We also considered the interpretation of results according to the host country, to better compare the prevalence between different ethnic and migrant groups in the same wider context.
Method
Eligibility criteria
Studies written in English were included if (a) they provided original data on subclinical psychosis (schizotypal traits and PLE, isolated hallucinations or delusional symptoms), (b) the study population was adult (aged >16 years) and the study was in a non-clinical setting and (c) they provided data allowing for comparison between a native reference population and migrants (first- and/or second-generation) and/or ethnic minority groups. Studies that used the same database were included if they provided different analysis (different adjustments or different migrant or ethnic groups studied). We excluded studies recruiting only older adults and those set in secondary or tertiary health services, prison or aged-care facilities. Qualitative studies were also excluded. The considered time period was from 1950 to July 2017.
Search strategy
The following search items were entered in several electronic databases (MEDLINE, PubMed, PsycINFO and ScienceDirect): [delusion OR delusional OR hallucination OR hallucinatory OR paranoia OR paranoid OR psychotic OR schizotypy OR schizotypal] AND [migrant OR migration OR ethnicity OR ethnic]. Authors were contacted if full texts or supplement material were not available online. We followed the Preferred Reporting Items for Systematic Reviews and Meta-Analyses guidelines to conduct our systematic review and meta-analysisReference Moher, Liberati, Tetzlaff and Altman9 (Supplementary material 1 available at https://doi.org/10.1192/bjo.2018.68).
Data extraction
After the screening of titles and abstracts, A.T. and B.P. carefully read all the articles retrieved and selected those of interest for our systematic review and meta-analysis, and independently extracted the data needed for the calculations. Authors were contacted for additional data when necessary.
We extracted information regarding design (incidence, prevalence), country of study, setting (college students, general population, enlistees, etc.), age limits, gender, outcome (hallucinations, delusions or both for PLE; scores for schizotypal personality), diagnostic instrument, sample characteristics (ethnicity, migrant status, reference population) and sample size.
When available, we used odds ratios and 95% confidence intervals as the main result. To examine the relationship between unadjusted and adjusted odds ratios, we also extracted adjusted odds ratios and their adjustment factors. In the case of missing odds ratios, we extracted additional values such as P-values, percentages, s.e. and 95% confidence intervals. Finally, when quantitative data were not available or not adequate, we extracted the summary of findings.
Outcomes
PLE can be defined as delusional or hallucinatory experiences in non-clinical populations,Reference Verdoux and van Os5 although a consistent phenomenological definition is lacking in the literature. We included studies that defined PLE as the presence or absence of positive symptoms of psychosis (delusions, hallucinations or any), as assessed by standardised tools.
Schizotypal personality is a personality organisation with a vulnerability to psychosis.Reference Meehl10 Thus, schizotypal traits are usually stable over time, unlike PLE.Reference Debbane and Barrantes-Vidal11 We included studies that quantitatively assessed schizotypal traits with standardised scales.
Quality assessment
Quality assessment of all studies was conducted with the scale proposed by Munn et al,Reference Munn, Moola, Riitano and Lisy12 developed to assess the quality of prevalence studies in systematic reviews, based on 10 criteria (sample representativeness, strategy for recruitment of participants, sample size, description of settings and participants, coverage of data analysis, objective standard criteria, measures reliability, statistical analysis, confounding factors and sub-population identification criteria). To better identify the level of the quality, we attributed values to the answers suggested by the authors, whereby ‘no’ was designated 0, ‘unclear/not applicable’ was designated 1 and ‘yes’ was designated as 2, resulting in a maximum possible score of 20. This quality assessment was done by A.T. and B.P. separately, and the discrepancies were subsequently addressed and discussed.
Data synthesis and analysis
A narrative synthesis was made for all retrieved studies by outcome and migrant status/ethnicity. In the PLE analyses, we also tried to describe the studies according to the assessment period (current or lifetime) and by outcome (delusions, hallucination or any PLE).
We then performed a meta-analysis where there was sufficient number of studies (at least two)Reference Valentine, Pigott and Rothstein13 providing raw data and taking into account the different outcomes in different migrant/ethnic groups. When there was more than one outcome by study (e.g. PLE, delusions or hallucinations), we preferred to include only results on any PLE, to avoid cumulate dependent effect sizes. We estimated pooled odds ratios and corresponding 95% confidence intervals by random effects meta-analysis to investigate the effect of ethnic minority groups on within- and between-study variability. The level of inconsistency between studies was assessed with the I 2 statistic or τ 2 (in robust variance estimation).Reference Higgins, Thompson, Deeks and Altman14 To reduce heterogeneity between studies, sensitivity analyses were performed on study quality and use of a validated questionnaire/interview for lifetime and current PLE. To detect publication bias, funnel plots and Egger's test were done.Reference Sterne, Becker, Egger, Rothstein, Sutton and Borenstein15 Because most studies used more than one exposure (different ethnic groups), to handle statistically dependent effect sizes estimates, we performed a meta-analysis with robust variance estimation when it was possible (at least 10 effect sizes in the data-set).Reference Hedges, Tipton and Johnson16 The meta-analysis was performed with the METAN and ROBUMETA packages for Stata version 14.2 (StataCorp).Reference Hedberg17
Results
Study identification
We found 686 potential citations. After reviewing the titles, 152 citations were selected for abstract review, based on our inclusion and exclusion criteria. We kept 77 citations for full manuscript review. Five studies were added based on the citations of considered studies. In the end, 28 studies met the inclusion criteria (Fig. 1).
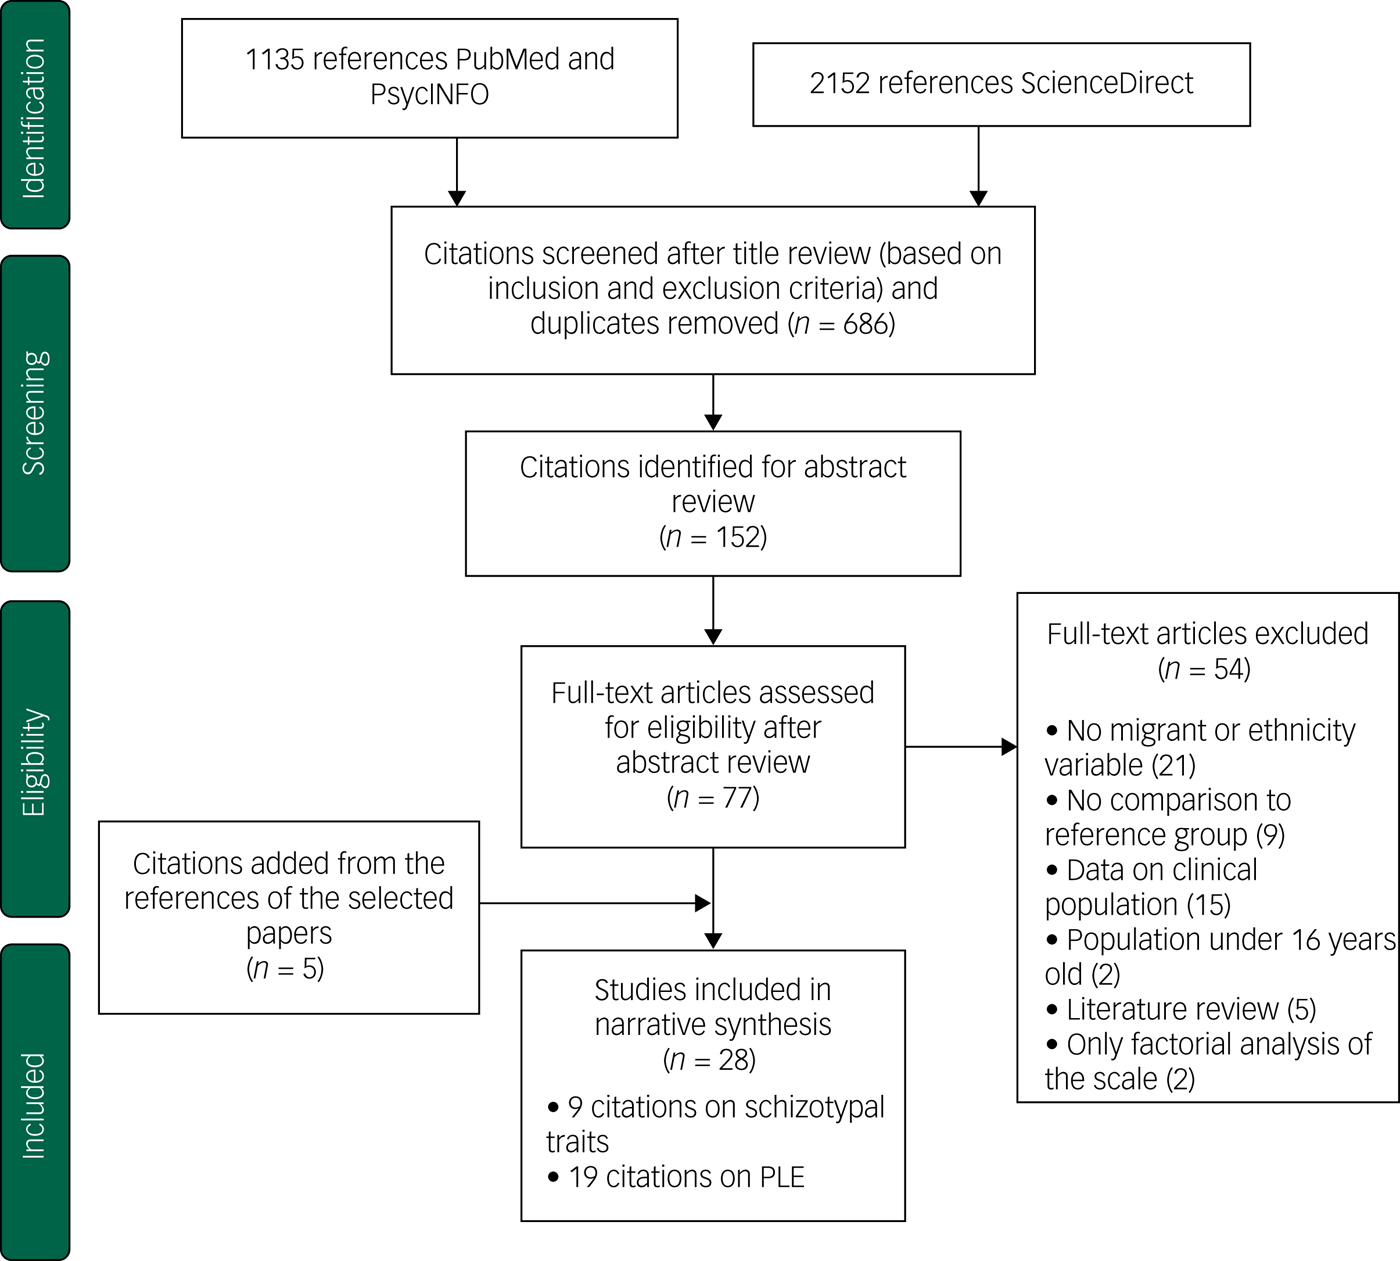
Fig. 1 Flow diagram (selection strategy) of selected studies.
PLE, psychotic-like experiences.
Study characteristics
Nineteen studies provided findings on PLE (Supplementary material 1), and nine studies provided findings on schizotypal traits (Table 1), published from 1977 to 2015. Twenty-six studies provided data on ethnicity and five provided data on migrant status. Ethnic groups varied across the countries where the studies were carried out. All citations selected concerned prevalence studies in non-clinical populations, although not all of them analysed data from the general population. This was the case for most studies on schizotypal traits (eight out of nine studies), which were conducted among college students. Regarding studies on PLE, one study was conducted among young male pre-enlistees for the National Service in Singapore,Reference Subramaniam, Verma, Cheok, Lee, Wong and Chong18 whereas the remaining studies were conducted in the general population. One study was conducted only among young adults (18–24 years of age).Reference Vanheusden, Mulder, van der Ende, Selten, van Lenthe and Verhulst19 Three studies on PLEReference Cohen and Marino20–Reference Oh, Abe, Negi and DeVylder22 used data from the Collaborative Psychiatric Epidemiologic Surveys in the USA, which consists of three large national ethnic community surveys (in Latino, Black and Asian populations), using similar methodsReference Heeringa, Wagner, Torres, Duan, Adams and Berglund23 and the same data-set (16 423 participants). However, they adjusted for different correlates, which allowed us to compare differences in odds ratios as the result of the different adjustments made. The same reasoning was used for the inclusion of two studies in the UK that used the same data but analysed different risk factors.Reference Freeman, McManus, Brugha, Meltzer, Jenkins and Bebbington24, Reference Wickham, Taylor, Shevlin and Bentall25 Inclusion criteria in studies on PLE were similar (at least one PLE endorsed) despite the different scales used. Eight studies used the Composite International Diagnostic Interview (CIDI)Reference Kessler and Üstün26 and seven studies used the Psychosis Screening Questionnaire (PSQ).Reference Bebbington and Nayani27 With respect to studies on schizotypal traits, the Chapman scalesReference Chapman, Chapman and Miller28 and the Schizotypal Personality Questionnaire (SPQ)Reference Raine29 were used in seven of the nine studies. One study compared the reliability of 11 different scales,Reference Kelley and Coursey30 and one studyReference Sharpley and Peters31 used the Oxford–Liverpool Inventory of Feelings and Experience (O-LIFE) scale.Reference Mason, Claridge and Jackson32
Table 1 Studies on schizotypal traits: characteristics and findings

PLE by ethnicity
Lifetime PLE
Six citations reported data by lifetime PLE and ethnicity.Reference Cohen and Marino20, Reference DeVylder, Burnette and Yang21, Reference Binbay, Drukker, Elbi, Tanik, Ozkinay and Onay33–Reference Saha, Scott, Varghese and McGrath36 Study quality scores ranged from 14 to 19 (mean 17, s.d. 2.1).
In unadjusted analyses, any lifetime PLE or hallucinations were associated with Black ethnic groups across studies conducted in any area that included this ethnicity.Reference Cohen and Marino20, Reference DeVylder, Burnette and Yang21, Reference Temmingh, Stein, Seedat and Williams34, Reference Schwab35 In the USA, the Latino minority population also showed higher prevalence of lifetime PLE compared with the White population.Reference Cohen and Marino20, Reference DeVylder, Burnette and Yang21 These associations, including those among Black minorities, were no longer statistically significant when adjusted for psychological stressReference Cohen and Marino20 or clinical diagnosis, after adjustment for supplementary factors (other than sociodemographic).Reference DeVylder, Burnette and Yang21 In Turkey, no differences (P = 0.6) between Turkish and non-Turkish ethnic groups were found after adjustments for age and gender across five levels of expression of psychosis (from absence of psychosis outcome to psychotic disorder).Reference Binbay, Drukker, Elbi, Tanik, Ozkinay and Onay33 Finally, in Australia, Saha et al found an association between delusional symptoms and ethnic minority status (the study did not distinguish between first- and second-generation migrants), after adjustment for drug addiction, anxiety and depressive disorders (odds ratio 1.3, 95% CI 1.0–1.7).Reference Saha, Scott, Varghese and McGrath36
Random effects meta-analysis of four studies of lifetime PLEReference Cohen and Marino20, Reference Binbay, Drukker, Elbi, Tanik, Ozkinay and Onay33–Reference Schwab35 with nine effect sizes showed significant differences between ethnic minorities and the majority group (odds ratio 1.3, 95% CI, 1.1–1.6, I 2 = 82.1%). No publication bias was found in Egger's test (P = 0.5; funnel plot in Supplementary material 2). When analysing PLE by ethnicity, we found a pooled odds ratio of 1.6 (95% CI 1.5–1.8, I 2 = 0.0%) in the Black ethnicity group (three studies, three effect sizes) and an odds ratio of 1.2 (95% CI 0.9–1.6, I 2 = 82.4%) in the ‘other’ ethnic group, compared with the reference group (Fig. 2). To examine the differences in results according to the use of validated questionnaires, we repeated the analysis but included only studies that used validated interviews (CIDI), therefore one study (quality score of 15)Reference Schwab35 was excluded; however, a similar result was observed (odds ratio 1.3, 95% CI 1.0–1.6, I 2 = 83.2%) (Supplementary material 4). When analysing only high-quality studies (quality score >17), we found a slightly increase in the odds ratio (odds ratio 1.4, 95% CI 1.1–1.8, I 2 = 86.7%). Robust variation estimation method could not be used because of the amount of effect sizes under 10.
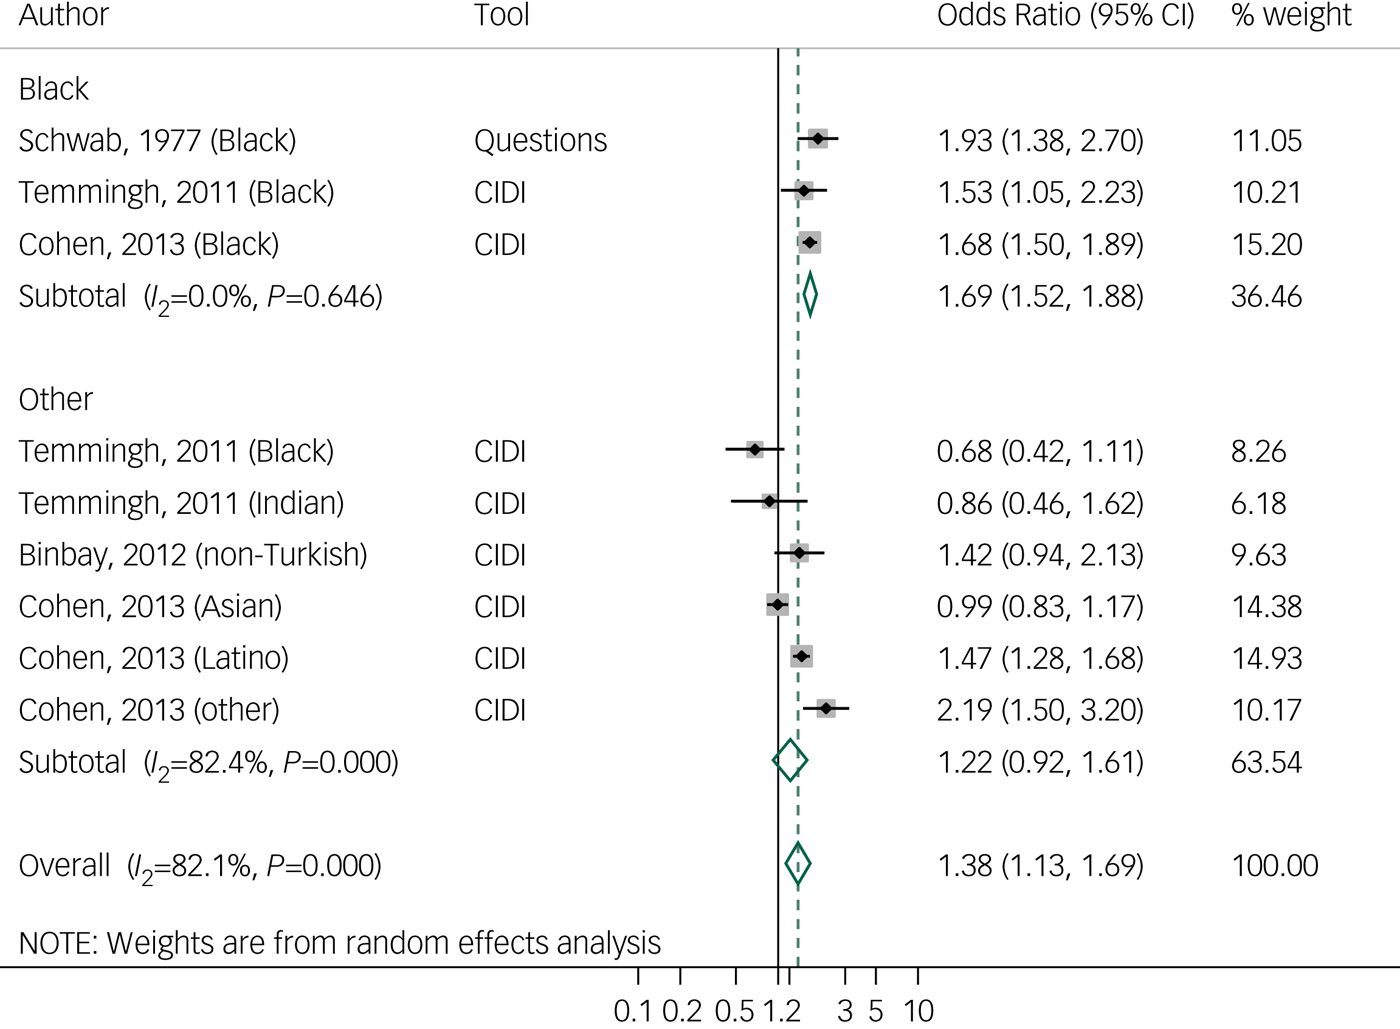
Fig. 2 Forest plot of studies on lifetime psychotic-like experiences, by tool and ethnicity, using random effects meta- analysis, crude odds ratios, and 95% confidence intervals.
CIDI, Composite International Diagnostic Interview.
Current PLE
Eleven citations were found on current PLE by ethnicity, including seven in the UK,Reference Freeman, McManus, Brugha, Meltzer, Jenkins and Bebbington24, Reference Wickham, Taylor, Shevlin and Bentall25, Reference Johns, Nazroo, Bebbington and Kuipers37–Reference Morgan, Reininghaus, Reichenberg, Frissa, Hotopf and Hatch41 one in the USA,Reference Cohen and Marino20 two in the NetherlandsReference Vanheusden, Mulder, van der Ende, Selten, van Lenthe and Verhulst19, Reference Breetvelt, Boks, Numans, Selten, Sommer and Grobbee42 and one in Singapore.Reference Subramaniam, Verma, Cheok, Lee, Wong and Chong18 Study quality scores ranged from 16 to 20 (mean 18.5, s.d. 1.4).
Studies on any current PLE conducted in the UK found results similar to studies on lifetime prevalence, with higher non-adjusted prevalence in Black ethnic groups compared with White majority groups, which decreased but remained significant after adjustments for stressReference Cohen and Marino20 and urban dwelling.Reference King, Nazroo, Weich, McKenzie, Bhui and Karlsen39 One study analysed PLE among Black Caribbean and Black African groups separately, and showed that among Black African groups, this association remained significant after adjustments (odds ratio 3.4, 95% CI 1.1–10.4).Reference Morgan, Reininghaus, Reichenberg, Frissa, Hotopf and Hatch41 In the Netherlands, higher prevalence (odds ratio 2.7, 95% CI 2.1–3.6) was found among non-Dutch individuals compared with Dutch individuals.Reference Breetvelt, Boks, Numans, Selten, Sommer and Grobbee42 In the USA, minority groups (Latino, Black and Asian groups) tended to show significantly higher current PLE prevalence than White groups, even after adjustments for age, gender, stress and drug use.Reference Cohen and Marino20 One study in Singapore among young male pre-enlistees for the National Service observed lower prevalence (after adjustments for age, marital status, education and psychiatric disorders) among the Indian population (odds ratio 0.75, 95% CI 0.5–0.9), but not among the Malay population (odds ratio 1.0, 95% CI 0.8–1.2), compared with the Chinese reference group.Reference Subramaniam, Verma, Cheok, Lee, Wong and Chong18
Hallucinations were reported separately in three studies. In the UK, higher prevalence was found among Black Caribbean women in two studies, in both unadjusted analysis (odds ratio 2.3, 95% CI 1.4–3.8, P = 0.006)Reference Johns, Nazroo, Bebbington and Kuipers37 and adjusted analysis (adjusted for age, IQ, alcohol misuse, victimisation and anxiety or depression; odds ratio 2.4, 95% CI 0.9–6.2).Reference Johns, Cannon, Singleton, Murray, Farrell and Brugha38 In the Netherlands,Reference Vanheusden, Mulder, van der Ende, Selten, van Lenthe and Verhulst19 non-Dutch individuals (mostly Turkish and Moroccan, followed by Antillean/Surinamese, Indonesian and other) tended to show a significantly higher prevalence of hallucinations than Dutch individuals, although there was a reduction (from 28 to 52% across groups) after adjustment for social adversity. Delusions were analysed in two studies in the UK, with similar findings: increased prevalence among Black and Asian groups compared with White groups.Reference Freeman, McManus, Brugha, Meltzer, Jenkins and Bebbington24, Reference Johns, Cannon, Singleton, Murray, Farrell and Brugha38
Random effects meta-analysis of 7 studies of current PLEReference Subramaniam, Verma, Cheok, Lee, Wong and Chong18–Reference Cohen and Marino20, Reference Johns, Nazroo, Bebbington and Kuipers37, Reference King, Nazroo, Weich, McKenzie, Bhui and Karlsen39–Reference Morgan, Reininghaus, Reichenberg, Frissa, Hotopf and Hatch41 with 26 effect sizes showed a pooled odds ratio of 1.8 (95% CI 1.4–2.3, I 2 = 87.2%). There is some weak evidence of publication bias, related to the lack of smaller studies reporting a positive association (Egger's test 0.07; funnel plot in Supplementary material 3). When we used the robust variation estimation method, the odds ratio decreased to 1.4 (95% CI 1.0–1.8, τ 2 = 0.19). We examined differences in results according to the use of a self-questionnaire or an interview, by repeating the analysis with only studies that used interviews (CIDI, PSQ). One study that used a self-questionnaire was excluded,Reference Vanheusden, Mulder, van der Ende, Selten, van Lenthe and Verhulst19 resulting in a small decrease in the odds ratio to 1.6 (95% CI 1.2–2.0, I 2 = 87.3%; Supplementary material 5). Similarly to lifetime PLE studies, analysis with higher-quality studies (quality score >17) showed an increased odds ratio of 2.4 (95% CI 1.7–2.9, I 2 = 79.5%). When analysing by ethnicity, random effects meta-analysis showed a pooled odds ratio of 2.8 (95% CI 1.9–4.1, I 2 = 68.5%) among Black ethnic groups (five studies, six effect sizes) and a pooled odds ratio of 1.0 in the Asian group (95% CI 0.7–1.4, I 2 = 73.4%) (four studies in the UK, six effect sizes) compared with the reference population (Fig. 3). Meta-analyses of hallucinations and delusions outcomes were not performed because of to the small number of studies.
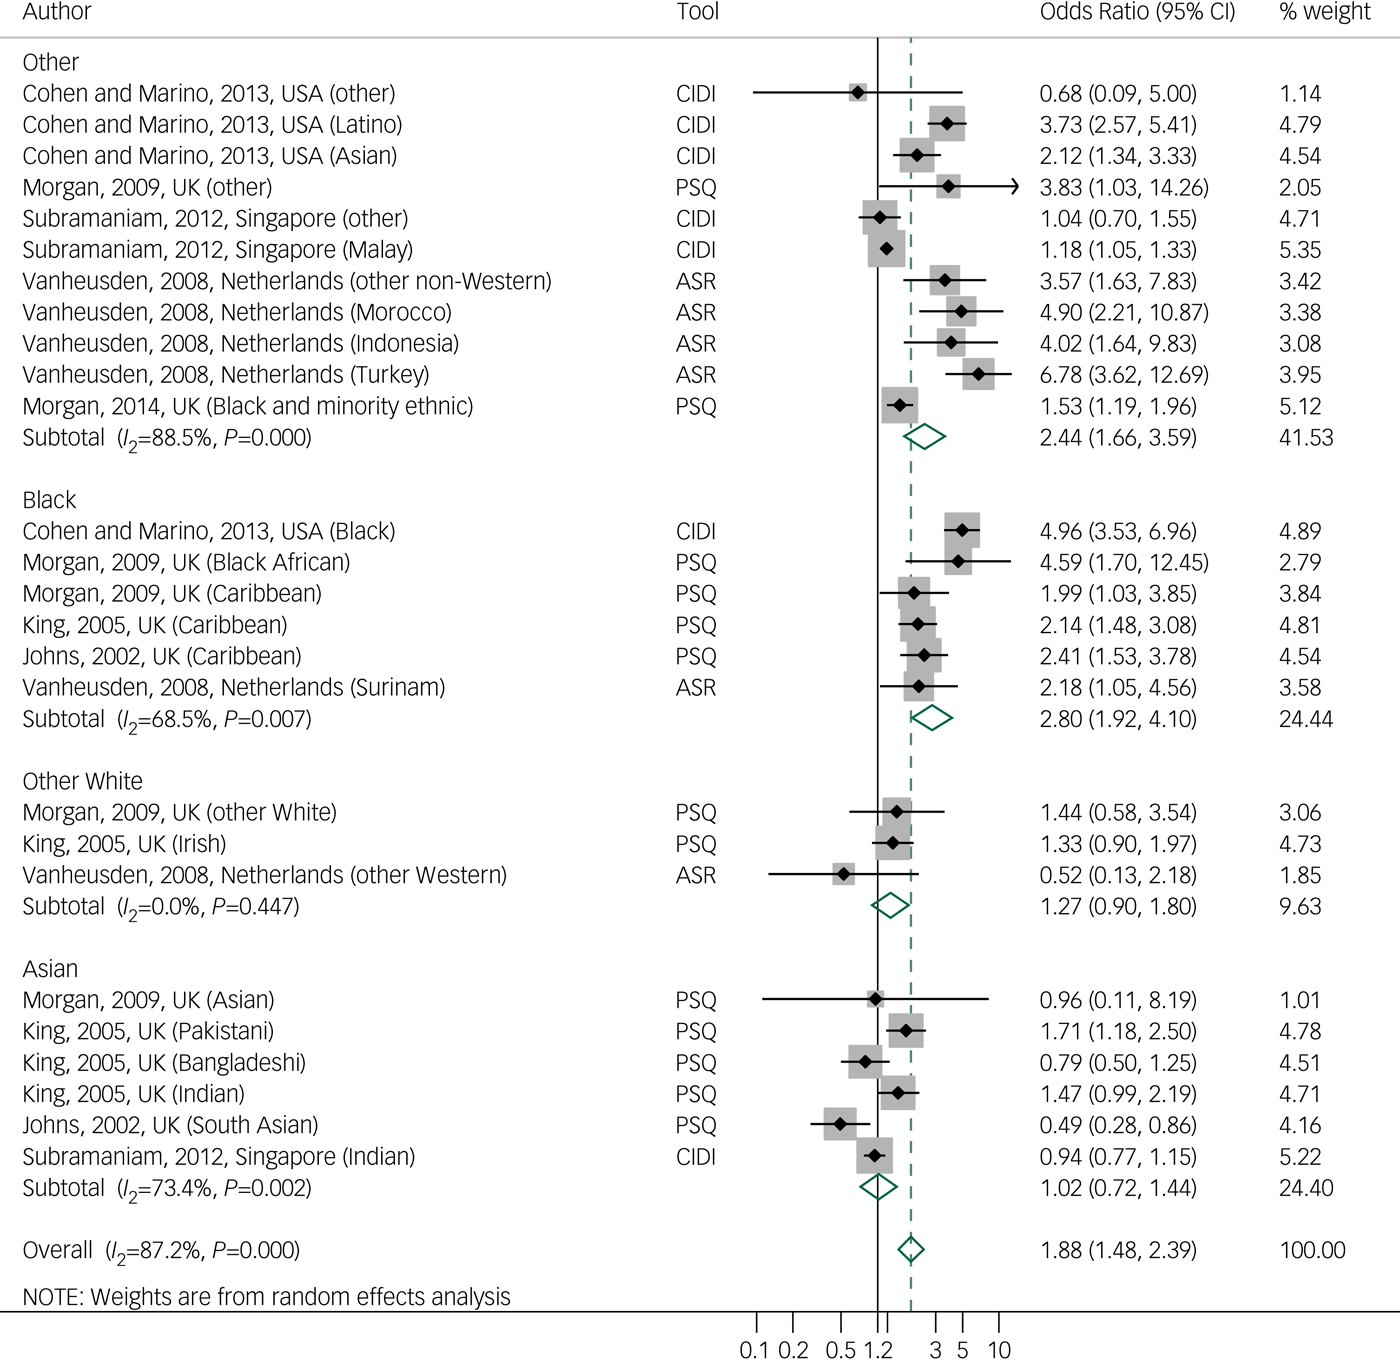
Fig. 3 Forest plot of studies on current psychotic-like experiences, by tool and ethnicity, using random effects meta-analysis, crude odds ratios, and 95% confidence intervals.
ASR, Adult Self Report; CIDI, Composite International Diagnostic Interview; PSQ, Psychosis Screening Questionnaire.
PLE by migrant status
Five studies analysed PLE and migrant status,Reference Cohen and Marino20–Reference Oh, Abe, Negi and DeVylder22, Reference McGrath, Saha, Al-Hamzawi, Alonso, Bromet and Bruffaerts43, Reference Scott, Chant, Andrews and McGrath44 and study quality scores ranged from 17 to 20 (mean 18.8, s.d. 1.1).
A negative association of migrant status with any lifetime PLE (after adjustment for sociodemographic variables; odds ratio 0.8, 95% CI 0.6–1.0) and with hallucinations (odds ratio 0.7, 95% CI 0.5–0.9), but not with delusions (odds ratio 1.4, 95% CI 0.9–2.2), was reported in a cross-national study based on 31 261 responders in 18 middle- and high-income countries.Reference McGrath, Saha, Al-Hamzawi, Alonso, Bromet and Bruffaerts43 In the USA, this negative trend of prevalence of lifetimeReference Cohen and Marino20, Reference DeVylder, Burnette and Yang21 and currentReference Oh, Abe, Negi and DeVylder22 PLE among migrants was replicated in first-generation migrants, but not among their descendants.Reference Oh, Abe, Negi and DeVylder22 In Australia, Scott et al Reference Scott, Chant, Andrews and McGrath44 found increased prevalence of current delusions among migrants of non-English-speaking background compared with migrants of English-speaking background (odds ratio 1.3, 95% CI 1.1–1.5). A meta-analysis was not performed because of the lack of available data on effect sizes and the different criteria used to define migrant status.
Schizotypal traits
Nine studies comparing different ethnic groups were found, but none analysed migrant status. Study quality scores ranged from 7 to 16 (mean 11.6, s.d. 3.1). Eight studies were carried out in the USA, among college students. In the USA, studies that used the Chapman scalesReference Kwapil, Crump and Pickup45–Reference Poreh, Ross, Hanks and Whitman47 observed similar findings: variation of scores across all scales by ethnic group, with an inclination toward lower scores in White groups and higher scores in the Black groups. Two studies that used the SPQ found discrepant results: one study found higher total scores among Asian Americans and higher disorganisation scores among Black Americans,Reference Cohen and Davis48 whereas the second study showed lower disorganisation scores among Black Americans.Reference Goulding, McClure-Tone and Compton49 Adjustment factors may account for these differences (age and gender in the first study, and marital status and history of treatment in the second study). One study that used 11 different scales in 321 participants found higher scores of schizotypal traits in Asian than in White or Black ethnic groups.Reference Kelley and Coursey30 In Hawaii, one study did not report any differences (SPQ-Brief) between ethnic groups,Reference Schiffman50 whereas another reported lower scores of schizotypal traits (SPQ) in the White group and higher scores among Pacific Islanders.Reference Cicero51
One study in the UK analysed schizotypal traits in a small sample (N = 48) from the general population.Reference Sharpley and Peters31 They did not find significant differences in the O-LIFE scale between Black Caribbean and White ethnic groups, adjusting for socioeconomic level. Meta-analysis of these studies could not be performed because of the heterogeneity of scales and measures used, as well as the unavailability of scores by ethnic groups in many studies.
Discussion
Association between subclinical psychosis and ethnicity or migration
Data from 16 studies regarding PLE and ethnicity were analysed. We found evidence in the narrative review and the meta-analysis for an association between ethnicity and PLE, in line with a previous meta-analysis,Reference Linscott and van Os4 although variations were found in contexts and ethnic groups across studies. We extended these outcomes by observing a variation of this risk among different ethnic groups, with a constant trend of higher prevalence of lifetime and current PLE among Black ethnic groups.
We did not find clear evidence of an association between PLE and migrant status. However, except for the cross-national studyReference McGrath, Saha, Al-Hamzawi, Alonso, Bromet and Bruffaerts43 that included European countries, the number of studies included from outside Europe was limited. On the other hand, in line with findings for psychosis, a trend toward higher prevalence of PLE was observed among second-generation migrants.Reference Oh, Abe, Negi and DeVylder22, Reference Saha, Scott, Varghese and McGrath36
With respect to the association between schizotypal traits and ethnicity, the methods used across studies were too heterogeneous to allow for a summary of findings. Moreover, the fact that data were gathered from college students and not the general population provided less reliability and generalisability of results. However, we observed a trend toward lower total scores in White ethnic groups even when they belonged to the ethnic minority.Reference Temmingh, Stein, Seedat and Williams34, Reference Cicero51
Finally, adjustment for gender was made in most studies, with some reporting gender differences (higher prevalence among women) with respect to the prevalence of PLEReference Subramaniam, Verma, Cheok, Lee, Wong and Chong18, Reference Vanheusden, Mulder, van der Ende, Selten, van Lenthe and Verhulst19, Reference Johns, Cannon, Singleton, Murray, Farrell and Brugha38, Reference King, Nazroo, Weich, McKenzie, Bhui and Karlsen39, Reference Binbay, Ulas, Alptekin and Elbi52 and schizotypal traits.Reference Poreh, Ross, Hanks and Whitman47
Does subclinical psychosis have the same risk factors as psychosis?
In studies that provided unadjusted and adjusted odds ratios, we found evidence of a decrease in the effect of ethnicity after adjustment for life and social adversity events (rather than sociodemographic factors),Reference Vanheusden, Mulder, van der Ende, Selten, van Lenthe and Verhulst19–Reference DeVylder, Burnette and Yang21, Reference Wickham, Taylor, Shevlin and Bentall25, Reference Johns, Cannon, Singleton, Murray, Farrell and Brugha38, Reference Morgan, Reininghaus, Reichenberg, Frissa, Hotopf and Hatch41 suggesting that social adversity might be a moderator/confounder for the ethnicity effect in subclinical psychosis, as it is in clinical psychosis.
When comparison was possible, we observed that ethnic groups known to be at risk of psychotic disorders displayed higher prevalence of PLE. This was the case in the UK for Black Caribbean and Black African individuals,Reference Qassem, Bebbington, Spiers, McManus, Jenkins and Dein53, Reference Tortelli, Errazuriz, Croudace, Morgan, Murray and Jones54 and in the Netherlands for Moroccan and Turkish individuals.Reference Vanheusden, Mulder, van der Ende, Selten, van Lenthe and Verhulst19, Reference Selten, Veen, Feller, Blom, Schols and Camoenie55
Strengths and limitations
To our knowledge, this is the first systematic review that focuses on the association between subclinical psychosis and ethnicity and migrant status, providing further evidence of the shared risk factors of the psychosis continuum.
Our study has some limitations leading to a less accurate summary and limited generalisability of findings. We could not perform meta-analysis for migrant status because of insufficient data. Similarly, regarding studies on schizotypal traits, lower-quality assessment scores than PLE studies (schizotypal traits: mean 11.6, s.d. 3.1 v. PLE: mean 18.1, s.d. 1.7) and insufficient availability of crude or homogeneous data did not allow meta-analysis of all studied outcomes, limiting our interpretation to the narrative review. Different assessment methods, outcomes definitions and representativeness of the sample across studies introduced different types of biases, leading to high heterogeneity (I 2) in both current and lifetime PLE meta-analyses. In addition, meta-analyses were performed with unadjusted ratios, which do not reflect the real rates and variance because they can be influenced by other psychosocial risk factors for which no corrections were made, as was observed in studies that used those adjustments. There was a weak evidence of publication bias for current PLE studies related to the lack of smaller studies showing a positive association with ethnicity.
Robust variance estimation could be performed for current PLE studies and showed a decrease in the pooled odds ratios, suggesting an effect of dependent effect size estimates; therefore there is a need for more caution in the interpretation of findings in similar studies that do not correct for this dependency. The association between ethnicity and PLE was not found in any study when considered separately, but only when the studies were analysed together; when we analysed ethnic groups separately, we observed a decrease of inconsistency.
Sensitivity analysis for type of tool showed small differences in results, as observed in previous studies, which suggests that both self-administrated questionnaires and interview-based assessments may show similar reliabilityReference Kelleher, Harley, Murtagh and Cannon56 and are predictive of future psychotic disorders.Reference Kaymaz, Drukker, Lieb, Wittchen, Werbeloff and Weiser57 On the other hand, when we ran meta-analysis with only studies of higher quality (quality score >17), we found higher odds ratios for lifetime PLE (odds ratio 1.4, 95% CI 1.1–1.8 instead of odds ratio 1.3, 95% CI 1.1–1.6) and current PLE (odds ratio 2.4, 95% CI 1.7–2.9 instead of odds ratio 1.8, 95% CI 1.4–2.3), with a decrease in I 2 for current PLE only. Finally, responses could also have been biased by the influence of cultural factors on the expression of emotions and social behaviour, as well as on the cognitive appraisal of the psychiatric experience and explanatory models.Reference Devylder, Oh, Yang, Cabassa, Chen and Lukens58
Interpretation of findings
In concordance with the psychosis proneness-persistence-impairment model, emerging data show that increased exposure to social adversity is associated with risk of subclinical psychosis.Reference van Os, Linscott, Myin-Germeys, Delespaul and Krabbendam2, Reference Kaymaz, Drukker, Lieb, Wittchen, Werbeloff and Weiser57 On the other hand, growing evidence shows that subclinical psychosis might not only be related to psychosis, but also to other psychiatric conditions (depression, anxiety, post-traumatic stress disorder), making it difficult to differentiate specific putative mechanisms.Reference DeVylder, Burnette and Yang21, Reference Breetvelt, Boks, Numans, Selten, Sommer and Grobbee42
Moreover, the variation of the prevalence of subclinical psychosis across different ethnic groups suggests that psychosocial risk and protective factors interplay and may affect these populations differently. For instance, the tendency toward higher prevalence of subclinical psychosis observed among Black ethnicity groups across countries and continents is consistent with findings related to associated risk factors for psychosis, such as experiences of discrimination and racism,Reference Nazroo59 as well as the vitamin D deficiency hypothesis.Reference McGrath, Burne, Feron, Mackay-Sim and Eyles60 In the same vein, we observed that differences in acculturation factors such as language proficiency may play a role in the development of PLE.Reference Scott, Chant, Andrews and McGrath44 Finally, the ethnic density effectReference Das-Munshi, Becares, Boydell, Dewey, Morgan and Stansfeld61 has been shown to be an important protective factor, although the potential mechanisms (stress-buffering effect) and factors underlying this effect (social support, social capital) are not completely understood.Reference Ehsan and De Silva62
In our review, the weak association observed in the narrative review between PLE and migrant status (in USA and Australia) may seem to contradict the large evidence base for a positive association mostly established in European countries. Possible explanations to our findings may be related to, and the influence of, sociopolitical contexts on their living conditions across countries, such as immigration policies (national origin quotas, the choice of skilled migration, screening for diseases) and resettlement factors (access to regular status, housing, jobs and health).Reference Oh, Abe, Negi and DeVylder22 Likewise, the ‘healthy immigrant effect’ (better health status than natives) is shown to be heterogeneous across European countries.Reference Moullan and Jusot63 However, the lack of consistent association between migrant status and subclinical psychosis is not in favour of the selective migration hypothesis, which suggests that individuals more prone to developing psychosis have a greater tendency to migrate.Reference Ødegaard64
The role of biological and inflammatory factors has been scarcely studied in these groups. Furthermore, despite the fact that the association between cannabis use and psychotic disorders and subclinical psychosis outcomes is well documented,Reference Di Forti, Marconi, Carra, Fraietta, Trotta and Bonomo65, Reference Szoke, Galliot, Richard, Ferchiou, Baudin and Leboyer66 the effect of this risk factor in migrant populations is less documented, although some studies suggest a positive relationship.Reference Allegri, Belvederi Murri, Paparelli, Marcacci, Braca and Menchetti67, Reference Ballon, Ursulet, Merle, Eynaud, Charles-Nicolas and Michalon68
To conclude, this study reveals evidence that ethnicity is associated with subclinical psychosis. However, when exploring environmental risk factors of the psychosis continuum, the development of more generalisable and standardised cohort studies of PLE and schizotypal traits in relation to migration and ethnicity are necessary to examine the effect of multiple exposures in different contexts, and to understand the underlying mechanisms across different migrant generations and ethnicities.
Acknowledgements
We thank Sarah Boster from INSERM (U-955), for English language editing.
Supplementary material
Supplementary material is available online at https://doi.org/10.1192/bjo.2018.68.


 Open access
eLetters
No eLetters have been published for this article.