


Severe mental illness (SMI), including schizophrenia, bipolar disorder and severe major depression, affects approximately 5% of the adult population and is associated with increased all-cause mortality, leading to an average of 15 years of potential life lost.Reference Lawrence, Hancock and Kisely1–Reference Cuijpers, Vogelzangs, Twisk, Kleiboer, Li and Penninx4 This is predominantly due to the high prevalence of physical comorbidities, which is twice as high as in the general population and is significantly increased by adverse effects of medications and further compounded by sedentary lifestyle, poor diet and high rates of psychosocial stressors.Reference Firth, Siddiqi, Koyanagi, Siskind, Rosenbaum and Galletly5–Reference Vancampfort, Firth, Schuch, Rosenbaum, Mugisha and Hallgren9 Given the multifactorial impacts on morbidity and mortality, it can be challenging to identify which individuals with SMI should be prioritised for specific prevention or early intervention services. The concept of frailty, which can encapsulate biological ageing, comorbidity and psychosocial impairments, holds utility in summarising individual needs and allowing complex comparisons. Frailty is a medical syndrome characterised by age-related changes, across multiple body systems, that increase vulnerability to stressors.Reference Mutz, Choudhury, Zhao and Dregan10,Reference Morley, Vellas, van Kan, Anker, Bauer and Bernabei11 As a measure, frailty is increasingly used in a wide variety of medical specialties to prognosticate adverse health outcomes, with several frailty measurement tools being developed, although none specific to psychiatric populations.Reference Morley, Vellas, van Kan, Anker, Bauer and Bernabei11–Reference Zhao, Liu, Tyrovolas and Mutz14 Emerging evidence highlights a higher prevalence of frailty in those with SMI associated with negative health outcomes and increased mortality, although much of this work has focused exclusively on older adults and has been limited by small numbers.Reference Alyazidi, Shakhau, Huang and Bettwieser15–Reference Pearson, Siskind, Hubbard, Gordon, Coulson and Warren17 Large cohorts, such as the UK Biobank, have been used to show elevated rates of frailty in adults with common mental disorders, such as depression and anxiety.Reference Mutz, Choudhury, Zhao and Dregan10 A small proportion of the previous UK Biobank study population (around 2.6%) included individuals with bipolar disorder and this subgroup showed the largest difference in frailty from the non-psychiatric comparison group and highest hazard ratio for all-cause mortality, although of note, participants with psychosis were excluded from this work.Reference Mutz, Choudhury, Zhao and Dregan10 The primary aim of the present study was to assess the prevalence of frailty in the UK Biobank sample, comparing those with and without a lifetime history of SMI while adjusting for demographic and sociodemographic factors.
Method
Participants
A nested cross-sectional analytical study of participants in the UK Biobank baseline assessment was conducted. The UK Biobank is a prospective, multicentre longitudinal cohort study, where 502 412 people aged between 37 and 73 years were non-randomly recruited by mailed invitations (5.5% response rate) and provided baseline data at 1 of 22 assessment centres across England, Scotland and Wales between 13 March 2006 and 1 October 2010.Reference Sudlow, Gallacher, Allen, Beral, Burton and Danesh18 The study design has been described in detail elsewhere.Reference Bycroft, Freeman, Petkova, Band, Elliott and Sharp19 Baseline assessment included the completion of a touchscreen questionnaire, nurse-led interview and physical measurements. Hospital episode statistics for in-patients have been linked to the UK Biobank, detailing hospital admissions, diagnoses and mortality.
Presence of SMI was defined as one of the following ICD-10 codes at baseline from hospital records, based on previous work: schizophrenia spectrum disorders: F20.0–29.0; bipolar affective disorder: F31.1–31.9; and severe depression: F32.1–32.3 and F33.1–33.3.Reference Pearson, Siskind, Hubbard, Gordon, Coulson and Warren17 The groups were not mutually exclusive. The comparison group included all other participants of the UK Biobank without an SMI. Sociodemographic confounders came from the UK Biobank baseline survey and included age, gender, ethnicity, employment status and country of birth.
Outcomes
Three frailty indices were employed: a frailty index, physical frailty phenotype (PFP) and the Hospital Frailty Risk Score (HFRS), with the first two measures previously modified for UK Biobank participants.Reference Hanlon, Nicholl, Jani, Lee, McQueenie and Mair20,Reference Williams, Jylhävä, Pedersen and Hägg21
Frailty index
The frailty index used is a 49-item scale calculated by the total number of deficits present divided by total potential deficits and has established cut-offs: relatively fit (≤0.03); less fit (>0.03–0.1); least fit (>0.1–0.21); frail (>0.21); and most frail (≥0.45).Reference Williams, Jylhävä, Pedersen and Hägg21,Reference Blodgett, Theou, Kirkland, Andreou and Rockwood22 These deficits include physical health disorders such as diabetes, asthma and cancer, as well as sensory deficits, pain, measures of well-being and infirmity (Supplementary material A available at https://doi.org/10.1192/bjo.2023.580). Participants with ten or more missing variables were excluded, consistent with previous research.Reference Williams, Jylhävä, Pedersen and Hägg21
Physical frailty phenotype
The 5-item PFP operationalised with UK Biobank data is calculated based on the presence of weight loss (intended or not) in the past year, exhaustion in the past 2 weeks, low physical activity in the past 4 weeks, grip strength and slow usual walking pace.Reference Mak, Kuja-Halkola, Wang, Hägg and Jylhävä23 Answers were transformed into binary outcomes (Supplementary material B). The PFP categorises participants as: not frail (meeting no criteria); pre-frail (meeting 1 or 2 criteria); and frail (meeting 3–5 criteria). Participants missing one or more variables were excluded.
Hospital Frailty Risk Score
The HFRS is a 109-item summary score based on electronic hospital record ICD-10 codes, recorded during a person's hospital admission, that are weighted based on their association with frailty.Reference Gilbert, Neuburger, Kraindler, Keeble, Smith and Ariti24 It categorises frailty based on the number and weighting of HFRS items present: low risk (<5); intermediate risk (5–15); and high risk (>15) (Supplementary material C). Participants without a recorded hospital admission during the follow-up period were coded as 0, following previous studies using the HFRS.Reference Mak, Kuja-Halkola, Wang, Hägg and Jylhävä23
Statistical analysis
All statistical analysis and data visualisations were done in Stata 17.0 for Windows25 using the user-written command ‘sta Version 1.1.8’.Reference Doménech and Sesma26
To examine the distribution of the data across age, considered the key confounder, a stratified analysis was chosen over regression modelling as an initial approach to data analysis. The ratio of frailty prevalence between individuals with each SMI and those without SMI was compared for each of the three frailty measures. Confidence intervals were constructed using the modified Wald method.Reference Agresti and Coull27
As a sensitivity analysis, binary logistic regressions with the frailty index as the dependent variable dichotomised by whether participants were frail (>0.21) or not (≤0.21) were conducted to adjust for multiple variables simultaneously. The assumptions of these regressions were tested with multiple approaches. Two-way tables were used to check that no more than 20% of minimum expected cell frequencies were under five for all combinations of categorical variables. Generalised additive models (GAM) using the Stata module ‘GAM’Reference Royston and Ambler28 examined whether age had logit linearity. Variance inflation factors (VIF) for individual variables and the mean VIF for all variables were inspected for signs of multicollinearity using the ‘collin’Reference Ender29 module. Multivariate outliers were detected using the blocked adaptive computationally efficient outlier nominators (BACON) algorithm,Reference Billor, Hadi and Velleman30 with the 15th percentile of the χ2 distribution used as a threshold to distinguish outliers from non-outliers using the ‘bacon’Reference Weber31 module in Stata. Confounding bias was addressed through binary logistic regression and recall, and misclassification bias was minimised by using ICD-10 diagnoses of SMI from hospital episode statistics for the HFRS.
Ethics
The authors assert that all procedures contributing to this work comply with the ethical standards of the relevant national and institutional committees on human experimentation and with the Helsinki Declaration of 1975, as revised in 2008. All procedures involving human subjects were approved by North West Haydock Research Ethics Committee (Reference 16/NW/0274, 13 May 2016) and this research was conducted under application number 81605. All participants in the UK Biobank gave written informed consent for data collection, record linkage and use of data in future research.
Results
Of the 502 412 participants in the UK Biobank with a baseline assessment, a frailty index could not be calculated for 0.46% of the total sample and a PFP could not be calculated for 0.64%. Regarding the HFRS, a value of 0 was assigned to people without recorded hospital admissions by the end of the baseline assessment (n = 168 613, 34%). The demographics and sociodemographic variables for those for whom a frailty index could be calculated are presented in Table 1. There were 2137 individuals with SMI, of whom 251 were coded as having severe depression as well as either schizophrenia spectrum disorders or bipolar affective disorder.
Table 1 Demographic characteristics for participants with a frailty index

SSD, ICD-10 schizophrenia, schizotypal and delusional disorders; BPAD, ICD-10 bipolar affective disorders; Dep, ICD-10 severe depression; SMI, severe mental illness.
a. The three individual SMI groups do not total 2137 as 251 participants from these groups had another comorbid SMI.
b. Employment status does not sum to 100.0% as one participant could have multiple responses.
The prevalence of frailty in both participants with and without SMI was highest using the frailty index, followed by the PFP and the HFRS (Table 2). Compared with the total cohort, which had a prevalence of frailty using the frailty index of 10.8% (95% CI 10.8–10.9), those with SMI had 3.5 times higher prevalence of frailty. The prevalence ratio was 4–4.7 times higher using the PFP and 17–23 times higher using the HFRS, noting that the prevalence of frailty was low in both the SMI and non-SMI groups when employing the HFRS. In a sensitivity analysis that removed people without SMI who had no hospital admissions from the comparison group, prevalence ratios attenuated to range from 11 to 15 (Supplementary material D). The distribution of frailty in those with schizophrenia spectrum disorders, bipolar affective disorder and severe depression was similar across the three groups (Fig. 1).
Table 2 Prevalence of frailty in participants with severe mental illness in the UK Biobank, using three measures

SSD, ICD-10 schizophrenia, schizotypal and delusional disorders; BPAD, ICD-10 bipolar affective disorders; Dep, ICD-10 severe depression; SMI, severe mental illness; Prevalence, percentage of participants with frailty compared with total sample; Prevalence ratio: ratio of frailty in people with each SMI to people without SMI; n.a., not applicable.

Fig. 1 Kernel density plot of the frailty index comparing severe mental illness.
SMI, severe mental illness; SSD, ICD-10 schizophrenia, schizotypal and delusional disorders; BPAD, ICD-10 bipolar affective disorders; Dep, ICD-10 severe depression.
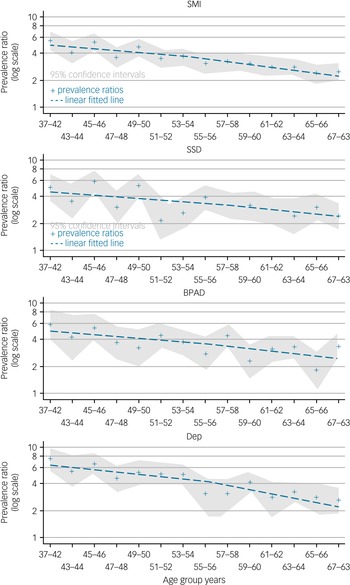
Using the frailty index, the difference in frailty prevalence between participants with SMI and those without SMI, prevalence ratio, is highest in the youngest age group. The difference in frailty prevalence decreases with age for each group of disorders, as well as for all SMI (Fig. 2, Supplementary material E). The reduction of the prevalence ratio, considered to be the narrowing of the prevalence difference between each SMI and no SMI with age, is less in participants with bipolar affective disorder and schizophrenia spectrum disorders compared with severe depression (Fig. 2, Supplementary material E).

Fig. 2 Prevalence ratio with age for severe mental illness using the frailty index.
SMI, severe mental illness; SSD, ICD-10 schizophrenia, schizotypal and delusional disorders; BPAD, ICD-10 bipolar affective disorders; Dep, ICD-10 severe depression.
Again using the frailty index, frailty was higher in women compared with men in all subgroups, and this difference was greatest in those with bipolar affective disorder, followed by schizophrenia spectrum disorders (Supplementary material F).
Using binary logistic regression to create an adjusted model for age, gender, ethnicity and country of birth (Supplementary material G), the prevalence ratio for each SMI compared with no SMI was elevated, with the greatest change for participants with schizophrenia spectrum disorders (Supplementary materials H, I). When looking at confounders overall, most variables were associated with frailty (Supplementary materials J, K).
Discussion
This study demonstrates a 3–18 times increase in frailty among people with SMI compared with controls in over 500 000 UK Biobank participants. This is the largest study of frailty in people with SMI and these findings corroborate and enhance those of smaller studiesReference Alyazidi, Shakhau, Huang and Bettwieser15–Reference Pearson, Siskind, Hubbard, Gordon, Coulson and Warren17,Reference Pearson, Siskind, Hubbard, Gordon, Coulson and Arnautovska32 and of studies of people with common mental illnessReference Mutz, Choudhury, Zhao and Dregan10 as well as reflecting the known increase of physical health comorbidity in SMI.Reference Firth, Siddiqi, Koyanagi, Siskind, Rosenbaum and Galletly5 Similar to those without SMI, the prevalence of frailty was greater in women and increased with age. In contrast to many studies where associations attenuate after adjusting for confounding variables, the associations here increased slightly, which was probably attributable to people with SMI being on average younger than those without SMI. There was no major confounding in the variables identified from the multivariable analysis.
The prevalence of frailty in SMI was higher than that previously demonstrated in people with depression, anxiety and bipolar affective disorder, also utilising UK Biobank data.Reference Mutz, Choudhury, Zhao and Dregan10 Mutz et al identified participants through a variety of measures, including self-reported hypomania or depression, and excluded all cases with psychosis.Reference Mutz, Choudhury, Zhao and Dregan10 In comparison, this study focused on SMI, which tends to have psychotic symptoms, and utilised only hospital records, resulting in 4 times fewer participants with bipolar affective disorder and 99 times fewer participants with depression. The prevalence of frailty remained higher in those with SMI compared with those without, even in older age groups and especially for those with bipolar affective disorder and schizophrenia spectrum disorders. The significant effects from these severe chronic disorders that continue to occur with age may be related to higher rates of recurrence and the metabolic side-effects of psychotropics.Reference Firth, Siddiqi, Koyanagi, Siskind, Rosenbaum and Galletly5 They may also relate to the cumulative influence of poor health contributors, more common in SMI, such as obesity, smoking, substance use and early life stressors.Reference Firth, Siddiqi, Koyanagi, Siskind, Rosenbaum and Galletly5,Reference Feinstein33 Of note, there was a difference in sociodemographic factors known to affect development of chronic health conditions (such as employment status and household income) between those with SMI and no SMI; however, these factors could not be adjusted for, as confounder status could not be confirmed in a cross-sectional analysis.
An increased prevalence of frailty is an important finding as it has been shown to be a predictor of hospital admissions, health complications, disability and mortality.Reference Mutz, Choudhury, Zhao and Dregan10,Reference Clegg, Young, Iliffe, Rikkert and Rockwood34 Clegg et al demonstrated that a 10% higher baseline in frailty was associated with higher risk of death, especially in those of younger age, which may be especially relevant for the high proportion of younger frail people with SMI.Reference Clegg, Young, Iliffe, Rikkert and Rockwood34 Frailty has also been demonstrated to be associated with higher levels of cognitive impairment, independent of age, potentially an added concern for the known cognitive deficits associated with SMI.Reference Petermann-Rocha, Lyall, Gray, Esteban-Cornejo, Quinn and Ho35–Reference Bora, Yucel and Pantelis37 Although frailty interventions have been found to be effective in populations with various medical conditions,Reference Dent, Martin, Bergman, Woo, Romero-Ortuno and Walston38 there have been limited frailty intervention studies in those with SMI.Reference Arnautovska, Siskind, Pearson, Baker, Reid and Kwan39 Frailty interventions frequently combine exercise, nutrition, medical and pharmacological review, the importance of which are all well appreciated by those caring for people with SMI. Where the concept of frailty in the context of people with SMI, when measured by a tool such as the frailty index, may be particularly beneficial is to capture a more comprehensive account of an individual's functioning and health. By combining interactive effects of biological ageing, comorbidity and psychosocial impairments, this may facilitate a better understanding of an individual's risk of future adverse health outcomes and, importantly, of their corresponding needs. Such a global assessment of an individual may therefore assist in identifying those who may benefit from targeted early intervention strategies, including psychoeducation, lifestyle behaviour support and self-management. Further, frailty assessment may also inform an individual's treatment plan by pinpointing the specific multidisciplinary treatments and interventions required, while advocating for holistic and person-centred care.
Limitations
Three frailty assessment tools were utilised in this study and were able to be applied to the majority of the cohort. Although the frailty index and PFP are commonly used tools in SMI studies, the PFP may be less useful in capturing the completeness of deficits in younger frail individuals,Reference Pearson, Siskind, Hubbard, Gordon, Coulson and Warren17 owing to its brevity and non-capture of psychosocial deficits. Additionally, the frailty index may identify the lower- and middle-end distribution of the frailty continuum better, with benefit in identifying those that were at risk of decline and may respond best to intervention.Reference Mutz, Choudhury, Zhao and Dregan10 The HFRS frailty tool gave a much higher prevalence ratio of frailty for those with SMI and for each disorder category compared with the non-SMI group, even when excluding those without SMI who had no hospital admissions; however, the prevalence of frailty in all groups was very low.
There are other limitations that should be considered when interpreting the results of this study. The response rate for recruitment to the UK Biobank, which employed a non-random sampling, was 5.5% and two frailty measures were based on responses from questionaries rather than objectively measured data. The proportion of those with SMI in the UK Biobank cohort is small and there is a selection bias.Reference Fry, Littlejohns, Sudlow, Doherty, Adamska and Sprosen40 This study found that the difference in frailty prevalence in those with compared with those without SMI narrowed especially after the age of 60 years, an occurrence also noted in earlier UK Biobank work on common mental disorders.Reference Mutz, Choudhury, Zhao and Dregan10 Given the volunteer nature of recruitment, those with less severe or stabilised SMI presentations and older-onset SMI may be over-represented. The UK Biobank participants have been shown to be less likely to be obese, smoke or drink alcohol, to have fewer health conditions and live in less socioeconomically deprived areas than the broader UK population.Reference Fry, Littlejohns, Sudlow, Doherty, Adamska and Sprosen40 This may indicate that potentially an even greater frailty could be expected in those with more severe disorders.Reference Pearson, Siskind, Hubbard, Gordon, Coulson and Arnautovska32 However, it should be appreciated that the direction and magnitude of selection bias cannot be determined from this study. Around 12% of the SMI group had more than one SMI diagnosis, and there may have been some misclassification between bipolar affective disorder or schizoaffective disorder and severe depression. This was not included as a confounder in the adjusted model but could be considered in future work. There may also have been cases of SMI not captured by hospital-based ICD-10 coding and misclassified into the control group.
Future research and implications
Future studies should longitudinally assess frailty, utilise frailty tools that better capture psychological frailty,Reference Zhao, Liu, Tyrovolas and Mutz14 consider the effect of SMI and physical health treatments, and review mortality risk associated with frailty in those with SMI. Additionally, pilot feasibility studies of frailty-focused interventions in people with SMI would be critical in informing the development of frailty interventions for people with SMI who are frail.Reference Arnautovska, Siskind, Pearson, Baker, Reid and Kwan39
Regardless of how frailty in operationalised or when it is assessed, the prevalence of frailty appears to be significantly higher in people with SMI than in those without, and it remains elevated throughout life. Frailty can be a more holistic measure, capturing a wide range of deficits and placing an individual on a continuum that can be monitored over time and compared against general population norms. Its clinical utility is in enabling early identification of comorbidity risk among people with SMI and informing the selection of multidisciplinary, person-centred intervention strategies.
Supplementary material
Supplementary material is available online at https://doi.org/10.1192/bjo.2023.580.
Data availability
Data to support the findings are available in the UK Biobank and further analyses of the data can be found in the supplementary material.
Author contributions
N.W., U.A. and D.S. conceived and designed the study, S.L. extracted and analysed the data, and all authors were involved in drafting and final review of the manuscript.
Funding
This work was supported by a University of Queensland, Mayne Academy of Psychiatry grant.
Declaration of interest
N.W. has received speaker fees from Otsuka, Lundbeck and Janssen. D.S. is supported by a National Health and Medical Research Council (NHMRC) Investigator Fellowship GNT 1194635.


 Open access
eLetters
No eLetters have been published for this article.