


Introduction
The migratory lifestyle is under increasing pressure from global changes in land-use and climate. Avian long-distance migrants, billions of which make annual cross-continental movements (Moreau Reference Moreau1972, Hahn et al. Reference Hahn, Bauer and Liechti2009), show widespread declines (e.g. Robbins et al. Reference Robbins, Sauer, Greenberg and Droege1989, Berthold et al. Reference Berthold, Fiedler, Schlenker and Querner1998, Holt Reference Holt2000, Holmes and Sherry Reference Holmes and Sherry2001, Sanderson et al. Reference Sanderson, Donald, Pain, Burfield and van Bommel2006, Heldbjerg and Fox Reference Heldbjerg and Fox2008, Both et al. Reference Both, Bouwhuis, Lessells and Visser2006, Reference Both, Van Turnhout, Bijlsma, Siepel, Van Strien and Foppen2010, Ockendon et al. Reference Ockendon, Hewson, Johnston and Atkinson2012), raising concern worldwide (Wilcove Reference Wilcove2009).
The causes of these declines remain poorly understood, largely due to a lack of basic ecological knowledge about migratory birds outside their breeding areas (Sheehan and Sanderson Reference Sheehan and Sanderson2012, Vickery et al. Reference Vickery, Ewing, Smith, Pain, Bairlein, Škorpilová and Gregory2014, Adams et al. Reference Adams, Small and Vickery2014). Mortality during the non-breeding season can be high and potentially affect population trends (Winstanley et al. Reference Winstanley, Spencer and Williamson1974, Sillett and Holmes Reference Sillett and Holmes2002, Klaassen et al. Reference Klaassen, Hake, Strandberg, Koks, Trierweiler, Exo, Bairlein and Alerstam2014), and non-breeding conditions have been shown to affect breeding success through carry-over effects (Marra et al. Reference Marra, Hobson and Holmes1998). Land-use and climate changes are commonly assumed to be problematic for landbird migrants during the non-breeding season, but data confirming this is limited (Adams et al. Reference Adams, Small and Vickery2014, Vickery et al. Reference Vickery, Ewing, Smith, Pain, Bairlein, Škorpilová and Gregory2014). Most studies focusing on the Palearctic-African migration systems are based on data from the breeding area only, or utilise remote sensing data from the non-breeding areas (e.g. Ockendon et al. Reference Ockendon, Johnston and Baillie2014). On-the-ground research in the non-breeding areas is lacking (Adams et al. Reference Adams, Small and Vickery2014, Vickery et al. Reference Vickery, Ewing, Smith, Pain, Bairlein, Škorpilová and Gregory2014), with some notable exceptions (e.g. Zwarts et al. Reference Zwarts, Bijlsma, van der Kamp, Sikkema and Wymenga2015, Mallord et al. Reference Mallord, Orsman, Roberts, Skeen, Sheehan and Vickery2016).
Many species of insectivorous migrants winter in the Sahel and Sudanian Savanna zones (Moreau Reference Moreau1972, Pearson and Lack Reference Pearson and Lack1992), despite the fact that these zones dry out during their stay (Kristensen et al. Reference Kristensen, Tøttrup and Thorup2013). These are also the bioclimatic regions in sub-Saharan Africa that have experienced the largest increases in agricultural land and decreases in natural vegetation from 1975 to 2000 (Brink and Eva Reference Brink and Eva2009). However, in these relatively dry zones with sparse and variable tree cover, the effects of habitat conversion may not be exclusively negative. Farming in these areas is often extensive, following a system of rotating fallow, where natural vegetation is allowed to regrow for some years before the land is replanted, and often some trees are left as hedgerows (Callo-Concha et al. Reference Callo-Concha, Gaiser, Webber, Tischbein, Müller and Ewert2013). Such practices reduce tree density, average tree height and likely also tree species diversity, but might provide suitable habitat for some migrants. Studies in the Afrotropics have reported mixed responses to a lower tree density among migratory species (Wilson and Cresswell Reference Wilson and Cresswell2006, Cresswell et al. Reference Cresswell, Wilson, Vickery, Jones and Holt2007, Stevens et al. Reference Stevens, Sheehan, Wilson, Buchanan and Cresswell2010). These range from large declines after conversion into farmland, to a subtle positive effect.
Ideally, management advice on migrant-friendly farming practices in West Africa should be based on assessment of the quality of different habitats. However, habitat quality is inherently difficult to estimate. We study a range of characteristics related to spatial behaviour, habitat preferences and bird densities, which are known to relate to habitat quality in birds. Home range size is normally inversely related to habitat quality (e.g. Tufto et al. Reference Tufto, Andersen and Linnell1996, McLoughlin et al. Reference McLoughlin, Ferguson and Messier2000, Herfindal et al. Reference Herfindal, Linnell, Odden, Nilsen and Andersen2005), with a lower density of essential resources requiring a larger home range for an individual to fulfil its daily requirements (food, water, shelter etc.). A large degree of territory overlap is expected to occur both in low quality habitat, where individuals may not defend large territories, and in very high quality habitat, where individuals tend to be less defensive because of an overabundance of resources (McLoughlin et al. Reference McLoughlin, Ferguson and Messier2000). Both tree species and density affects the amount of available insect prey and hence habitat quality. Zwarts et al. (Reference Zwarts, Bijlsma, van der Kamp, Sikkema and Wymenga2015) found that insectivorous birds avoided 65% of woody species in the savanna zone of West Africa and showed a strong preference for thorny trees. As such, the presence of particular tree types might be more important than the abundance of trees for habitat quality, and this could potentially differ among bird species. In general, bird density is expected to reflect habitat quality. This relationship is commonly found (Bock and Jones Reference Bock and Jones2004) but not always (Horne Reference Horne1983, Johnson Reference Johnson2007). In some cases, good quality habitats harbour small numbers of territorial, high quality individuals, whereas low quality habitats host higher numbers of low quality individuals unable to compete for the best sites. This negative relationship between habitat quality and bird densities seems to be more common in disturbed habitats (Bock and Jones Reference Bock and Jones2004).
Previous studies have focused on the distributions and densities of Afro-Palearctic migrants in different degrees of deforestation on their West African winter grounds (e.g. Jones et al. Reference Jones, Vickery, Holt and Cresswell1996, Creswell et al. Reference Cresswell, Wilson, Vickery, Jones and Holt2007, Stevens et al. Reference Stevens, Sheehan, Wilson, Buchanan and Cresswell2010). Here, we look at the interplay between local-scale spatial behaviour and different habitats as well as how this relates to bird densities in a tropical dry forest and a nearby converted farmland area. We study three common insectivorous, land bird migrant species: Willow Warbler (WW) Phylloscopus trochilus, Melodious Warbler (MW) Hippolais polyglotta and Pied Flycatcher (PF) Ficedula hypoleuca. For these species, we estimate individual spatial behaviour, territoriality, preferences for tree species and size, and bird densities, comparing between sites and among bird species.
Methods
Fieldwork
Fieldwork was carried out at two sites on the southern edge of the Sudan Savanna zone near Damongo, northern Ghana (9.09°N, 1.82°W; Figure S1 in the online supplementary materials) during February and March 2011, February 2012 and February 2013. The first site was in a forest reserve containing continuous tropical dry forest with little human disturbance, hereafter referred to as the “undisturbed site”. There was no logging of trees, but local people collected dead wood for firewood. Dominant tree species were mostly medium-height evergreens such as Daniellia oliveri, Lophira lanceolata, and Erythrophleum africanum. The “disturbed site” was located 4 km from the undisturbed site in an extensive area of heavily degraded forest largely converted to farmland. This area has been logged to make way for agriculture, and although there were still many trees left in the area, the tree density was much lower than in the undisturbed site. Some of the area that had previously been farmed was currently lying fallow, and bushes and small trees were regrowing. Other parts were actively farmed, primarily for maize, but were harvested before our study period (see Figure S1 for aerial photos of the two sites). Dominant trees were mostly evergreen species such as Daniellia oliveri, Acacia sieberiana and (non-native) Azadirachta indica.
We tagged Eurasian-African migrants with 0.31 g VHF radio transmitters having an expected battery life of 21 days (Holohil Systems ltd.). Each transmitter was mounted on a small piece of fabric and glued to an area of shaved skin on the back of the birds using eyelash adhesive. The birds were captured using mist-nets and playback to target species. Netting was focused within a narrow central part of each site. We tracked the birds using handheld VHF receivers (AOR 8000) and directional 3-element Yagi antennas. This was done by homing in on the location, triangulating the exact tree from a distance and then approaching the tree to make visual contact with the bird. A minimum of two positions per day were obtained with at least one hour in between. We only included individuals with more than 10 positions in analyses totalling 30 individuals (Willow Warbler: 9, Melodious Warbler: 10, Pied Flycatcher: 11). There was an average of 21 fixes per bird (averages for the undisturbed and the disturbed site, respectively: WW: 11.3 and 12.8; PF: 24.3 and 23.8; MW: 21.8 and 30.2). Ten birds were eliminated from the study because they either lost the transmitter (n = 2), or disappeared quickly for unknown reasons yielding too few locations (n = 8). Whenever possible, we measured the height of the tree a tracked bird was perched in using a SIE 600a laser range finder with an accuracy of ±1 m; and we noted whether the bird shared the tree with other birds, and whether these were conspecifics. If a bird left the tree before making visual contact to confirm the exact location of the bird (7%), no tree data were taken. This study was carried out in strict accordance with guidelines to the use of wild birds in research of the Ornithological Council (Fair et al. Reference Fair, Paul and Jones2010).
To estimate bird densities, we counted birds along transects recording all birds within 25 m from the transect. To ensure all birds were counted, we established a counting distance and observer walking pace intended to allow detection of all birds in the densest habitat. This pace was 1 km per hour (similar to the suggested in Bibby et al. Reference Bibby, Burgess, Hill and Mustoe2000), with a counting distance of 25 m (similar to that used in Creswell et al. Reference Cresswell, Wilson, Vickery, Jones and Holt2007) and this was adopted in all habitats. The observer recorded the number of individual birds per species along each 100 m transect, amounting to 0.5 ha surveyed per transect. A total of 163 transects were carried out in the undisturbed site and 159 in the disturbed site. Handheld GPS-receivers were used to ensure that transect lines were distributed evenly across the sites, and to measure the distance walked. Densities were estimated in 2013. Point counts carried out in 2011 and 2012 were not useful for estimating densities of migrants for this study as they were not aligned with the tracking, had little focus on migrants, and lacked distance measurements. Likewise, we conducted two landscape feature transects to record availability of tree species and tree heights in the two sites. At points every 25 m along the transect, we recorded and identified all trees taller than 2 m growing within a 5-m radius of the point (79 m2) and measured height and crown diameter, resulting in 130 plots in the disturbed site and 68 plots in the undisturbed site. The undisturbed site had a significantly higher tree density (7.5 ± 4.5 trees/plot [mean ± SD]) than the disturbed site (4.7 ± 4.6 trees/plot; df = 195, z-value = 6.9, P < 0.001). The density of trees taller than 10 m was likewise higher in the undisturbed site (0.8 ± 1.0 trees/plot) than in the disturbed site (0.3 ± 0.6 trees/plot; df = 195, z-value = 4.1, P < 0.001).
Data analyses
Home range size
All analyses were done in R 2.14.0 (R Development Core Team 2011). We calculated home range size and overlaps using functions from the R-package ‘adehabitatHR’ (Calenge Reference Calenge2006). We calculated home range size using 100% minimum convex polygons (MCP) and 95% bivariate normal fixed kernel densities (KD), using the reference (href) approach to estimate the smoothing factor (Worton Reference Worton1989, Reference Worton1995). As a measure of core home range we calculated 50% MCP and 50% KD. We used species, site, interaction between species and site, number of relocations and first day of tracking as predictors of log-transformed home range size in a general linear model. Non-significant parameters were eliminated with a backward procedure starting with the interaction (Engqvist Reference Engqvist2005). Number of relocations and first day of tracking were always included as nuisance parameters to account for the potential effects of different time of year and sample size (Naef-Daenzer Reference Naef-Daenzer1993, Worton Reference Worton1995). We also ran models with tree density per home range instead of site to investigate which effect had highest predictive power. Tree density was extracted per home range from a 30-m resolution grid downloaded from Global Forest Watch (Hansen et al. Reference Hansen, Potapov, Moore, Hancher, Turubanova, Tyukavina, Thau, Stehman, Goetz, Loveland, Kommareddy, Egorov, Chini, Justice and Townshend2013). It is measured as percentage of tree cover >5 m height.
Territoriality
We used two measures of territoriality. Home range overlap among tracked individuals was used to quantify the degree of space sharing and to evaluate where in the home range overlap occurs (core or periphery). Information on temporal overlap was gained from whether tracked individuals shared trees with conspecifics or not.
As a measure of space sharing, we calculated the home range overlap between tracked conspecifics. We used the average of each individual’s overlaps with all other conspecifics within the same year and site. We calculated overlap as the probability (PHRi,j) of an individual being in another conspecific’s home range by using the utilisation distributions underlying the kernel densities (Fieberg and Kochanny Reference Fieberg and Kochanny2005). We used this estimate to model home range overlap, but we also calculated the utilisation distribution overlap index (UDOI) to ease interpretation of the quantified space-use sharing. Values > 1 indicate more space-use in the overlap than expected from uniform space-use (overlap in core areas of home range), and values < 1 indicate less than uniform space-use in the overlap area (overlap in the peripheral part of the home range). We also report the overlap of the 95% and 50% KD (HRi,j), measured as the proportion between overlap area and an individual’s full home range area. We modelled the overlap (PHRi,j) in the same way and with the same predictors as home range size, though without ‘tree density’, as a meaningful measure of this cannot be attributed to a probabilistic overlap with no well-defined geographical extent. Because not all neighbouring conspecifics on each site were tracked, the estimates of overlap are uncertain. Because we used average overlap between pairs of individuals, a low number of tracked individuals will not bias the result – only increase variation. The procedures are similar across sites and species, making estimates overall comparable.
To evaluate if the birds overlapped in both space and time, we calculated the frequency of occasions where the tracked birds shared a tree with other birds, and how often these were conspecifics. We modelled both sharing with other birds and sharing with conspecifics as generalised linear models with a logit link (logistic regression) with occasions of tree sharing modelled as a binary response variable. Bird species, site and interaction between species and site were included as possible predictors of either measure of territoriality. We evaluated the performance of each predictor based on p-values where we removed non-significant predictors starting with the interaction.
Habitat selection
To investigate potential preferences for specific tree types, we modelled the probability of using a tree as a generalised linear mixed effects model (GLMM) with a logit link (logistic regression). We modelled the use of trees where used trees were given the value 1 and available trees were given the value 0. The trees recorded on our landscape feature transects were defined as available trees and the trees in which the tracked birds were observed were considered used trees following Manly et al. (Reference Manly, McDonald, Thomas, McDonald and Erickson2002). In the full model we included site, tree height, bird species, tree genus, the interaction between bird species and tree genus and the interaction between site and tree genus as fixed effects and bird individual as a random effect. This resulted in a ranked preference for the tested tree genera, i.e. which tree genera the birds preferred over others, as well as significant differences between bird species in their preference for tree genus (significant interaction between bird species and tree genus). We also modelled tree use without tree height and without tree genus, to test the explanatory power of either. We only included the five tree genera most commonly available, and pooled the rest in a category termed “other”. In the forest site, the latter category comprised 42 genera and 43% of the tree volume, and in the disturbed site, this group was 39 different genera and 28% of the tree volume. When testing for selection of tree genus, the availability dataset was weighted for volume (calculated as crown area*tree height) within each tree genus. This was done by randomly sampling a number of available trees from each genus, corresponding to the proportion of total tree volume in each genus. For example, a genus comprising 10% of total tree volume would be represented by 10% of the number of trees in the availability dataset. When testing for selection of tree height the availability dataset was weighted for volume within each tree height (whole metre). When modelled this way, a significant effect of tree height shows that the used trees were higher than expected by the volume of available high trees. The modelling was done in R 3.1.0 using various packages. Parameters were evaluated using P-values. P-values for each of the categories of a categorical parameter were obtained using the package “lme4” (Bates et al. Reference Bates, Maechler, Bolker and Walker2014); P-values for each categorical parameter were obtained using the package “afex” (Singmann Reference Singmann2014); and the package “MuMIn” (Barton Reference Barton2014) was used to obtain marginal R-square values.
Density
To compare bird abundance among species and sites, we modelled the number of birds in a 100-m transect using multiple regression assuming a Poisson error distribution. We ran this model per site with species as a predictor and per species with site as a predictor. Of the tracked birds (also including those with too few points for measuring home ranges), we compared body mass and wing length between sites for each species using Mann-Whitney U test in R 3.1.0 (Figure S2).
Results
Home range size
Overall, there was a significant effect of site, where average home ranges were larger in the disturbed site compared to the undisturbed site (Table 1 and S1, Figures 1 and 2; 95% KD: t6,24 = 2.3, P = 0.031; 100% MCP: t6,24 = 2.0, P = 0.053; 50% KD: t6,24 = 2.5, P = 0.019; 50% MCP: t6,24 = 3.2, P = 0.004). The interaction between species and site/tree cover added very little explanatory power to the models (Table S2) and we excluded it from the models. Only in the model of size of MCP50 was there some support for including the interaction term (Table S2). Adjusted R2-values were very similar between models with site and percentage forest cover per home range (Table S2). The number of tall trees per home range was similar between sites (Table S3). Besides site or tree cover, species was also significant. Willow Warblers had the largest average home range (mean ± SD: 12.0 ± 9.7 ha; 100% MCP; n = 9); it was considerably smaller in Melodious Warblers (3.1 ± 3.8 ha; n = 10), and even smaller in Pied Flycatchers (1.6 ± 1.7 ha; n = 11).
Table 1. Effect of species and site on five different home range parameters (see text), including t-statistics, P-values, estimates of the effect of the predictors (compared to a baseline model with Pied Flycatcher at the undisturbed site) and multiple R2 of the model. We run models with site as a predictor as well as models with tree cover as a predictor.

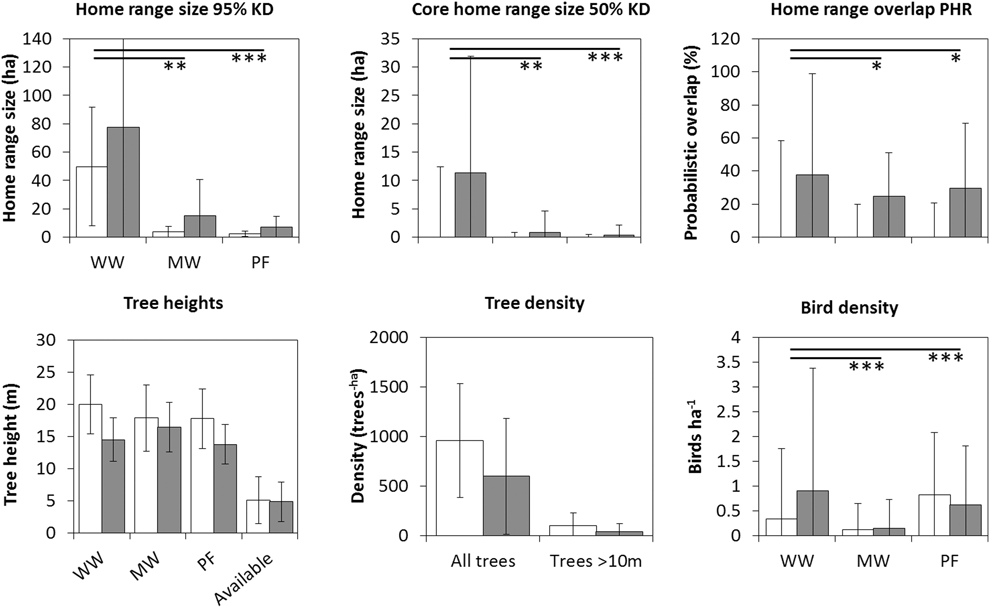
Figure 1. Average home range size, core home range size, home range overlap, tree heights, tree density and bird density for each species in the undisturbed site (open bars) and disturbed site (filled bars). Error bars indicate standard deviation. PF = Pied Flycatcher Ficedula hypoleuca, WW = Willow Warbler Phylloscopus trochilus, MW = Melodious Warbler Hippolais polyglotta. Home range size estimated using 95% fixed kernel (KD) and core home range using 50% KD. Significant differences between species is indicated as *P < 0.05, **P < 0.01 or ***P < 0.001. Significant differences between sites were found in core home ranges, tree density (both height groups) and bird density (only Willow Warbler).
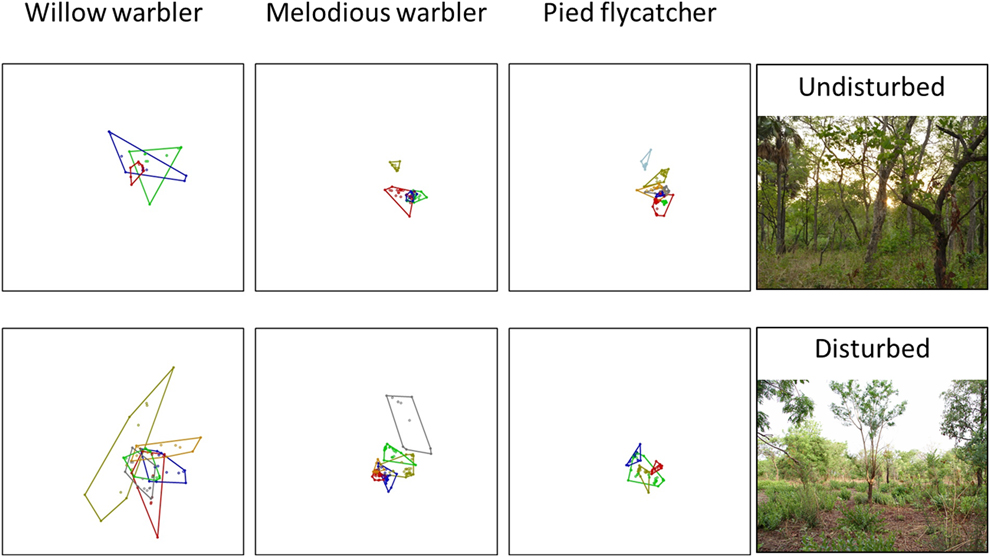
Figure 2. Home range size. Minimum convex polygons for three different species of Palearctic migrants at an undisturbed (top) forest reserve and an area disturbed by agricultural activities (bottom) during the non-breeding period in northern Ghana. Each box is 2,000m x 2,000m (400 ha).
Territoriality
The model predicting average home range overlap included only species, as neither site nor the interaction between site and species were significant (Table S2, Table 1). The overlap was larger in Willow Warblers (PHR 95% kernel: 60 ± 28% [mean ± SD], n = 9) than both Melodious Warblers (24 ± 20%, n = 8) and Pied Flycatchers (28 ± 32%, n = 11). The overlap index (UDOI) followed the same pattern between species, but for all species they were less than 1, indicating that the space sharing was not in the core area of the home ranges (Table S1). The logistic model predicting how often the birds shared a tree with other birds included only species, where WW (72% of observations, n = 65) was significantly more social than MW (56%, n = 70; z = 2.1, P = 0.037), which in turn was more social than PF (33%, n = 123; z = 3.0, P = 0.002). The model predicting the probability of sharing a tree with a conspecific included species and site. Willow Warbler differed from the other two (MW: z = 4.1, P < 0.001; PF: z = 4.3, P < 0.001) in being the only one that frequently shared a tree with conspecifics (MW: 3%, n = 39; WW: 74%, n = 47; PF: 3%, n = 40; Figure 3). The effect of site (z = 3.4, P < 0.001) is caused by the fact that Willow Warblers in the disturbed site shared a tree with conspecifics more often than in the undisturbed site (disturbed: 93% of tree sharing occasions, n = 20; undisturbed: 50%, n = 27; P < 0.001; Figure 3). The mean number of conspecifics on those occasions was, however, similar between sites (disturbed: 3.12 ± 1.76 [mean ± SD]; undisturbed: 3.3 ± 1.70).
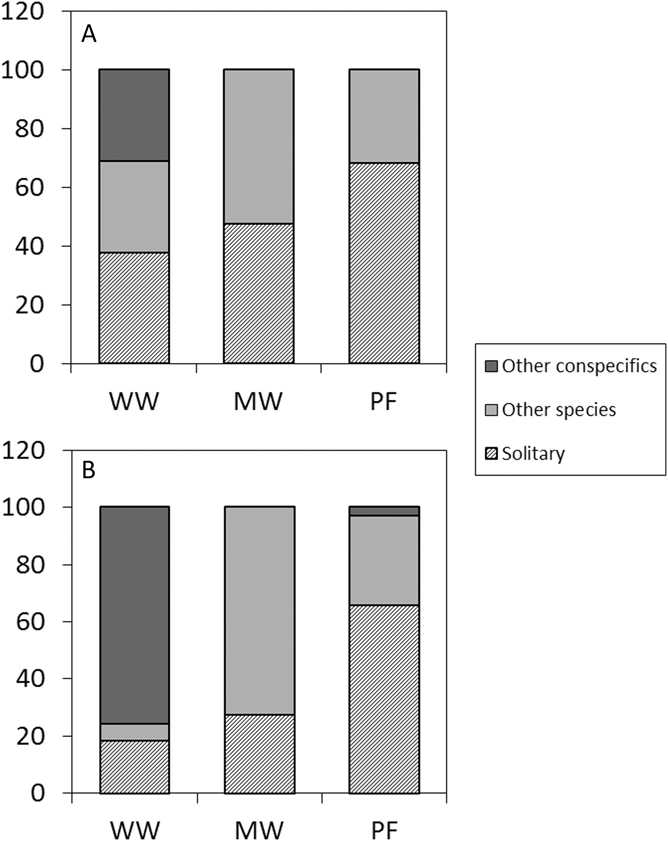
Figure 3. Social behaviour. Frequency of occasions when a tracked bird was either solitary, sharing the tree with a different species or sharing the tree with a conspecific in the undisturbed site (A) and the disturbed site (B), respectively.
Habitat selection
The tracked birds selected for tree height (z = 14.5, P < 0.001), and selected specific tree genera more than others (Chi2 = 306.5, P < 0.001, Figure 4). Selection of tree genus differed between bird species (Chi2 = 39.1, P < 0.001, Figure 4) and sites (Chi2 = 89.4, P < 0.001, Figure 4).
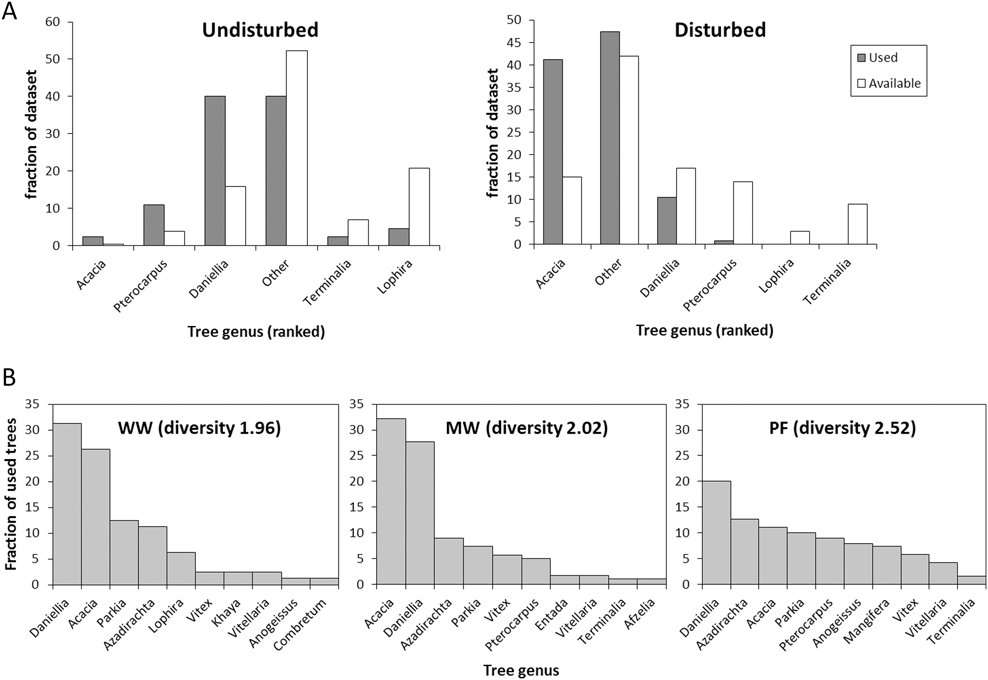
Figure 4. Habitat selection. A) Selection frequency (used trees: filled bars) of the five most common tree species in direct comparison with available volume (open bars) at the undisturbed site (left) and disturbed site (right). The tree genera are ranked after preference within each site. B) The frequency of use of the 10 most commonly used tree genera for each species (both sites combined). Diversity denotes the Shannon-Wiener diversity index for each species.
The birds used trees that were taller (PF: 15.1 ± 5.1 m [mean ± SD]; WW: 16.1 ± 4.8 m; MW: 13.7 ± 5.6 m) than the average available trees (5.0 ± 3.3 m; Table S4). All three species used taller trees In the undisturbed site than in the disturbed site (PF: 17.0 ± 5.1 m; vs 12.2 ± 3.8 m, t2,186 = 7.0; P < 0.001; WW: 20.0 ± 4.6 m vs 13.9 ± 3.3 m, t2,80 = 7.0; P < 0.001; MW: 17.5 ± 5.3 m vs 10.8 ± 3.7 m, t2,175 = 10.0; P < 0.001). This likely reflects higher availability of tall trees in the undisturbed site (Table S4). Tree height had more explanatory power than tree genus (marginal R2 of 0.39 vs 0.19). Willow Warbler and Melodious Warbler both preferred Acacia and Daniellia trees over those in the “other” group, whereas Pterocarpus, Vitellaria and Lophira were preferred less than the “other” trees (Figure 4). Some of this preference was, however, explained by tree height; tall tree genera such as Daniellia were less preferred, and short trees, such as those belonging to the “other” group, were more preferred when including height in the model (Table S5). Pied Flycatcher had a higher preference for the “other” tree group (z = 3.8, P = 0.002, Table S5), and utilized a more diverse group of tree genera (Shannon-Wiener index: 2.5) compared to Willow Warbler and Melodious Warbler (WW: 2.0; MW: 2.0; Figure 4).
Density
In the undisturbed site, Pied Flycatcher was recorded in significantly higher densities (0.82 ± 1.25 [mean ± SD] birds/ha) than both Willow Warbler (0.34 ± 1.42 birds/ha; z = -3.93,486, P = 0.001) and Melodious Warbler (0.12 ± 0.53 birds/ha; z = -5.63,486, P < 0.001), and Willow Warblers were significantly more numerous than Melodious Warblers (z = 2.83,486; P = 0.005). In the disturbed site, Willow Warbler (0.91 ± 2.5 birds/ha) was recorded in significantly higher densities than both Pied Flycatcher (0.62 ± 1.19 birds/ha; z = 2.13,474, P = 0.038) and Melodious Warbler (0.15 ± 0.58 birds/ha; z = 5.83,474, P < 0.001), and Pied Flycatcher was significantly more numerous than Melodious Warbler (z = 4.43,474, P < 0.001). Between sites, only Willow Warbler densities differed significantly, being higher at the disturbed site than in the undisturbed (z = 4.42,320, P < 0.001). Pied Flycatcher was more numerous at the undisturbed site, although the difference was not significant (z = 1.52,320, P = 0.125).
Discussion
The observed abundances varied among habitats and species, confirming species-specific effects of anthropogenic habitat changes for long-distance migratory songbirds during the non-breeding period. We document clear differences in spatial and social behaviour among the species and sites. The birds preferred tall trees at both sites and showed a preference for acacia trees. Overall, home ranges were larger in the disturbed site compared to the undisturbed site, partly related to a lower density of tall trees.
Willow Warblers had substantially larger home ranges than Melodious Warbler and Pied Flycatcher. Studies of new world songbird migrants estimated winter home ranges of < 2 ha in territorial individuals, and up to 15 ha in floaters (Brown et al. Reference Brown, Stouffer and Strong2000, Brown and Long Reference Brown and Long2007). The Willow Warblers’ home ranges averaged 12 ha, similar to that shown by non-breeding Wood Warblers Phylloscopus sibilatrix in dry woodland habitat (Mallord et al. Reference Mallord, Orsman, Roberts, Skeen, Sheehan and Vickery2016). They showed no evidence of territorial behaviour and frequently shared a tree with conspecifics; this suggests that Willow Warblers were not defending territories, but rather flocking as also reported in non-breeding Willow Warblers in Zambia (Sorensen Reference Sorensen2014). We consider Pied Flycatcher and Melodious Warbler territorial, because they rarely shared a tree with conspecifics and when they did, aggressive behaviour was always observed. Their home range sizes are similar to those of territorial individuals of wintering New World thrushes (Brown et al. Reference Brown, Stouffer and Strong2000, Brown and Long Reference Brown and Long2007), although a few of the tracked individuals moved substantially longer distances. The home ranges found for Pied Flycatcher were comparable in size to those found for Pied Flycatchers in Comoé National Park, Ivory Coast (Stünzner-Karbe Reference Stünzner-Karbe1996).
The generally larger home ranges in farmland indicate a reduction in habitat quality resulting from anthropogenic disturbance. Nevertheless, Willow Warblers were found in higher densities in the disturbed site, suggesting that either the habitat is better for Willow Warblers in the disturbed site or that less territorial, lower ranking individuals congregate in that habitat. Several other studies have compared population densities between forest and farmland. Some studies find species specific differences in the effect of deforestation (Cresswell et al. Reference Cresswell, Wilson, Vickery, Jones and Holt2007, Stevens et al. Reference Stevens, Sheehan, Wilson, Buchanan and Cresswell2010). Wilson and Cresswell (Reference Wilson and Cresswell2006) found only weak negative trends with tree density, and suggest that migrants are more robust than residents to habitat degradation. This illustrates that different species respond differently to man-made habitat alterations, and densities are not always negatively affected. Estimates of densities are always uncertain, but the differences we find between sites and species are likely reflecting true differences. It is worth noting that the agricultural site in our study still held some big trees and many hedgerows, similar to the farmland described in Jones et al. (Reference Jones, Vickery, Holt and Cresswell1996), who also found that the presence of some trees in the farmland was important for the Palearctic migrants. The birds had a strong preference for the taller trees, and if all tall trees are removed, the habitat is not suitable for any of the three species in this study. This is likely different for open-land species (Cresswell et al. Reference Cresswell, Wilson, Vickery, Jones and Holt2007, Hulme and Cresswell Reference Hulme and Cresswell2012). Also, the extensive farmland in this study had a high proportion of Acacia trees, which were highly preferred by Willow Warblers, suggesting that these are also important for habitat quality in the more open land. We did not find better support for using tree cover as a predictor over site, and potentially density of specific tree species such as Acacia and Daniellia would be a more suitable predictor than general tree cover.
Willow Warbler and Melodious Warbler had largely similar preferences for Acacia and Daniellia trees. For the latter, the preference was to some extent explained by tree height. Zwarts et al. (Reference Zwarts, Bijlsma, van der Kamp, Sikkema and Wymenga2015) also found a strong preference for Acacia and other thorny species and explained this preference by a higher insect availability in trees investing in mechanical rather than chemical defence. Pied Flycatcher used an overall higher diversity of trees. This lower degree of specialisation is probably related to the different foraging techniques: Pied Flycatchers mostly catch insects in the air and on the ground (Cramp Reference Cramp1988), and may therefore be less dependent on invertebrate abundance within particular tree species compared to the two gleaning species. Availability of Acacia was 30 times higher in the disturbed site, which presumably improved suitability for Willow Warbler and Melodious Warbler, despite there being fewer tall trees in general at this site.
Bird densities are not always a good indicator of habitat quality (Horne Reference Horne1983, Johnson Reference Johnson2007), partly because weak competitors are often more abundant in the poorer habitat, as they are outcompeted in the best habitats. This pattern is likely more pronounced in disturbed habitats (Bock and Jones Reference Bock and Jones2004). The fact that Willow Warblers were more often alone and physically larger (Figure S2) in the undisturbed site could suggest that there is some difference between the individuals at each site. The Willow Warblers were not territorial in either site, so intraspecific competition is unlikely to drive this pattern. However, there may potentially be more aggression from territorial local species, leading to fewer, but more competitive individuals (larger size could indicate males or older birds) in the undisturbed site.
In conclusion, conversion of forest to extensive farmland, with an associated 57% decrease in density of tall trees, made the home range sizes 1.5–4 times larger (kernel density) in the three species. This led to a 24% lower density of Pied Flycatchers but a 168% increase in density of Willow Warblers. This discrepancy is possibly caused by differences in tree species preference mixed with a low degree of territoriality in Willow Warblers. The presence of tall trees was important for all species and only extensive farming practices that leave a number of tall trees can be reconciled with migratory forest bird conservation. Presumably though, presence of the right trees such as Acacia and to some degree Daniellia are more important than many trees. As deforestation is widespread throughout the African wintering grounds, our results predict likely population level declines for migrants wintering in the dry woodlands and savanna habitats, but also that the farming practices retaining certain trees likely allow farming and migrant conservation to be concurrent at least for some species. Our results illustrate the complexity of predicting effects of human-caused habitat alterations and highlight the need for improved knowledge regarding habitat preferences and basic ecology of individual species from their non-breeding ranges.
Supplementary Material
To view supplementary material for this article, please visit https://doi.org/10.1017/S0959270917000132
Acknowledgements
We thank J. Amposah for assistance with tree identification; Birdlife Denmark, Ghana Wildlife Society, and volunteer ringers, as well as R. Jacobsen, L. Pedersen, M. R. Schneider, A. R. Jensen and L. Backhaus for assisting with field work. APT acknowledges Aage V. Jensen Naturfond. MW, MLJ, AHR, APT and KT acknowledge the Danish National Research Foundation for funding the Center for Macroecology, Evolution and Climate (grant number: DNRF96). KT thanks The Danish Council for Independent Research for support to the MATCH project (1323-00048B).


