


Individuals with congenital deafness are often at risk for developmental language delays that can have lifelong consequences for learning and educational achievement. Severe hearing loss can impede the normative development of spoken language acquisition, and delays in exposure to an accessible language, such as American Sign Language (ASL), may result in atypical linguistic competencies, including difficulties with reading. According to the National Center for Educational Statistics (2005), the national average high school reading level for all teenagers was between “basic” and “proficient” at the 12th-grade level where “proficient” is equated with an 8th-grade reading level. In contrast, the mean reading level of deaf high school seniors is the 4th grade (Holt, Reference Holt1993; Traxler, Reference Traxler2000). This long-standing discrepancy of reading achievement between hearing and deaf students has been attributed to a host of causal factors (see Andrews & Wang, Reference Andrews and Wang2015, and Lederberg et al., Reference Lederberg, Schick and Spencer2013 for overviews). Given the phenotypic variability evidenced in individuals with congenital deafness, it is unlikely that a unitary factor is the cause of observed difficulties. We contend that a more accurate accounting of reading abilities in deaf people with severe to profound congenital hearing loss (hereafter “deaf readers”) will require not only broadening our consideration of the multiple individual variables that might be relevant for a deaf reader, but also to broaden our understanding of what it means to read successfully.
To date, most research comparing hearing and deaf readers hold a rather narrow view of the normally-hearing reader. Reading characteristics of English speakers, who for the most part have uniform educational and linguistic experiences, typically serve as the target profile and sole point of comparison for studies of deaf readers. However, there are many individuals who become successful readers of English but begin the process with very different linguistic and educational experiences. Investigation of the ways in which second-language English readers acquire proficiency in reading English provides a rich opportunity to further our understanding of reading competency (see, e.g., Melby-Lervag & Lervag, Reference Melby-Lervåg and Lervåg2014). We should not assume that all successful readers actually read in a similar fashion to English-speaking monolingual (ML) hearing readers. As we demonstrate in this paper, we believe there is benefit from taking a broader view of what constitutes “reading ability” across typologically diverse populations when considering English reading abilities in deaf readers.
Proficient reading in typically hearing individuals is built upon multiple linguistic skills and processes, including vocabulary development, phonologic sensitivity, and alphabetic skills (National Institute of Child Health and Human Development, 2000; Snow et al., Reference Snow, Burns and Griffin1998). Cognitive executive functions such as working memory (WM) further contribute to reading success (Peng et al., Reference Peng, Barnes, Wang, Wang, Li, Swanson and Tao2018), as does generalized knowledge of the world that allows readers to relate to the ideas in text to understand what they are reading (Pressley, Reference Pressley2002; Luckner & Handley, Reference Luckner and Handley2008). As reading is a skill typically acquired in childhood with explicit instruction, there is agreement that the precedence and weighting of the multiple component skills is dynamic and changes as a child transitions from a beginning reader to a fluent one (Seidenberg, Reference Seidenberg2017; Castles et al., Reference Castles, Rastle and Nation2018).
The Simple View of Reading (Gough & Tunmer, Reference Gough and Tunmer1986; Hoover & Gough, Reference Hoover and Gough1990) posits that reading comprehension is the product of two sets of skills, “decoding” and “linguistic comprehension”. More comprehensive treatments of reading have sought to understand the causal impact of the multiple linguistic and cognitive skills required for reading and reading comprehension (Castles et al., Reference Castles, Rastle and Nation2018), and have begun to clarify the direct and indirect impact of these skills on reading comprehension (Kim, Reference Kim2017). However, it is important to note that these theoretical models assume readers with typical hearing and speech perception, and they assume the reader comes to the task with English as their native language. That is, children learn to read an orthography that codes a language they already know.
The applicability of the component processes entailed in these models of typical reading to deaf and hard-of-hearing populations remains an active area of debate. For example, Fariña et al. (Reference Fariña, Duñabeitia and Carreiras2017) provide evidence that skilled deaf readers of Spanish do not rely on phonological mediation while maintaining the same level of orthographic sensitivity as hearing readers, despite the orthographic transparency afforded by written Spanish. Moreover, the utility of these traditional models is further complicated by the fact that deaf readers may exhibit adaptive effects of auditory deprivation that result in abilities that are not evidenced in hearing readers (Corina & Lawyer, Reference Corina, Lawyer, Rueschemeyer and Gareth Gaskell2018). For example, using eye tracking, Bélanger and colleagues have reported differences in gaze strategies and the utility of parafoveal vision in online studies comparing deaf and hearing readers (Bélanger et al., Reference Bélanger, Slattery, Mayberry and Rayner2012; Bélanger et al., Reference Bélanger, Mayberry and Rayner2013; Bélanger & Rayner, Reference Bélanger and Rayner2015; see also Piñar et al., Reference Piñar, Carlson, Morford and Dussias2017). These capacities are not reflected in traditional models of reading. Footnote 1
There is an extensive literature that explores reading and literacy development in deaf children. One prominent line of explanation suggests that deaf childrens’ lack of spoken language phonological awareness restricts reading achievement (Geers, Reference Geers2003; Johnson & Goswami, Reference Johnson and Goswami2010; Perfetti & Sandak, Reference Perfetti and Sandak2000; Spencer & Oleson, Reference Spencer and Oleson2008; Venezky, Reference Venezky1970), while others point to much a wider range of factors including conceptual deficits, undeveloped vocabulary, and faulty educational practices (Chamberlain, Reference Chamberlain2002; Griswold & Commings, Reference Griswold and Commings1974; Harris & Beech, Reference Harris and Beech1995; Izzo, Reference Izzo2002; Marschark, Reference Marschark, Marschark and Clark1993; Mayberry et al., Reference Mayberry, Del Giudice and Lieberman2011; Miller, Reference Miller1997; Padden & Ramsey, Reference Padden, Ramsey and Mayberry2000). Andrews and Wang (Reference Andrews and Wang2015) offer an evaluative review and ascertain the degree to which properties of reading development in this population mirror or are qualitatively different from problems of typically hearing readers. As noted, given the variability in the biological and sociological experience of deaf children, it is likely that multiple factors conspire to inhibit reading achievement.
Reading in deaf ASL–English bilinguals
Many deaf individuals will ultimately develop competencies in both a signed language and accessible forms of other language(s) during the course of their education. The recognition of deaf signers as bilinguals has led to new characterizations of language processing in signers, particularly in expanding our understanding of how deaf individuals process written forms of spoken language (see Corina & Lawyer, Reference Corina, Lawyer, Rueschemeyer and Gareth Gaskell2018). The expression of bilingualism in deaf individuals is a complex situation that does not map neatly onto common characterizations of spoken language bilingualism (see Corina, Reference Corina, Marschark and Spencer2015 for a discussion). While it is uncontroversial to consider deaf individuals as having a signed first language (L1) if they were exposed to a signed language from birth, the status of what constitutes a second language (L2) for deaf native signers (NS) is more complicated. Their L2 could take the form of a second signed language, spoken English, or even written English (Hoffmeister & Harris, Reference Hoffmeister and Caldwell-Harris2014).
The case of non-native deaf signers adds further complexity. For some, their L1 may be a signed language, but one that has been acquired relatively late, with exposure ranging from early childhood to adulthood. These late learners may also have varying degrees of English competency based upon inherently reduced access to spoken English, and individual experiences with explicit oral English training. For these individuals, it may be appropriate to consider each language as an L1 (or perhaps L1a, L1b) with the understanding that the timing of language exposure and degree of language accessibility play different roles in the establishment of linguistic competencies for each language (Corina, Reference Corina, Marschark and Spencer2015). As with NS, written English may serve as an L2 (Hoffmeister & Harris, Reference Hoffmeister and Caldwell-Harris2014).
There is growing evidence that when bilingual deaf signers are asked to process English words, the properties of sign language representations are activated. The majority of these findings are reported in the context of semantic decisions of word pairs in English. A common finding across these studies is that there is a response time interference effect for semantically unrelated trials with phonologically related ASL translations when compared to those with a phonologically unrelated ASL translation (see Emmorey et al., Reference Emmorey, Giezen and Gollan2016, and Ormel & Giezen, Reference Ormel, Giezen, Marschark, Tang and Knoors2014 for reviews). These effects may be modulated by English reading ability, language proficiency (Morford et al., Reference Morford, Kroll, Piñar and Wilkinson2014; Morford et al., Reference Morford, Wilkinson, Villwock, Piñar and Kroll2011), and conscious awareness of task constraints (Meade et al., Reference Meade, Midgley, Sehyr, Holcomb and Emmorey2017). These interference effects may be quite general and have been documented for nonalphabetic orthographies as well. An eye tracking study of deaf Chinese readers that probed for evidence of sign-based influences during sentence reading in Chinese observed interference effects (parafoveal costs) for preview words that were phonologically related in Chinese Sign Language (Thierfelder et al., Reference Thierfelder, Wigglesworth and Tang2020).
Comparing deaf readers with hearing bilinguals
In an effort to further understand how bilingualism may impact reading ability, in the present study, we expand our scope of inquiry to include a population of Chinese readers who learned to read English as a second language. Footnote 2 In principle, the inclusion of typically hearing second-language readers of English may allow one to identify the reading processes that are necessary for all readers of English as separate from those processes that may reflect strategic practices that occur as a result of prior language, sensory, or instructional experience.
The college-aged Chinese–English bilinguals (CEB) we include learned either Mandarin or Cantonese as a native language and English as a second language in a formal school setting. They have experience with different orthographic systems. In accordance with educational practices in the People’s Republic of China (PRC), these individuals develop the recognition and writing of approximately 3,000 Chinese characters Footnote 3 by the time students complete the 6 grades of primary school. Chinese students commonly begin to learn English in kindergarten (5–6 years old Footnote 4 ) (Wenting, Reference Wenting2019). Phonic-based approaches to reading English are valued as a way to improve reading ability (see, e.g., Chien & Chen, Reference Chien and Chen2002; Leou & Huang, Reference Leou and Huang2006; Liaw, Reference Liaw2003; Wang Lu, Reference Wang2003; Wang et al., Reference Wang, Park and Lee2006).
Linguistic and cognitive predictors of reading comprehension
Several linguistic and cognitive constructs have been assessed to predict reading performance in hearing, ML adult readers (Long et al., Reference Long, Prat, Johns, Morris and Jonathan2008, Long et al., Reference Long, Johns, Morris, Traxler and Gernsbacher2006). The extent to which these constructs have been used with deaf and bilingual populations varies, and their relative contributions to reading comprehension have not all been examined in the same study with deaf and bilingual populations. These constructs include phonological awareness, vocabulary knowledge, word fluency, reading volume, executive function, and WM. The current study uses these constructs to contrast and predict reading performance in deaf ASL–English bilinguals, hearing CEB, and hearing English-speaking ML.
Linguistic constructs
Phonological awareness
Research shows that reading an alphabetic orthography hones phonological awareness skills by making the phoneme a salient feature in print, such that there is a reciprocal relationship between phonological awareness and learning to read an alphabetic orthography (Perfetti et al., Reference Perfetti, Beck, Bell and Hughes1987; Mann, Reference Mann1986; Stahl & Murray, Reference Stahl and Murray1994). Studies of deaf readers show that they can develop phonological awareness, but its relationship to reading comprehension is a matter of debate (see, e.g., Chamberlain, Reference Chamberlain2002; Izzo, Reference Izzo2002; Miller, Reference Miller1997, contrasted with Geers, Reference Geers2003; Johnson & Goswami, Reference Johnson and Goswami2010; Spencer & Oleson, Reference Spencer and Oleson2008). Xu (Reference Xu2002) explored the development of Chinese and English phonological awareness for Chinese Mandarin-speaking children and found that there was a strong correlation between children’s development of Chinese and their English phonological awareness. However, other studies have suggested limitations of cross-language phonological awareness. For example, some studies of reading development in CEBs show that, while phonological awareness in Chinese predicts skill in reading Chinese and English, phonological awareness of English does not predict their skill in reading English (Gottardo et al., Reference Gottardo, Yan, Siegel and Wade-Woolley2001; Li et al., Reference Li, Cheng and Kirby2012; McBride-Chang & Suk-Han Ho, Reference McBride-Chang and Suk-Han Ho2005). In addition, it is worth noting that more universal aspects of acquiring orthographic systems may yield cross-script learning transfer (Wang et al., Reference Wang, Park and Lee2006; Perfetti et al., Reference Perfetti, Cao and Booth2013).
Vocabulary knowledge
Vocabulary knowledge in English has been shown to be a significant predictor of English reading comprehension for first and second-language learners of English (Choi, Reference Choi2013; Espin & Foegen, Reference Espin and Foegen1996; Yovanoff et al., Reference Yovanoff, Duesbery, Alonzo and Tindal2005; Melby-Lervag & Lervag (Reference Melby-Lervåg and Lervåg2014), and a source of difficulty in reading for many deaf people (Garrison et al., Reference Garrison, Long and Dowaliby1997).
Word fluency
Word fluency is a composite skill that engages lexical and executive function, but is included under language measures in this study. The reported role of word fluency measures in predicting reading comprehension is mixed, with some studies showing predictive effects (Silverman et al., Reference Silverman, Speece, Harring and Ritchey2013) while others do not (Adlof et al., Reference Adlof, Catts and Little2006). The contribution of fluency measures in studies of deaf reader’s comprehension is limited (but see Easterbrooks & Lederberg, Reference Easterbrooks and Lederberg2021 for a developmental perspective).
Reading volume
The amount of time spent reading (aka reading volume) naturally reinforces one’s proficiency in reading, and can be measured with author recognition tasks (Stanovich & West, Reference Stanovich and West1989). Author recognition tasks have also been shown to predict differences in reading comprehension in deaf people (Marschark et al., Reference Marschark, Sarchet, Convertino, Borgna, Morrison and Remelt2012) and in bilinguals with English as a foreign language (Kim & Krashen, Reference Kim and Krashen1998).
Cognitive constructs
Executive function
Executive function is an umbrella term that covers a wide range of higher-order cognitive processes related to an individual’s ability to experience, adapt to, and function in their environment (Hughes, Reference Hughes2011). There is evidence that attentional and some executive processes may be altered in the deaf population, though the cause of these alterations is a matter of debate. Two primary causes have been cited in literature – the auditory deprivation caused by congenital deafness (Kral et al., Reference Kral, Kronenberger, Pisoni and O’Donoghue2016; Kronenberger & Pisoni, Reference Kronenberger, Pisoni, Knoors and Marschark2018), and the language deprivation caused by the lack of an accessible language in many deaf children’s environments (Hall et al., Reference Hall, Eigsti, Bortfeld and Lillo-Martin2018; Hauser et al., Reference Hauser, Lukomski, Hillman, Marschark and Hauser2008). The inclusion of measures of executive function with populations of native and non-native deaf adult signers is a means to help disentangle effects of deafness from language experience.
One component of executive function that has been shown to correlate with the complex task of reading is inhibition control. Inhibition control is the ability to suppress information competing for an individual’s attention (Posner, Reference Posner1980). One function of inhibition control in reading includes the ability to suppress incorrect meanings of ambiguous words and homophones (Gernsbacher, Reference Gernsbacher1990; Gernsbacher & Faust, Reference Gernsbacher and Faust1991; Hasher et al., Reference Hasher, Zacks, May, Gopher and Koriat1999). Inhibitory control in CEB has been studied (Yang et al., Reference Yang, Ye, Wang, Zhou and Wu2018), and differences in inhibitory control in deaf people have been explored in several studies (Hall et al., Reference Hall, Eigsti, Bortfeld and Lillo-Martin2017; Hall et al., Reference Hall, Eigsti, Bortfeld and Lillo-Martin2018; Blank et al., Reference Blank, Frush Holt, Pisoni and Kronenberger2020); however, the contribution of attentional inhibition in the context of reading in this population is understudied.
Working memory
Working memory has both processing and storage functions (Daneman & Carpenter, Reference Daneman and Carpenter1980; Just & Carpenter, Reference Just and Carpenter1992). Sentential reading taxes these functions with lexical retrieval, theme tracking, context-building, proposition storing, and sentence modeling (Just & Carpenter, Reference Just and Carpenter1992). It has been argued that the overall efficiency of WM may affect reading comprehension because readers with more efficient processing will effectively have more capacity for storage (Daneman & Carpenter, Reference Daneman and Carpenter1980; Just & Carpenter, Reference Just and Carpenter1992; Engle et al., Reference Engle, Tuholski, Laughlin and Conway1999). In a recent meta-analysis, Peng et al. (Reference Peng, Barnes, Wang, Wang, Li, Swanson and Tao2018) provide an evaluation of the role of domain-general WM and verbal WM in reading. Their findings indicate that, in typically hearing readers, domain-general central executive of WM is implicated in early reading acquisition, and verbal WM is more strongly implicated in later reading performance as readers gain more experience with reading. Complex WM span tasks have been used to study deaf readers and have been shown to predict reading comprehension skills in deaf readers (MacSweeney et al., Reference MacSweeney, Campbell and Donlan1996; Pisoni & Geers, Reference Pisoni and Geers2000; Garrison et al., Reference Garrison, Long and Dowaliby1997; Marschark et al., Reference Marschark, Sarchet and Trani2016), and in Cantonese–English bilingual children (Tse & Altarriba, Reference Tse and Altarriba2014).
Aims of the current study
The current study evaluates the contribution of a broad range of language and cognitive measures in predicting reading comprehension in adult deaf and hearing readers, and assesses whether these predictive measures differ as a function of bilingual language experience. This research approach encourages us to consider English “reading ability” more broadly and permits new insights into the reading competencies of deaf readers.
To achieve these goals, we collected data from four groups: deaf NS, deaf non-native signers (NNS), hearing CEB who learned English in the PRC (CEB), and English ML. Reading comprehension is the dependent variable and the linguistic, cognitive, and trait measures described below are the independent variables.
The inclusion of four distinct groups of participants permits us to make further inferences. We posit that specific patterns of performance across these groups could highlight how test performance may be impacted by factors of audiological status and language experience. Three broad patterns of interest are shown in Table 1.
Table 1. Group patterns of interest

Test performance in which ML controls and CEB outperform NS and NNS would suggest that audiological status (i.e., hearing vs. deaf) is affecting test performance. Test performance in which ML outperforms CEB, NS, and NNS would indicate that native English experience is affecting test performance. A pattern in which ML, CEB, and NS outperform NNS would suggest that early native language experience affects test performance. These (non-exhaustive) broad patterns of group performance provide preliminary heuristics for the interpretation of results across the wide number of tests used in this study.
As described in detail below, the data analysis uses a three-pronged approach. First, using ANOVA, we evaluate the performance on each of the individual measures across groups. Second, within each group, we identify measures that are strongly correlated with reading comprehension. Third, we use stepwise linear regression for each group to identify aggregate models that predict reading comprehension based upon strongly correlated individual measures.
Methods
Participants
All 332 participants for this study are adults recruited from 5 different colleges. See Table 2 for a summary of the participant characteristics.
Table 2. Participant characteristics

All 216 hearing ML participants have normal hearing and normal or corrected vision. One-hundred and sixty participants identify as female and 56 identify as male. Participants are all between the ages of 17 and 21 with an average age of 18.5.
Twenty-seven hearing CEB who are native speakers of Mandarin or Cantonese and who learned English in the PRC participated in this study. Participants are all between the ages of 18 and 35 with a mean age of 23. Fifteen participants identify as female, 11 identify as male, and 1 declined to state their gender. Participant age of acquisition of English is self-reported. One participant learned English before the age of 5, 25 learned English after the age of 5, and 1 participant declined to state their age of acquisition of English.
Thirty-two deaf NS participated in this study. Participants are all between the ages of 18 and 35 with a mean age of 22. Eleven participants identify as male, 20 identify as female, and 1 declined to state their gender. Participant age of acquisition of ASL, hearing loss, and age of the onset of deafness are self-reported. All NS participants report learning ASL prior to the age of 5, and all learned ASL from their parents. All became deaf before the age of 3. One has mild hearing loss in the better ear (26–40 dB), 1 has moderate hearing loss in the better ear (41–55 dB), 2 have moderately severe hearing loss in the better ear (56–70 dB), 11 have severe hearing loss in the better ear (71–90 dB), 12 have profound hearing loss in the better ear (91+ dB), and 3 did not report their hearing loss.
Fifty-seven deaf NNS participated in this study. Participants are all between the ages of 19 and 43 with a mean age of 24. Eighteen participants identify as male and 39 identify as female. Participant age of acquisition of ASL, hearing loss, and age of the onset of deafness are self-reported. Twenty-four participants learned ASL before the age of 8 and 33 learned ASL after the age of 8. Two declined to report their age of acquisition of ASL. None of the NNS learned ASL from their parents. All of those who learned ASL before the age of 8 learned from teachers. All but two became deaf before the age of 3. Two have mild hearing loss in the better ear (26–40 dB), 1 has moderate hearing loss in the better ear (41–55 dB), 6 have moderately severe hearing loss in the better ear (56–70 dB), 18 have severe hearing loss in the better ear (71–90 dB), 20 have profound hearing loss in the better ear (91+ dB), and 10 did not report their hearing loss.
The background surveys used to collect self-reported data from the CEB, NS, and NNS groups are included in Appendix A.
Independent measures
The specific tests in this study and their dependent measures are listed in Table 3. The linguistic measures in this study include phonological and orthographic decision tests to examine participants’ use of phonological and lexical mediation in reading (Bell & Perfetti, Reference Bell and Perfetti1994), the Nelson–Denny test to examine English vocabulary knowledge, a composite measure of word fluency based upon tests from the Educational Testing Service (ETS) (Ekstrom et al., Reference Ekstrom, Dermen and Harman1976), and author and magazine recognition tests to examine reading volume (Stanovich & West, Reference Stanovich and West1989).
Table 3. Individual test measures

1 The ML dataset uses the Reading Habits Questionnaire (Scales & Rhee, Reference Scales and Rhee2001).
2 The ML dataset uses Raven’s Matrices (Raven, Reference Raven1962).
The cognitive measures in this study include a computerized go/no-go paradigm to examine inhibitory control (https://www.sacklerinstitute.org/cornell/assays_and_tools/), an alphabet span task (Craik Reference Craik and Craik1986), and a reading span task (Just & Carpenter, Reference Just and Carpenter1980; Unsworth et al., Reference Unsworth, Heitz, Schrock and Engle2005) to examine WM.
We include a standardized measure from the Kaufman Brief Intelligence Test (KBIT) (Kaufman & Kaufman, Reference Kaufman and Kaufman1990) for our bilingual groups (i.e., CEB, NS, and NNS).
While the same constructs are measured for all four groups, some of the specific tests in the ML dataset differ from the tests in the CEB, NS, and NNS data collection, as the data for ML controls is provided by the UC Davis Reading Study Footnote 5 courtesy of Dr. Debra Long (see Table 3 notes, see also Freed et al., Reference Freed, Hamilton and Long2017).
Dependent measure of reading comprehension
The dependent measure in this study is reading comprehension. Participants read up to five natural, professionally written, and edited narrative and expository texts. The five texts are: “The Secret Life of Walter Mitty” by James Thurber, “I am Bigfoot” by Ron Carlson, “Cellphone or Pheromone? New Props for the Mating Game” by Natalie Angier, “The Oval Portrait” by Edgar Allen Poe, and “How a Coffee Shortage Killed the Confederacy” by David A. Norris. Texts were presented using EPrime software running on a laptop PC in a moving window paradigm, wherein participants read each story one word at a time by pressing the space bar. With each bar press, the current word disappeared and the next word appeared. This method of reading allows for future analysis of syntactic and semantic parsing in these populations. Following each story, participants answered a series of questions indicating how much they recalled of the story and then answered a set of 10 multiple-choice comprehension questions (Freed et al., Reference Freed, Hamilton and Long2017). The correct answers were totaled and the scores for each participant were averaged to get one reading comprehension score. That score is the dependent measure in this study. Due to variation in how long participants spent on the self-paced measures, not all participants read all five texts, which is why we use an average reading comprehension score. Footnote 6
Testing procedures
Participants attended two 2.5-hour sessions no more than 1 week apart. Following informed consent and the completion of the background survey, participants took the tests as described above. Testing sessions had as many as four participants at a time, and began with the timed measures and ended with the self-paced measures. Experimenters explained task instructions in English or ASL as appropriate to each participant’s communication needs. If more than one language modality was needed at a time, instructions were issued in each modality in turn. During the self-paced portion of the testing, experimenters were able to address each individual in whichever language modality was required. At least one researcher fluent in ASL was present for the duration of testing with deaf individuals.
Analysis and results
We calculated means for each variable per group. For each variable within each group, scores below three standard deviations from the mean were removed and treated as missing at random because such outliers represent impossible score values for the tests involved and/or errors in the way in which participants responded to computerized tasks. Any participants with two or more missing scores were removed from analysis to control for the possibility that they repeatedly misunderstood tasks or were unable to perform them. One participant was removed from the NS group and no participants from the ML, CEB, or NNS groups. Therefore, the final numbers of participants by group are 31 NS, 57 NNS, 27 CEB, and 216 ML. The complete descriptive statistics for these data are in Appendix B.
Group differences on test measures
Due to the disparate group sizes and heterogeneous variance between group scores, Welch’s one-way analysis of variance was calculated to compare groups on those measures for which all groups took the same test. The analysis was significant for all tests except for the orthographic accuracy measure, and the Games–Howell post hoc test revealed differential patterns of scores between groups, summarized in Table 4. The pairwise post hoc tests reported below were evaluated using the conservative Bonferroni correction with a significance threshold of p < .0083.
Table 4. Welch’s ANOVA and Games–Howell on individual test measures

a Asymptotically F distributed.
b Significance evaluated with Bonferroni correction at p < .0083.
For expository purposes, we discuss group differences observed for language measures (reading comprehension, vocabulary, phonological and orthographic awareness, and word fluency), cognitive processing tasks (WM span tests and inhibition), and trait variables (i.e., AoA, dB loss, and IQ).
Language measures
There was a main effect of group on reading comprehension (F(3,62) = 14.681, p < .001) (see Figure 1 and Table 4). Post hoc testing revealed ML (M = 7.88), CEB (M = 7.16), and NS (M = 6.96) were not significantly different (ML vs. CEB, p = .136; ML vs. NS p < .015). ML performed significantly better than NNS (M = 6.41) (ML vs. NNS p < .001) (Table 4). Chinese–English bilinguals, NS, and NNS groups were not statistically significant (all pairwise p > .224).

Figure 1. Average Comprehension Scores by Group.
On the Nelson–Denny vocabulary measure (F(3,67) = .304, p < .001) (Figure 2, Table 4), scores for the ML (M = 49.96), CEB (M = 48.48), and NS (M = 46.16) were statistically comparable (all pairwise p > 0.5). Comparatively, NNS (M = 39.98) scored significantly lower than the ML (p < .001) (Table 4); however, differences between CEB, NS, and NNS groups were not statistically significant (all pairwise p > 0.1).
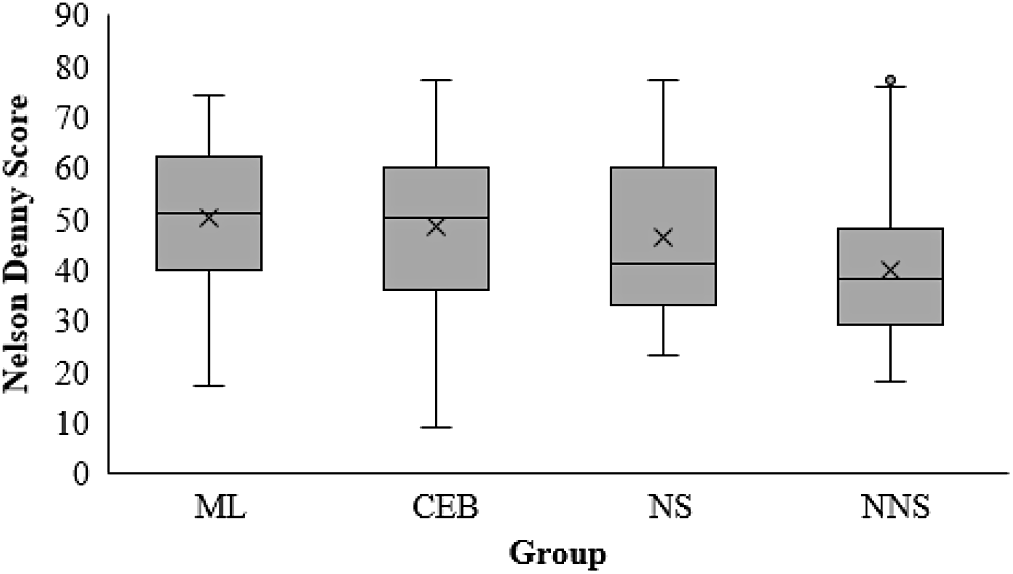
Figure 2. Nelson–Denny Scores by Group.
As with other language measures, for phonological awareness, ML scores (M = 68.80) were the highest (F(3,60) = 85.46, p < .001), followed by the CEB (M = 53.56), NS (M = 51.87), and then NNS (M = .12) (see Figure 3 and Table 4). Pairwise comparisons indicated that MLs scored significantly higher than the three bilingual groups (all pairwise p < .001) (Table 4). However, differences between CEB, NS, and NNS groups were not statistically significant (all pairwise p > .95).

Figure 3. Phonological Accuracy Scores by Group.
On the word fluency measure (F(3,70) = 17.675, p < .001), pairwise comparisons showed that ML scores (M = 27.95) were statistically different from CEB (M = 19.57), NS (M = 24.26), and NNS (M = 22.60) (all pairwise p < .008) (Table 4). However, in a now-familiar pattern, the CEB, NS, and NNS scores did not differ from one another (all pairwise p > 0.03).
Cognitive measures
Performance on the go–no-go task (F(3,66) = 6.167, p < .001) (Table 4) was highly comparable across groups. In pairwise comparisons, only the scores for the ML controls (M = 290.75) were statistically different from NNS (M = 283.48) (p < .001) (Table 4).
On the reading span test (F(3,58) = 20.805, p < .001) (Figure 4 and Table 4), we observed that the CEB group (M = 41.92) scored highest, followed by ML (M = 38.14), NS (M = 29.70), and then NNS groups (M = 23.30). The ML, CEB, and NS scores did not differ significantly from one another (all pairwise p > .01); however, CEB and ML groups performed significantly better than the NNS (all pairwise p < . 001) (Table 4), while the NS and NNS did not differ from one another (p = 0.18).

Figure 4. Reading Span Scores by Group.
On the alphabet span test (F(3,61) = 36.585, p < .001), the ML (M = 73.24) performed the highest, followed by the NS (M = 55.77), CEB (M = 54.78), and then NNS groups (M = 48.59). Monolingual scores were statistically different from NS and NNS (p < .001) (Table 4), but did not differ from the CEB (p > .01). However, scores of the NS, CEB, and NNS did not differ from one another (all pairwise p > .34).
Trait variables
An additional Welch’s one-way analysis of variance was calculated to compare the CEB, NS, and NNS groups on the KBIT, with a Bonferroni correction value of p < .016. The analysis was significant, (F(2,65.5) = 9.386, p < .000. The Games–Howell post hoc test revealed that the CEB group (M = 29.85) is significantly higher than the NNS (M = 26.93) (p < .001), but not the NS (M = 27.74) with the Bonferroni correction (p < .05). An additional Welch’s one-way analysis of variance assessed the degree of self-reported hearing loss in the better ear in native and non-native deaf signers. There was no group difference observed (F(1,55) = .734, p = .395).
Variable correlations with reading comprehension
We took Pearson correlations for each variable with reading comprehension for each group. We sought to retain as many variables that had any strong relationship to reading comprehension as possible for each group without preselected control variables. Variables that had a zero-order correlation (p < .05) with reading comprehension for each group were retained for further analysis, as these were the variables with a significant relationship to reading comprehension without controlling for any other variables. In addition to the test score variables, age of acquisition of English was included for the CEB group, and age of acquisition of ASL and dB loss in the better ear were included for the NS and NNS groups.
The tests with significant zero-order correlations with reading comprehension for each group (Table 5, see Appendix C for complete correlation matrices) were then used in stepwise linear regression to explore models for reading comprehension for each group. Footnote 7 We used conservative statistical measures to assess each model because of our small sample sizes. For each group, the predicted residual sum of squares (PRESS) statistic was used to select the most appropriate model, and then the PRESS statistic was used to calculate a predicted R squared (Garson, Reference Garson2016) to ensure models were not over fit due to the small sample sizes and number of predictor variables. Given the degree of correlation between the predictor variables, the variance inflation factors (VIF) and tolerance statistics were examined for each predictor in the final models for each group to ensure no corrective measures were needed to address multicollinearity, and residual plots for all models were also examined to ensure model adequacy. Variance inflation factors and tolerance statistics are reported with each regression table.
Table 5. Significant correlations with reading comprehension by group

** Correlation is significant at the 0.01 level (two-tailed).
* Correlation is significant at the 0.05 level (two-tailed).
Hearing English monolinguals
The variables with a zero-order correlation with reading comprehension for the ML group included the Nelson–Denny, the measures of phonological and orthographic awareness, the reading span and alphabet span measures, the word fluency measure, the reading habits questionnaire, and the Raven’s matrices.
A stepwise multiple regression was conducted to evaluate which of the variables were necessary to predict reading comprehension. The model summary and regression coefficients are shown in Tables 6 and 7. At step three of the analysis, the Nelson–Denny, the reading span task, and the phonological accuracy measure entered into the regression equation and were significantly related to reading comprehension (F(3,199) = 36.093, p < 001. The PRESS statistic for this model was 158.97, compared to 170.29 and 182.31 of the other models, which indicated that this was the best-fit model. The predicted R squared for the model was .319, which indicated that this model explained 32% of the variance in reading comprehension scores for this group.
Table 6. Model summary for ML

aPredictors: (Constant), NelsonD.
bPredictors: (Constant), NelsonD, Rspan.
cPredictors: (Constant), NelsonD, Rspan, PhonAcc.
Table 7. Regression coefficients for ML

Hearing Chinese–English bilinguals
The variables with a zero-order correlation with reading comprehension for the CEB group included the Nelson–Denny, the measure of orthographic awareness, the alphabet span task, and the measures of word fluency and reading volume.
A stepwise multiple regression was conducted to evaluate which of the variables were necessary to predict reading comprehension. The model summary and regression coefficients are shown in Tables 8 and 9. At step two of the analysis, orthographic accuracy and Nelson–Denny entered into the regression equation and were significantly related to reading comprehension (F(2,23) = 12.514, p < .001. The PRESS statistic for this model was 40.25, compared to 49.14 of the other model, which indicated that this was the best-fit model. The predicted R squared for the model was .399, which indicated that this model explained 40% of the variance in reading comprehension scores for this group.
Table 8. Model summary for CEB

aPredictors: (Constant), OrthAcc.
bPredictors: (Constant), OrthAcc, NelsonD.
cDependent Variable: AvgComp.
Table 9. Regression coefficients for CEB

aDependent Variable: AvgComp.
Native signers
The variables with a zero-order correlation with reading comprehension for the NS group included the Nelson–Denny, measure of phonological awareness, and the measure of reading volume.
A stepwise multiple regression was conducted to evaluate which variables were necessary to predict reading comprehension. The model summary and regression coefficients are shown in Tables 10 and 11. At step one of the analysis, the Nelson–Denny vocabulary measure entered into the regression equation and was significantly related to reading comprehension (F(1,26) = 43.545, p < .001. This was the only independent variable included in the regression analysis. The PRESS statistic for this model was 30.76. The predicted R squared for the model was .528, which indicated that this model explained 53% of the variance in reading comprehension scores for this group.
Table 10. Model summary for NS

aPredictors: (Constant), NelsonD.
bDependent Variable: AvgComp.
Table 11. Regression Coefficients for NS

aDependent Variable: AvgComp
Non-native signers
The variables with a zero-order correlation with reading comprehension for the NNS group included the Nelson–Denny, the measure of phonological awareness, the reading span and alphabet span measures, the word fluency measure, the measure of reading volume, and the KBIT. Footnote 8
A stepwise multiple regression was conducted to evaluate which variables were necessary to predict reading comprehension. The model summary and regression coefficients are shown in Tables 12 and 13. At step three of the analysis, the phonological awareness measure, the alphabet span measure, and the Nelson–Denny entered into the regression equation and were significantly related to reading comprehension (F(3,50) = 24.643, p < .001. The PRESS statistic for this model was 91.09, compared to 91.16 and 119.19 of the other models, which indicated that this was the best-fit model, though not by much. The predicted R squared for the model was 0.48, which indicated that this model explained 48% of the variance in reading comprehension scores for this group.
Table 12. Model summary for NNS

aPredictors: (Constant), PhonAcc.
bPredictors: (Constant), PhonAcc, AlphSpan.
cPredictors: (Constant), PhonAcc, AlphSpan, NelsonD.
dDependent Variable: AvgComp.
Table 13. Regression coefficients for NNS

aDependent Variable: AvgComp.
Discussion
In our regression analysis, we identify different predictors of reading comprehension across our four groups of participants, which is not unexpected given that that the individual measures themselves often differentiate the four groups.
Cognitive and linguistic measures
We observe two major patterns with the measures in our data. First, we observe that ML hearing controls outperform non-native deaf signers across all language and cognitive measures. Second, across many of these measures, we find less differentiation in performance between CEB, NS, and NNS groups, and on specific measures between ML, CEB, and NS groups. Consideration of these patterns provides insight into the contribution of linguistic and auditory factors in test performance.
The finding that ML participants outperform NNS suggests that both normative spoken language acquisition and intact sensory experiences afford advantages across the selected linguistic and cognitive tasks. While it is not surprising that tests of English language ability differ between these groups, it is noteworthy that across all but one language measure (OrthAcc), NNS show poorer performance. This suggests that deafness, in the absence of normative native language experience, may have cascading effects on cognitive abilities such as WM and executive function. This is consistent with evidence that early auditory deprivation and impoverished early language experience may impact downstream, distal, cognitive processes that are not related directly to sensory loss (Kral et al., Reference Kral, Kronenberger, Pisoni and O’Donoghue2016). Further, we note that, at the group level, the NNS also showed differences in nonverbal IQ.
A comparison across the four groups of participants reveals informative sub-patterns that allow us to make preliminary observations regarding how linguistic and auditory factors affect test performance (see Table 1). We report these patterns to provide some initial heuristics to help characterize this large and complex set of results.
We suggest that instances where ML, CEB, and NS outperform NNS may be indicative of cases where early language experience (regardless of language or language modality) affords performance advantages. On both the reading comprehension measure (our main dependent variable of interest) and the Nelson–Denny vocabulary measure, we observed that Bonferroni-corrected pairwise comparisons between ML, CEB, and NS scores were not statistically different. These data reinforce the well-established importance of accessible early language experience in academic achievement and in the acquisition of second languages (Scott & Hoffmeister, Reference Scott and Hoffmeister2017; Mayberry, Reference Mayberry2007). In the present context, early native language experience may provide necessary capacities for rich lexical-semantic associations that may be marshaled for subsequent (not-native) vocabulary learning.
It is of further interest to note that this same pattern (i.e., ML, CEB, NS > NNS) is observed on the cognitive go–no-go test. As discussed, this is an executive function task that requires inhibitory control. There is a large (and controversial) literature suggesting that such processes may be impacted by auditory deprivation (Beer et al., Reference Beer, Kronenberger, Castellanos, Colson, Henning and Pisoni2014; Kronenberger et al., Reference Kronenberger, Beer, Castellanos, Pisoni and Miyamoto2014), or by delayed language acquisition (Dye & Hauser, Reference Dye and Hauser2014; Hall et al., Reference Hall, Eigsti, Bortfeld and Lillo-Martin2018). The present data, which shows that deaf NS tend to pattern with other individuals who have benefitted from early language (e.g., English in ML, Mandarin, or Cantonese in CEB) provides support for the latter interpretation, that delayed language acquisition and not auditory deprivation may be a causal factor in deficits in executive function regulation in congenitally deaf individuals.
On another cognitive measure, reading span, we observe patterns whereby ML and CEB outperform deaf participants (NS and NNS) (i.e., ML, CEB > NS, NNS). We suggest this pattern may highlight measures whereby hearing ability provides a task advantage. Reading span taxes both linguistic and WM functions. Some researchers have suggested that a lack of auditory experience impacts retrieval strategies used in verbal learning and memory (Pisoni & Cleary, Reference Pisoni, Cleary, Zeng, Popper and Fay2004; Conway et al., Reference Conway, Pisoni and Kronenberger2009; Pisoni et al., Reference Pisoni, Kronenberger, Chandramouli and Conway2016). In this view, experience with sound provides a “scaffolding” for human cognition and helps individuals to develop general cognitive abilities related to encoding and processing of temporal or sequential patterns (Conway et al., Reference Conway, Pisoni and Kronenberger2009). However, whether such posited deficits reflect immutable cognitive limitations or merely reveal differences in strategic processes used in the specific verbal–linguistic tasks awaits further study.
Examining across individual measures, we note several tests where ML outperformed CEB, NS, and NNS groups. We observe this pattern for tests of phonological awareness, alphabet span, and word fluency. We interpret this pattern as revealing individual measures which heavily weigh early spoken English language experience. It is interesting to note that two of these measures, alphabet span and word fluency, engage executive control functions (e.g., WM, inhibitory control) in addition to English language skills, and under these combined demands, we observe the potential impact of native English language experience. Under one account, early English experience may ultimately provide readers with more efficient routes for English language understanding, thus freeing additional capacities required under combined tests that tax multiple faculties. We discuss phonological awareness in detail below.
Contribution of language and cognitive measures to reading comprehension
The Nelson–Denny vocabulary test is a significant predictor for all groups. In fact, the NS has no predictors in addition to the Nelson–Denny vocabulary test, which explains 58% of the variance in reading comprehension in that group. This is in line with prior research that shows that high-level vocabulary comprehension is a critical attribute in successful reading, and is a stable predictor across grade levels for hearing English ML (Espin & Deno, Reference Espin and Deno1995; Espin & Foegen, Reference Espin and Foegen1996; Yovanoff et al., Reference Yovanoff, Duesbery, Alonzo and Tindal2005) as well as for second-language learners of English and deaf individuals (Choi, Reference Choi2013; Garrison et al., Reference Garrison, Long and Dowaliby1997; Lervag & Aukrust, Reference Lervåg and Aukrust2010; Sarchet et al., Reference Sarchet, Marschark, Borgna, Convertino, Sapere and Dirmyer2014; Spencer & Marschark, Reference Spencer and Marschark2010). It is interesting to consider whether the acquisition of English vocabulary across the groups of participants proceeds in a uniform fashion. Whereas the two hearing groups could have acquired the vocabulary through either spoken interactions or through reading, the NS, for example, may have acquired the vocabulary on the Nelson–Denny mainly through reading. As noted above, researchers have entertained the possibility that, for deaf signers, English language proficiencies may be attained primarily through exposure to written English (Hoffmeister & Caldwell-Harris, Reference Hoffmeister and Caldwell-Harris2014).
The phonological awareness measure predicts reading comprehension in the ML and NNS groups while the test of orthographic awareness predicts reading comprehension in the CEB group. We offer two interpretations of these findings.
Under one account, the phonological awareness measure used here is tapping into spoken language meta-awareness abilities that have long been associated with learning to read and, in the present study, are reflected in reading comprehension scores. This variable in the regression models for ML and NNS groups reflects a common understanding of the role of speech abilities in reading achievement (Geers, Reference Geers2003; Johnson & Goswami, Reference Johnson and Goswami2010; Perfetti & Sandak, Reference Perfetti and Sandak2000; Spencer & Oleson, Reference Spencer and Oleson2008; Venezky, Reference Venezky1970).
The lack of phonological awareness as a significant predictor in the regression model of the CEB group is consistent with previous research that has reported that phonological awareness in English does not predict English reading skills in Mandarin native speakers (Gottardo et al., Reference Gottardo, Yan, Siegel and Wade-Woolley2001; Li et al., Reference Li, Cheng and Kirby2012; McBride-Chang & Suk-Han Ho, Reference McBride-Chang and Suk-Han Ho2005; but see also Xu, Reference Xu2002). Indeed, the importance of the orthographic awareness test as a factor in predicting reading comprehension in the CEB group may be an indication of a greater reliance on visually-based word-level lexical processing over phonological strategies.
That the CEB group does not demonstrate a strong relationship between performance on the phonological awareness test and reading comprehension is an important finding. This suggests that these native Mandarin speakers, in spite of having poor English-based phonological recoding, nevertheless achieved adequate reading comprehension that was not statistically different from the ML group. While many studies have linked limitations of deaf readers’ reading ability to a lack of spoken phonological awareness, the present data, with its inclusion of a hearing English–L2 bilingual group, calls into question the strong causal inferences often elicited by this pattern of performance. The lack of phonological awareness as a predictor of reading comprehension for the NS group further questions this inference.
The data also suggest a more nuanced interpretation. Reading researchers have long acknowledged the reciprocal causal relationship between phonological awareness and reading, where by a certain level of phonological awareness is necessary for understanding the rudiments of the alphabetic principle, but as the learning of phoneme–grapheme correspondences progress, this knowledge, in turn, promotes the development and refinement of phonological awareness (Perfetti et al., Reference Perfetti, Beck, Bell and Hughes1987; Stanovich, Reference Stanovich1986; Tunmer & Rohl, Reference Tunmer, Rohl, Sawyer and Fox1991). Castles et al. (Reference Castles, Holmes, Neath and Kinoshita2003) have explored the relationships between orthographic knowledge and performance on phonological awareness tasks, such as phoneme deletion. They provided evidence that in English-speaking adults, solutions to phonological awareness tests may be aided by orthographic components of the tests whereby orthographic information is activated in an automatic and involuntary manner. In this sense, phonological awareness performance, in part, reflects the impact of mediating variables such as facility with orthographic processing. This interpretation finds support when one considers the strong positive correlations between the phonological and orthographic tests observed for both the ML and the CEB groups (ML: R 2 = .320 p < .001; CEB: R 2 = .516** p < .007), and the lack of this relationship for deaf participants (NS: R 2 = 0.124, p > .50; NNS: R 2 = 0.222 p > 0.1). This suggests that the implicit activation of orthographic information on sound-based phonological awareness tasks is less available for deaf readers. It also suggests that prior orthographic experience may influence the relative weightings of orthographic versus phonological awareness on reading comprehension. In the case of the CEB group, whose first learned script is not alphabetic, orthographic accuracy predicts reading comprehension. For the ML group, whose first learned script is alphabetic, phonological accuracy predicts reading comprehension. Furthermore, the presence of phonological accuracy as a significant predictor of reading comprehension for the NNS group, but not for the NS group, suggests that native ASL experience may influence the relative importance of phonological awareness skills in reading even though deaf native ASL signers do not have prior orthographic experience with a different script. Taken together, this pattern of results highlights the importance of the inclusion of typologically diverse English readers in assessing the contribution of component processes in successful reading. The present data suggest that English phonological awareness may be less deterministic for the development of skilled English reading than has been previously assumed.
Both the ML and NNS groups have complex WM span tasks as significant predictors of reading comprehension (reading and alphabet span respectively). Both the alphabet and reading span tasks require explicit English knowledge to perform the task. The tasks differ in that alphabet span requires participants to memorize lists of words and subsequently recall them in alphabetic order. In contrast, the reading span task requires participants to read sentences and determine whether they make sense or not. Thus, the reading span measure includes processes that are closely related to sentential text comprehension.
Prior research has observed the effects of verbal WM on adult ML and bilingual readers of English (Peng et al., Reference Peng, Barnes, Wang, Wang, Li, Swanson and Tao2018). However, our data reveals a different pattern. It is particularly interesting to note that, in contrast to the NNS group, no WM span tasks predicted reading comprehension scores of the NS group. These data further suggest that NS are approaching reading comprehension in a different manner than the non-native deaf signers. While the NNS regression models appear more similar to the hearing ML, the native bilingual groups (CEB and NS) indicate that alternative strategies may be employed to reach similar reading comprehension outcomes. The inclusion of these multiple groups of participants in this study highlights these differential strategies and motivates the need to consider multiple models of reading in assessing the performance of English language reading competencies.
Effects of deafness on reading comprehension
In the present study, we observed that self-reported dB loss in the better ear did not predict reading comprehension for either of the deaf groups. This lack of relationship between hearing loss and higher-level reading comprehension, sentence comprehension, and reading achievement in young deaf adults has been previously reported (Jackson et al., Reference Jackson, Paul and Smith1997; Miller, Reference Miller2005).
Limitations
As noted, in our post hoc pairwise comparisons, we chose a conservative threshold of p < .0083 to assess significance across groups. This conservative threshold masks more subtle sub-patterns and trends that are evident in these data. For example, we observe many cases where ML are significantly different from NNS (as assessed by our statistical threshold), and based on this same criterion, observe a lack of difference between ML, CEB, and NS. We interpret this pattern as being consistent with a profile where by ML, CEB, NS > NNS (see Table 1); however, we acknowledge that, strictly speaking, the CEB and NS seldom differed from the NNS at this same p < .0083 threshold. In addition, we note that scores on the nonverbal KBIT were significantly different for NNS from CEB and NS groups. For the sake of transparency, we provide a complete accounting of the descriptive results from each of these measures (Appendix B) and tables reporting the complete pairwise comparisons (Appendix D). This provides the reader with an opportunity to further scrutinize the specific details of these test results and to draw additional inferences.
Second, the reporting of these separate individual measures fails to take into account (nor do we wish to imply) that these are neither pure nor orthogonal assessments of specific linguistic and cognitive skills. Our accounting does not assess the correlations between these measures as they relate to our dependent measure. To address these concerns, we conducted a correlational analysis across these measures followed by stepwise linear regression to further identify significant linguistic, cognitive, and demographic factors that predict reading comprehension across these groups. Footnote 9
Third, a limitation of the current approach is that we are not able to directly evaluate differences between groups in terms of the size of the effects of the predictor variables on comprehension outcomes. That is, our modeling approach does not let us assert that the effects of a given predictor variable are larger or smaller in one group than in others. Footnote 10 A focus for further research should be to include larger numbers of native and non-native deaf readers, which would facilitate matching the predictor characteristics, demographics, and other key variables across groups. Evaluating nested models is one technique that allows inferences about differences across groups in terms of predictor-outcome relationships; however, such models require larger sample sizes than are available here. Nonetheless, the current results suggest some intriguing possibilities that warrant further investigation.
Conclusions
This study of adult deaf readers calls attention to the need to assess multiple factors that may underlie reading comprehension in this population, and demonstrates the utility of taking a broader view of reading comprehension in studies of deaf readers which includes examining the performance of hearing English–L2 bilingual readers. This study highlights three factors that inform our understanding of skilled reading in English by deaf individuals.
First, the data highlight the importance of English vocabulary for reading comprehension. We observe that the Nelson–Denny vocabulary test was a significant predictor for all fours groups of participants. This finding suggests that deaf signing children may benefit from targeted English vocabulary instruction, as this knowledge broadly promotes reading comprehension across individuals with varied linguistic and sensory backgrounds.
Second, our data provide a more nuanced view of the role of phonological awareness in reading comprehension. The measure of phonological awareness was a predictive factor of reading comprehension for ML and NNS groups, but did not emerge as a predictor for the NS or CEB groups. This important finding reaffirms the contention that there may be multiple routes to skilled reading, including routes that, for adult readers, down weigh the reliance on phonological factors. However, our data suggest that possible alternative routes (e.g., enhanced reliance on visual orthographic properties as in the case of CEB) may be limited to cases where English–L2 bilingual readers have a native L1.
Third, our data indicate selective effects of cognitive factors in predicting reading comprehension in deaf signers. We observe that WM measures predict reading comprehension in ML and NNS groups. At the same time, across all four groups, we do not find evidence that executive inhibitory control tasks are predictive of reading comprehension abilities. Collectively, these patterns of results are important contributors to the controversy over causal mechanisms of observed executive function and WM difficulties in deaf readers. Our findings provide support for the argument that delayed language acquisition and not auditory deprivation may be a causal factor in deficits in executive function regulation in congenitally deaf individuals, and that these deficits may impact reading processes.
Our results suggest a need to consider the relative weighting of component reading processes in light of the background characteristics of deaf readers, as there may be trade-offs among skills that ultimately promote text comprehension. The comparisons of deaf readers to other bilingual readers who may hold a differing set of skills, but nevertheless are able to achieve the same end goal, provides new opportunities to understand the multiple approaches to successful reading.
Acknowledgements
The authors would like to acknowledge all of the participants in this research study. Without their willingness, this work would not have been possible.
Financial support
It was funded by NSF Center Funding: SBE 0541953.
Conflicts of interest
We have no conflicts of interest to disclose.
Appendix A: Background Questionnaires
BACKGROUND QUESTIONNAIRE (HEARING)
Contact information:
Name:
Sex: Male/Female
Home address:
DOB:
Age:
Phone number: TTY Voice
E-mail address:
Are you left or right handed (circle one)? Left Right
Is anyone in your immediate family left-handed?
Have you ever had a serious neurological problem (stroke, epilepsy, coma, head injury, etc.)?
No Yes (please describe)
Are you willing to be contacted for future research? Yes No
All the information you provide in this questionnaire will be kept safe and confidential.
We may contact you to clarify some items about this experiment.
If you give us permission, we may also contact you about future experiments.
About you:
Do you have any sign language background?
NO YES
–If YES, please describe your sign language background:
(e.g., know fingerspelling, took high school class, know SEE/PSE/Total
Communication/ASL, etc.)
–If YES, please describe your fluency with sign language (e.g., Native, Fluent, Conversational,
Beginner):
Do you have any deaf family members?
NO YES
–If YES, please describe their relationship to you:
(e.g., father, grandmother, cousin, brother, aunt, etc.)
–If YES, does your family member know sign language?
NO YES
What was your first language(s)?
What is your preferred language(s)?
What spoken language(s) do you understand?
What written language(s) can you read?
What language(s) do you speak with your parents?
–Please rate your fluency with this language (7=Native Speaker, 6=Fluent, 5=Fluent Conversational, 4=Conversational, 3=Almost Conversational, 2=Still Learning, 1=Beginner):
7 6 5 4 3 2 1
What language(s) do you speak?
–Please rate your fluency with the language and indicate which language: (7=Native Speaker, 6=Fluent, 5=Fluent Conversational, 4=Conversational, 3=Almost Conversational, 2=Still Learning, 1=Beginner):
Language:
Fluency (circle one): 7 6 5 4 3 2 1
Language:
Fluency (circle one): 7 6 5 4 3 2 1
Language:
Fluency (circle one): 7 6 5 4 3 2 1
Other information:
Place of birth:
Years of education (12 for HS plus 1 year for each year beyond).
Major (if declared).
Language learned first.
Other languages spoken/signed.
Age when learned: first language second language.
Do you have any known problems with hearing, speech, or reading?
If yes, please explain:
Socioeconomic status:
Please indicate your yearly income:
$0–20,000
$20,000–40,000
$40,000–$60,000
$60,000–$80,000
$80,000–$100,000
$100,000 or more I’d rather not say
Please indicate your parents’ yearly income:
$0–20,000
$20,000–40,000
$40,000–$60,000
$60,000–$80,000
$80,000–$100,000
$100,000 or more I’d rather not say
Race (optional – for government records):
American Indian or Alaskan native Black (not Hispanic)
Asian White (not Hispanic)
Native Hawaiian or Other Pacific Islander Hispanic
BACKGROUND QUESTIONNAIRE (DEAF)
Contact information:
Name: Home address:
Sex: Male/Female
DOB:
Age:
Phone number: TTY Voice
E-mail address:
Are you left or right handed (circle one)? Left Right
Is anyone in your immediate family left-handed?
Have you ever had a serious neurological problem (stroke, epilepsy, coma, head injury, etc.)?
No Yes (please describe)
Are you willing to be contacted for future research? Yes No
All the information you provide in this Questionnaire will be kept safe and confidential.
We may contact you to clarify some items about this experiment.
If you give us permission, we may also contact you about future experiments.
About you:
When did you learn ASL?
From whom did you learn ASL? (Check off as many as apply)
Parents
Brothers/Sisters
Friends
Teachers
Other person (describe)
What language do you use with your parents?
What language do you use with your brothers/sisters?
What language do you use with your friends?
What language do you use with your children, if you have any?
What language do you prefer for communication?
What kind of language(s) did you use in school (circle below):
–Elementary school: ASL SEE home sign signed English oral English
–Junior high school:
ASL
SEE
home sign
signed English
oral English
–High school: ASL SEE home sign signed English oral English
–College (if any):
ASL
SEE
home sign
signed English
oral English
What language(s) do you speak or sign?
–Please rate your fluency with the language and indicate which language: (7=Native Speaker, 6=Fluent, 5=Fluent Conversational, 4=Conversational, 3=Almost Conversational, 2=Still Learning, 1=Beginner):
Language:
Fluency (circle one): 7 6 5 4 3 2 1
Language:
Fluency (circle one): 7 6 5 4 3 2 1
Language:
Fluency (circle one): 7 6 5 4 3 2 1
Are YOU deaf? Yes No
If so, please fill out the following:
When did you become deaf?
What was the cause?
dB loss left ear:
dB loss right ear:
Other Information:
Place of Birth
Years of Education (12 for HS plus 1 year for each year beyond)
Major (if declared)
Language learned first
Other languages spoken/signed
Age when learned: first language second language.
Do you have any known problems with hearing, speech, or reading?
If yes, please explain:
Socio-economic Status:
Please indicate your yearly income:
$0–20,000
$20,000–40,000
$40,000–$60,000
$60,000–$80,000
$80,000–$100,000
$100,000 or more I’d rather not say
Please indicate your parents’ yearly income:
$0–20,000
$20,000–40,000
$40,000–$60,000
$60,000–$80,000
$80,000–$100,000
$100,000 or more I’d rather not say
Race (optional – for government records):
American Indian or Alaskan native
Black (not Hispanic)
Asian
White (not Hispanic)
Native Hawaiian or Other Pacific Islander
Hispanic
Appendix B: Complete Descriptive Statistics
Table B1. ML descriptive statistics

Table B2. CEB descriptive statistics
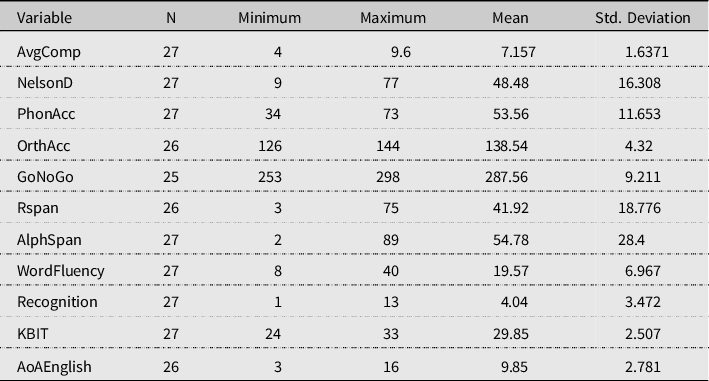
Table B3. NS descriptive statistics
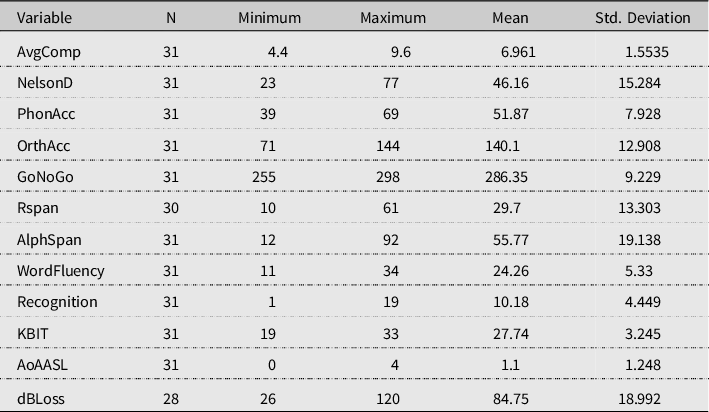
Table B4. NNS descriptive statistics

Appendix C: Complete Correlation Matrices
Table C1. ML correlations

**Correlation is significant at the 0.01 level (two-tailed).
*Correlation is significant at the 0.05 level (two-tailed).
Table C2. CEB correlations

**Correlation is significant at the 0.01 level (two-tailed).
*Correlation is significant at the 0.05 level (two-tailed).
Table C3. NS correlations

**Correlation is significant at the 0.01 level (two-tailed).
*Correlation is significant at the 0.05 level (two-tailed).
Table C4. NNS correlations

**Correlation is significant at the 0.01 level (two-tailed).
*Correlation is significant at the 0.05 level (two-tailed).
Appendix D: Complete Games–Howell Post Hoc Results
Table D1. Games–Howell post hoc results

aSignificance evaluated with Bonferroni correction at p < .0083


 Open access