


Introduction
Seabird breeding performance is expected to vary regionally as a consequence of ecological drivers affecting species across their range. Antarctic seabirds have to cope with extreme environmental stressors to survive and to reproduce successfully: sea-ice conditions, weather and food availability are reported to be crucial determinants shaping the distributions and life histories of these species (Wilson et al. Reference Wilson, Ainley, Nur, Jacobs, Barton, Ballard and Comiso2001, Ainley et al. Reference Ainley, Clarke, Arrigo, Fraser, Kato, Barton and Wilson2005, Jenouvrier et al. Reference Jenouvrier, Weimerskirch, Barbraud, Young-Hyang and Cazelles2005, Reference Jenouvrier, Caswell, Barbraud, Holland, Stroeve and Weimerskirch2009). Seabirds inhabiting polar regions consequently show high geographical variability in foraging strategies and breeding performance (Inchausti et al. Reference Inchausti, Guinet, Koudil, Durbec, Barbraud and Weimerskirch2003, Tremblay & Cherel Reference Tremblay and Cherel2003). Sea ice, in particular, is a dynamic structural element of the polar environment. Antarctic seabirds have evolved a number of different ecological adaptations to cope in this highly variable habitat that shapes their breeding and feeding activity (e.g. Ainley et al. Reference Ainley, O‘Connor and Boekelheide1984, Smith et al. Reference Smith, Ainley, Baker, Domack, Emslie and Fraser1999, Le Guen et al. Reference Le Guen, Kato, Raymond, Barbraud, Beaulieu and Bost2018). Continuous and rapid changes in sea ice during the breeding season make it necessary for birds such as penguins to deal with highly variable situations between the nesting site and foraging areas (Forcada & Trathan Reference Forcada and Trathan2009).
The Adélie penguin, Pygoscelis adeliae (Hombron & Jacquinot 1841), is one of two penguin species that only breed on the Antarctic continent and is relatively abundant along the Antarctic coasts (the other is the Emperor penguin, Aptenodytes forsteri, Gray 1844). Pygoscelis adeliae has developed extreme adaptations in feeding behaviour, such as diving. It breeds in colonies in ice-free areas during the summer. It needs land to breed and food to be available within a limited foraging range and at critical times during the breeding season. Physical factors related to environmental variability, including extent and quality of sea ice (e.g. Watanuki et al. Reference Watanuki, Kato, Sato, Niizuma, Bost, Le Maho and Naito2002, Ropert-Coudert et al. Reference Ropert-Coudert, Kato, Meyer, Pellé, MacIntosh and Angelier2015, Widmann et al. Reference Widmann, Kato, Raymond, Angelier, Arthur and Chastel2015), as well as oceanographic conditions (Forcada & Trathan Reference Forcada and Trathan2009), affect the availability (i.e. abundance and distribution) of their principal prey (euphausiaceans and fish). Local meso-scale pack-ice cover is also known to affect primary productivity and therefore to affect prey availability (Arrigo et al. Reference Arrigo, van Dijken, Ainley, Fahnestock and Markus2002). Individual traits such as sex, age and physiological status are also known to influence foraging behaviour (Ballard et al. Reference Ballard, Dugger, Nur and Ainley2010). Access to prey can be influenced by population size due to intraspecific competition for food resources (Ainley et al. Reference Ainley, Ribic, Ballard, Heath, Gaffney and Karl2004, Ballance et al. Reference Ballance, Ainley, Ballard and Barton2009).
In the Ross Sea region, the diet of Adélie penguins during the reproductive period consists mainly of crystal krill, Euphausia crystallorophias, and Antarctic silverfish, Pleuragramma antarctica (Clarke et al. Reference Clarke, Manly, Kerry, Gardner, Franchi, Corsolini and Focardi1998, Olmastroni et al. Reference Olmastroni, Corsolini, Pezzo, Focardi and Kerry2000, Ainley et al. Reference Ainley, Ballard, Barton, Karl, Rau, Ribic and Wilson2003, Reference Ainley, Dugger, La Mesa, Ballard, Barton and Jennings2018). These two species are at intermediate levels in the pelagic food web. Antarctic krill, Euphausia superba, is a dietary item of penguins of northern colonies, but it is relatively rare in the stomach contents of penguins nesting further south in Victoria Land (Ainley Reference Ainley2002). The distribution of krill species has various latitudinal and longitudinal gradients, with crystal krill living closer to coasts and the pelagic Antarctic krill preferring the continental slope (Azzali et al. Reference Azzali, Leonori, De Felice and Russo2006). This prey is influenced by sea-ice distribution (Davis et al. Reference Davis, Hofmann, Klinck, Piñones and Dinniman2017), which in turn affects the aggregation and foraging trips of top predators.
Previous studies on the Adélie penguin have documented various foraging tactics in colonies affected by sea ice on various spatiotemporal scales (Ainley et al. Reference Ainley, Wilson, Barton, Ballard, Nur and Karl1998, Clarke et al. Reference Clarke, Manly, Kerry, Gardner, Franchi, Corsolini and Focardi1998, Watanuki et al. Reference Watanuki, Kato, Sato, Niizuma, Bost, Le Maho and Naito2002, Reference Watanuki, Takahashi, Kato, Sato and Bost2004, Widmann et al. Reference Widmann, Kato, Raymond, Angelier, Arthur and Chastel2015, Le Guen et al. Reference Le Guen, Kato, Raymond, Barbraud, Beaulieu and Bost2018), although studies comparing site-specific foraging strategies, diet and breeding performance are still needed in the Victoria Land sector. Comparing colonies where penguins may adopt various foraging strategies and/or yield various levels of breeding performance is useful to predict variations in population-specific responses to environmental changes.
In this study, we observed and compared differences in foraging trips, diet, breeding success and chick growth rate of Adélie penguins in two colonies in central Victoria Land (Ross Sea) during summer 2000–01. The colonies had different population sizes and were exposed to specific local environmental conditions.
It can be expected that birds breeding at colonies relatively close to each other but exposed to different local sea-ice conditions have site-specific foraging patterns. Our two study colonies are part of a clustered group of three in central Victoria Land (see clusters 7–9 in Ainley et al. Reference Ainley, Nur and Woehler1995, p. 174) and differ as much as tenfold in breeding population size. This difference in numbers should lead to differences in intraspecific competition over food resources, which may in turn have cascading effects on foraging strategies, diet and breeding performance (Birt et al. Reference Birt, Birt, Goulet, Cairns and Montevecchi1987, Ainley et al. Reference Ainley, Nur and Woehler1995). The two colonies also differ in local sea-ice dynamics, leading to potential differences in prey distribution and foraging costs for penguins. Until late January, the smaller colony is generally separated from the sea by several kilometres of fast ice. Conversely, the larger colony is located on Terra Nova Bay close to a wind-generated coastal polynya (Vacchi et al. Reference Vacchi, DeVries, Evans, Bottaro, Ghigliotti, Cutroneo and Pisano2012), which may play an important role in shaping foraging trips and diet (e.g. by facilitating access to foraging areas and reducing travel costs throughout the breeding season).
Methods
Study areas
Our study was conducted from 30 October 2000 to 10 February 2001 in two penguin colonies: Edmonson Point (EdPo; 74°20'S, 165°08'E) and Inexpressible Island (InIs; 74°54'S, 163°39'E). These areas are located in Wood Bay and Terra Nova Bay, ~75 km apart, in the Ross Sea (Antarctica) (Fig. 1). Breeding populations, measured by ground count (SC-CAMLR 2004) on 29 November and 6 December 2000, were 1987 and 24 142 breeding pairs, respectively. During the study period, fast ice at EdPo stretched for 20–24 km, while the wind-driven polynya off InIs was 20–40 km from the shore of the island. Weather at the two colonies was determined from data of the weather stations InIs ‘Manuela’ (http://amrc.ssec.wisc.edu/aws/api/form.html) and EdPo ‘Penguin’ (http://www.climantartide.it). Meteorological data recorded every 10 min were averaged daily. Differences in daily weather at the two colonies in the period from November 2000 to January 2001 (n = 92 days) were assessed using two-tailed paired tests (relative humidity: paired Wilcoxon test; mean daily temperature: paired t-test, after checking for normal distribution of data by the Shapiro–Wilk test, W = 0.985, P = 0.354). Strong katabatic winds are common around InIs (Bromwich Reference Bromwich1985), although we could not formally test differences in wind chill between colonies because anemometer data were not available for InIs. At InIs, unpredictable and extreme weather events seem to play a major role in breeding outcomes for Adélie penguins (Olmastroni, unpublished data 2000). For example, during a visit to InIs in mid-November 2000, we found that many nests had been buried in snow after a strong blizzard. Many of them failed in subsequent days (Olmastroni, personal observation 2000).

Fig. 1. Locations of our study colonies (Edmonson Point and Inexpressible Island) in central Victoria Land (Ross Sea). Locations of a third colony in the same area (Adélie Cove) and the Italian Research Station (Mario Zucchelli Station; MZS) are also shown.
Penguin capture and handling
Whenever our data collection involved capturing penguins, either to study their foraging trips or to assess their diet, we observed the following Convention for the Conservation of Antarctic Marine Living Resources (CCAMLR) procedures. We captured penguins using a hand net. We determined the sex of adults on the basis of papillae by cloacal inspection (Sladen Reference Sladen1978). We marked adult penguins with passive transponders (TIRIS™, Texas Instruments Registration and Identification System) and externally with temporary marking dye before releasing them. The latter allowed us to avoid recapturing the same individual and facilitated observations to check that penguin breeding was not impaired by handling. Chicks weighed to plot their growth curve were initially marked with dye or an adjustable numbered Velcro™ band on the left flipper. Velcro flipper bands were adjusted according to chick size and were all removed at the end of the season. Handling time was less than 20 min per individual, and all penguins returned safely to their nests or crèche group.
Foraging trips
In the period from late December 2000 to January 2001, we tracked seven adult breeding penguins at EdPo and five at InIs using ST-10 Platform Terminal Transmitters (PTTs; Telonics, USA, packaged by Sirtrack, New Zealand). The devices were attached to the middle-lower back of penguins to reduce drag (Bannasch et al. Reference Bannasch, Wilson and Culik1994) using fast-setting cyanoacrylic glue (Loctite™ 401) and cable ties (Clarke et al. Reference Clarke, Emmerson and Otahal2006). Birds were allowed to perform approximately two to four trips before the instruments were removed. Satellite position data were downloaded from ARGOS, and processed by SO through the Australian Antarctic Division data centre. Each foraging trip was analysed using the following criteria: colony position start/end of foraging trip; delta time between fixes 0.25 h, maximum allowed speed 7 kph; all data were filtered for minimum quality accuracy 1 (within 1 km) (Clarke et al. Reference Clarke, Emmerson and Otahal2006). Whenever possible, consistency of penguin departure/arrival time was also checked by direct observation at the nest. Data were analysed using ArcView 3.2 (ESRI, Inc.) with the Animal Movement extension (USGS_BRD, Alaska Biological Science Center). We calculated the duration (decimal hours), overall distance travelled (km) and maximum linear distance travelled from the colony (km) of each foraging trip.
Diet sampling and analysis
We collected stomach contents of penguins by method A8 of CCAMLR Standard Methods (SC-CCAMLR 2004): during chick rearing, and at least 10 days after the hatching peak, adults returning from foraging trips were stomach flushed by the water-offloading technique (Wilson Reference Wilson1984), which was repeated in order to obtain complete stomach contents (i.e. until clear water emerged). In the period from 2 to 30 January 2001, we obtained complete stomach contents from nine individuals (three females, six males) at EdPo and ten individuals (five females, six males) at InIs. In order to avoid temporal inconsistencies, we attempted to balance diet sampling in the two study colonies (~2–3 day intervals). As penguins were individually marked, stomach contents can be regarded as independent samples (i.e. belonging to different individuals). Stomach samples were preserved in ethanol and were analysed according to SC-CCAMRL (2004) guidelines. The mass of each sample (g fresh weight) was determined after draining through a sieve. We subtracted the weight of rocks (range 0–15.36 g) from total drained stomach content weight to obtain the total weight of food brought back to the nest by penguins. Contents were divided into four main categories (krill, amphipods, fish, squid), each of which was then weighed and measured. The proportion of each prey category was calculated based on the total amount of prey ingested for each individual.
We distinguished krill species (Antarctic and crystal krill) and amphipod families (Gammariidae and Hyperiidae) according to Food and Agriculture Organization (FAO) species identification sheets (FAO Reference Fischer and Hureau1985). As digestion reduced the number of krill specimens with an intact carapace, up to ten integral specimens of E. superba and E. crystallorophias were randomly selected from each sample, and their body lengths (mm) were measured with a calliper to the nearest 1 mm (n = 149 E. superba, n = 150 E. crystallorophias).
A total of 324 fish otoliths were analysed to identify fish species (preferably) or family using a 10x stereomicroscope. Recognition of otoliths to the closest taxon and measurements of otolith length were carried out following Williams & McEldowney (Reference Williams and McEldowney1990) and with the aid of an Aforo Shape Analysis of Fish Otoliths (http://aforo.cmima.csic.es/index.jsp). We determined the number of individuals per species and per sample by calculating the minimum number of individuals, according to the method described by Emslie et al. (Reference Emslie, Fraser, Smith and Walzer1998). Maximum otolith length was measured with a micrometric eyepiece (10x) to an accuracy of 0.1 mm. The lengths of 58 intact otoliths (i.e. not showing signs of erosion) of P. antarctica were measured in order to obtain the standard lengths of fish ingested according to the regression formula developed by Williams & McEldowney (Reference Williams and McEldowney1990, p. 109). In order to assess the variety of fish species preyed on, we calculated the Shannon–Weaver diversity (H‘) and Pielou evenness (J) indices (Peet Reference Peet1975).
Breeding parameters
Whenever possible, hatching date was recorded (EdPo: 106 nests; InIs: 72 nests). Breeding success was assessed on 224 nests with eggs at EdPo and 241 nests with eggs at InIs. We considered the ratio of the observed number of chicks successfully in crèche to the number of nests with eggs. To determine the growth rate of offspring in each colony, chicks from at least 20 nests per colony were weighed regularly from hatching to the end of the crèche period (see Table SI in the supplementary material for breeding chronology). We also weighed 46 chicks at EdPo and 30 at InIs after fledging (2–6 February).
Statistical analysis
We assessed differences in foraging trips between colonies using generalized linear mixed models. For each foraging trip, we evaluated three response variables separately: trip duration, overall distance travelled and maximum distance travelled from the colony. We modelled them using Gamma errors (link function: log) because response variables were 0+ values and because the same analysis conducted with a Gaussian error distribution did not support normality of residuals. We included the colony as the categorical predictor (reference level: EdPo). We considered breeding period (guard vs crèche) and individual differences by including individual identity as a random intercept nested in the period. The data were weighted according to the number of fixes recorded in each foraging trip, and the significance of the predictor was tested by assessing whether 95% confidence intervals contained zero.
We assessed individual differences in meal quantity between colonies using the t-test, after validating normality and homoscedasticity assumptions (Shapiro–Wilk test, EdPo: W = 0.875, P = 0.139, InIs: W = 0.898, P = 0.208; F-test: F = 1.52, P = 0.561). We looked for an overall difference in meal composition (quantities of fish, krill, amphipods and other items) between the two colonies by comparing the total amount of each food category using a χ2 test based on 99 999 Monte Carlo permutations. Due to the non-normal distribution of the percentages of food categories per individual, we used the Mann–Whitney test to assess individual differences in prey items between the colonies, considering the four prey categories, and also considering the krill and fish species or amphipod families identified. We used the t-test to compare size (length) of Antarctic krill between colonies (Shapiro–Wilk test, EdPo: W = 0.98 P = 0.11, InIs: W = 0.97, P = 0.24; F-test: F = 1.11, P = 0.64), while we used the Mann–Whitney test to assess differences in length of crystal krill and Antarctic silverfish between colonies.
We compared the hatching date (as a day in December) between the colonies by the Mann–Whitney test. We used the χ2 test based on 99 999 Monte Carlo permutations to assess differences in breeding success between the colonies by comparing the number of chicks successfully in crèche to the expected number of chicks in sampled nests with eggs. We ran a linear mixed model to compare chick mass between EdPo and InIs over seven time periods, established arbitrarily between the hatching date and when chicks entered the crèche (SC-CCAMLR 2004): 0–5 days from hatching date, 6–10 days, 11–15 days, 16–20 days, 21–25 days, 26–30 days and crèche stage. We set colony as the categorical predictor (reference level: EdPo) and time period as a random intercept. We tested predictor significance by assessing whether 95% confidence intervals contained zero. We used the t-test (after checking for normality and homoscedasticity; Shapiro–Wilk test, EdPo: W = 0.979, P = 0.581, InIs: W = 0.954, P = 0.226; F-test: F = 1.332, P = 0.379) to compare chick weight at fledging between colonies, as these data were not recorded on the same nests as those of chick weight from hatching to crèche.
Statistical analysis was performed using Past and R Stats packages (www.R-project.org) and lme4 (Bates et al. Reference Bates, Maechler, Bolker and Walker2015). All tests were two-tailed and the significance level was set at α = 0.05. All values are reported as mean ± standard error (for data analysed by two-sample tests) or as 95% confidence intervals of effect-size estimates (for model predictions), unless otherwise specified.
Results
Weather at the colonies
In the period from November 2000 to January 2001, the weather was harsher at InIs. Despite similar relative humidity (EdPo: 55.8 ± 1.03%, InIs: 54.2 ± 1.05%; Table I), a colder mean daily temperature was recorded at InIs (EdPo: -5.09 ± 0.33°C, InIs: -6.37 ± 0.35°C; Table I).
Table I. Results of univariate statistical tests assessing differences between the two study colonies in weather, diet, prey size and breeding parameters. For details on sample size, validation of assumptions and descriptive statistics, see text.

Foraging trips
During the study period, birds from the two colonies travelled to distinct foraging areas (Fig. 2a). Considering breeding period and penguin identity, the models predicted that penguins from InIs performed foraging trips that were on average 21.75–142.14 km longer than those by penguins at EdPo (EdPo: 98.22–136.17 km; Fig. 2b & Table II) and spent on average 12.22–46.03 more hours travelling than penguins from EdPo (EdPo: 41.94–52.97 h; Fig. 2b). Penguins from InIs also travelled on average 10.41–63.44 km farther from the colony than did penguins from EdPo (EdPo: 30.85–44.86 km; Fig. 2b & Table II).
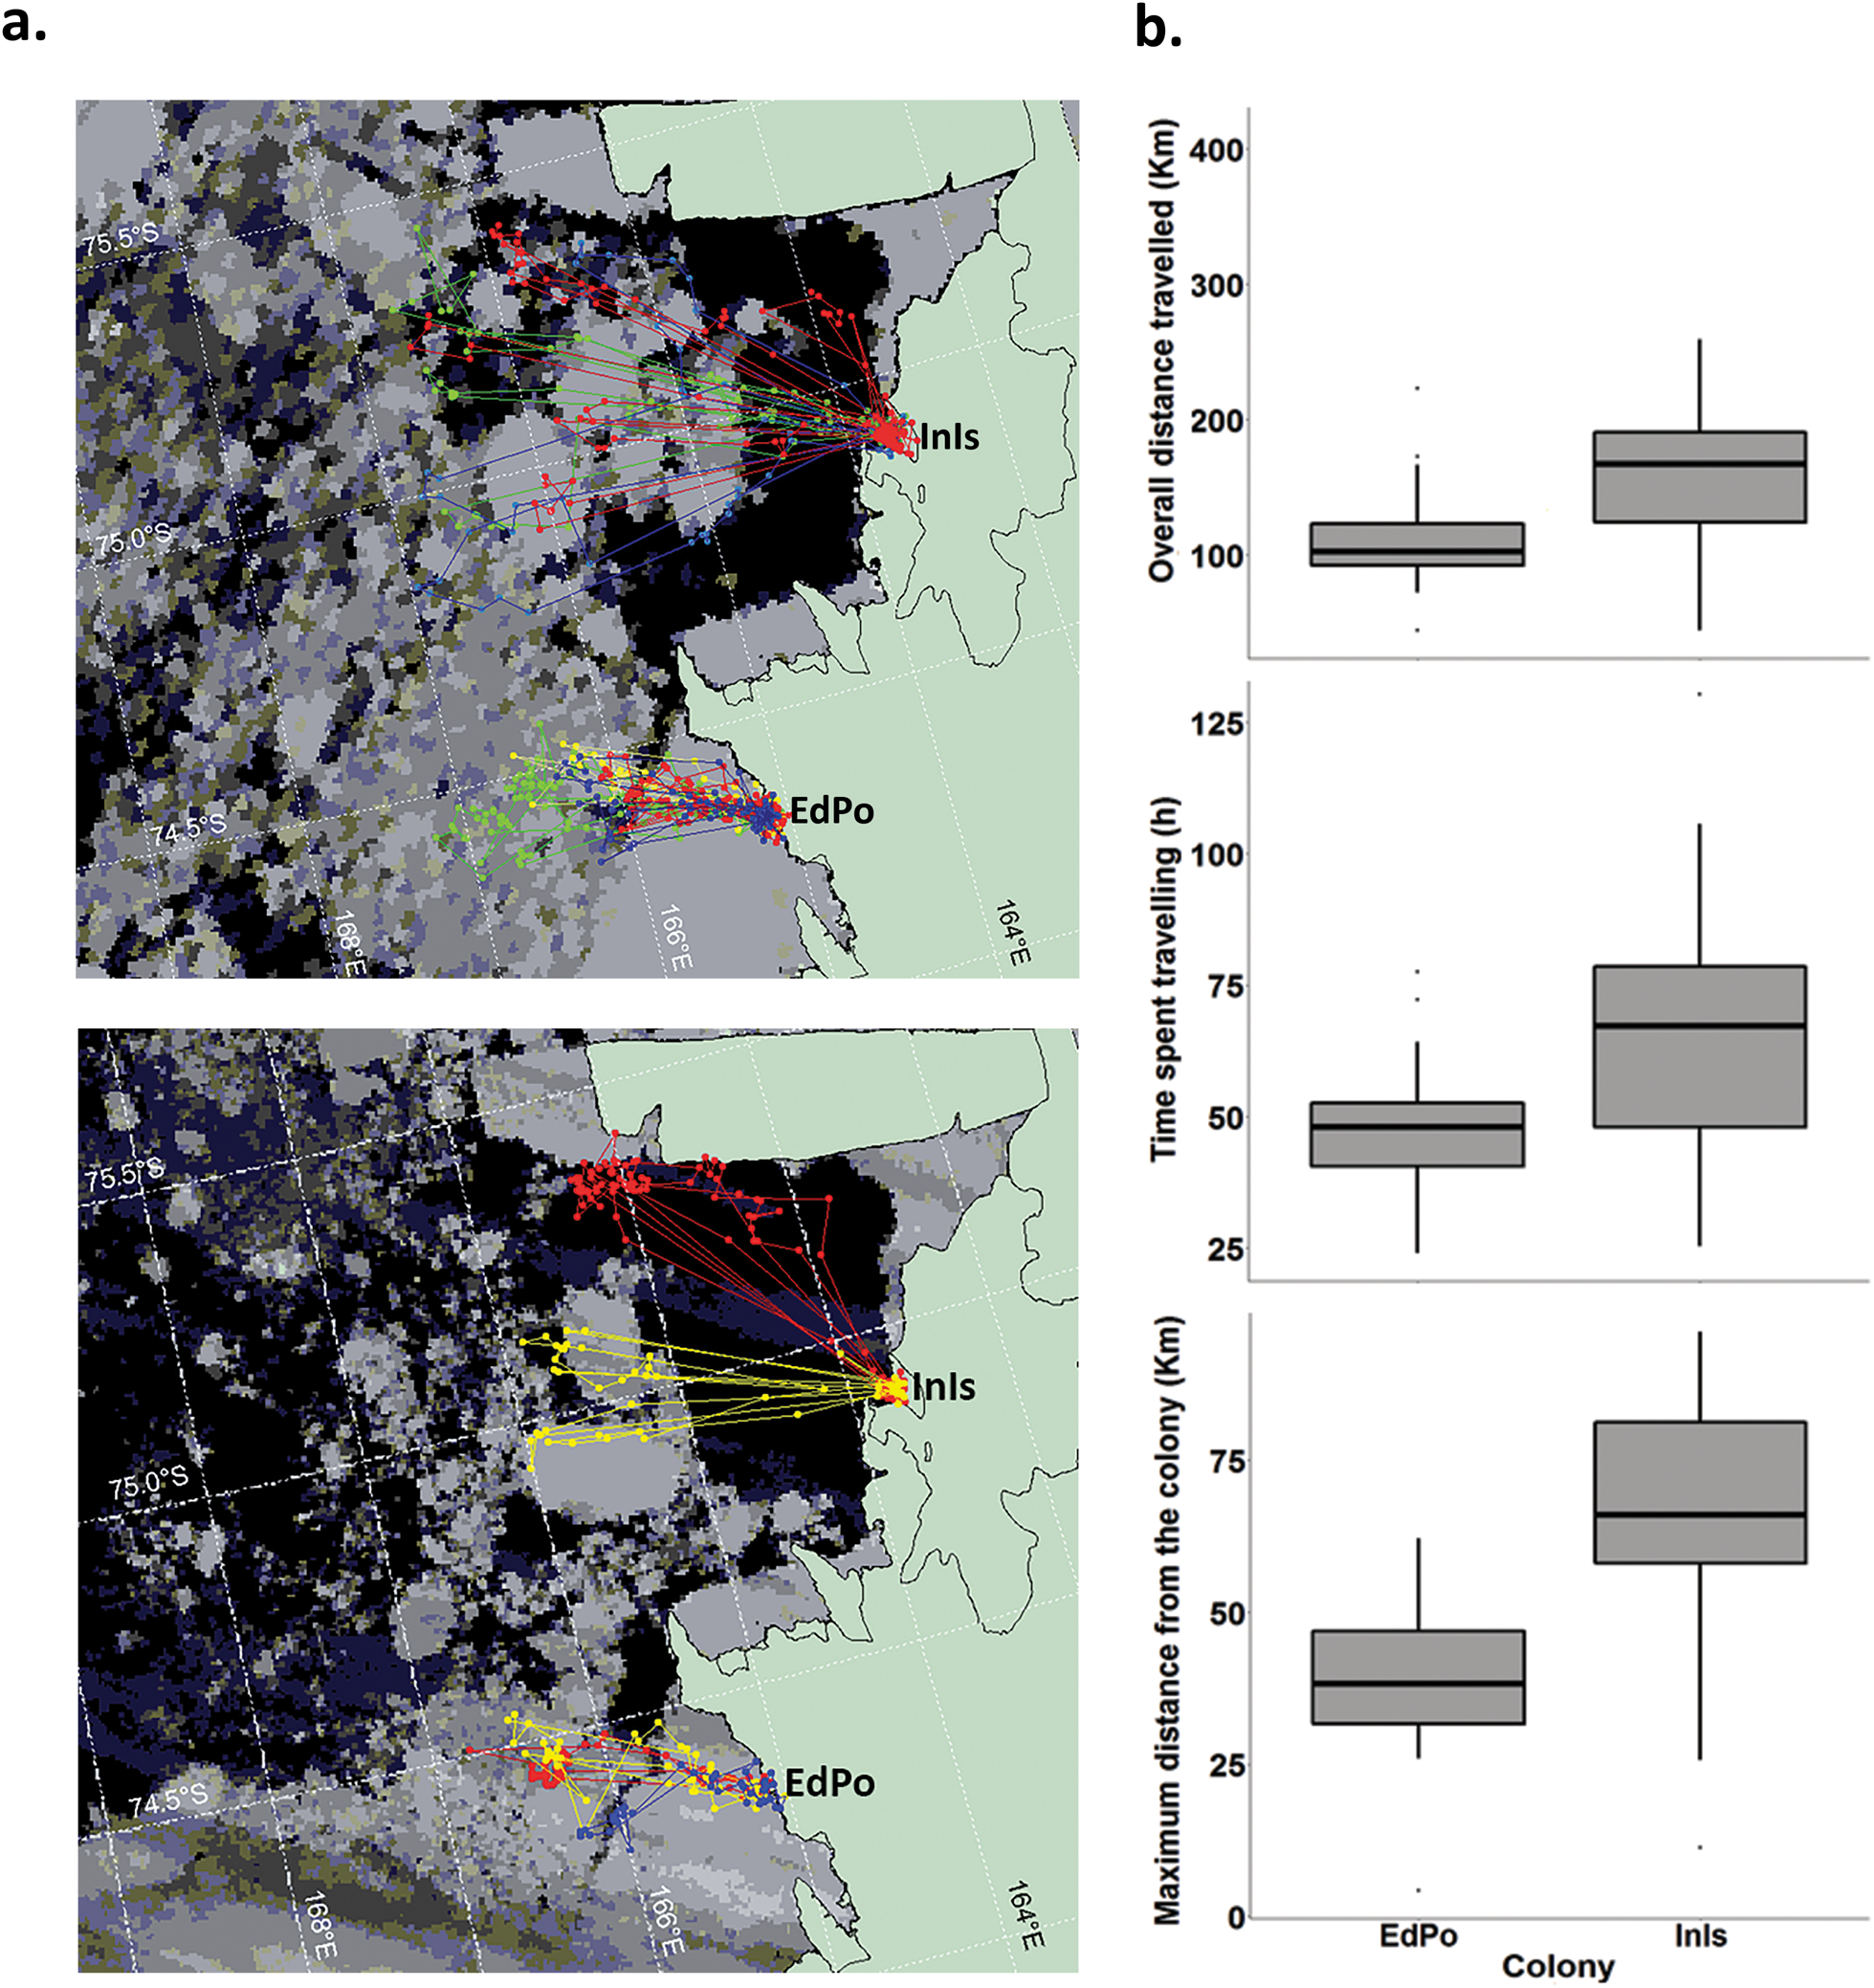
Fig. 2. a. Foraging trips of Adélie penguins from Edmonson Point (EdPo) and Inexpressible Island (InIs) during guard (top; satellite image: 26 December 2000) and crèche stages (bottom; satellite image: 21 January 2001). Satellite images were georeferenced and the data were projected on the map by Envi 3.4 (Research Systems, Inc.). The map is from the SCAR Antarctic Digital Database version 3 (sheet no. SS58-60). b. Differences in overall distance travelled, time spent travelling and maximum distance from colony during foraging trips by members of the two colonies (the differences are significant irrespective of individual and breeding stage: see text). Boxplots show medians (thick lines), interquartile ranges (boxes), ranges (whiskers) and outliers (dots). For details on statistical analysis, see text.
Table II. Coefficients (B) with relevant 95% confidence intervals (CIs) estimated for generalized linear mixed models and a linear mixed model testing differences in foraging trips and chick growth between the two colonies. The reference category for colony is Edmonson Point. Variance of random factors (var) and model fit (R 2) are also shown for each model.
a Confidence intervals that do not inlcude zero.
InIs: Inexpressible Island.
Diet
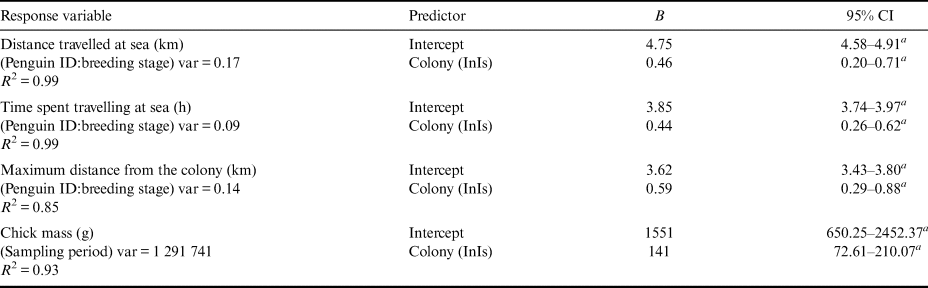
In January 2001, the quantity of food brought back to the colony per individual did not differ between EdPo and InIs (EdPo: 419.06 ± 57.59 g, n = 9, InIs: 328.46 ± 67.56 g, n = 10; Table I), yet its overall composition differed between colonies (χ2 = 107.69, df = 1, P < 0.0001). At the individual level, the percentage of krill per penguin was greater at EdPo (EdPo: 94.32 ± 2.34%, InIs: 72.83 ± 8.59%; Table I), whereas that of fish was greater at InIs (EdPo: 3.89 ± 1.28%, InIs: 16.01 ± 6.88%; Table I). The percentages of amphipods (EdPo: 1.77 ± 1.11%, InIs: 7.58 ± 4.01%; Table I) and squid per penguin (EdPo: 0.02 ± 0.01%, InIs: 3.58 ± 3.58%; Table I) did not differ between colonies. Percentages of Antarctic krill (EdPo: 43.95 ± 11.33%, InIs: 57.03 ± 14.06%; Table I) and crystal krill (EdPo: 56.05 ± 11.33%, InIs: 42.96 ± 14.06%; Table I) also did not differ between colonies. Antarctic silverfish was the predominant fish species in the diets of both colonies (EdPo: 82.35%, n = 34 fish, InIs: 98.62%, n = 145 fish). Other fish species were Trematomus bernacchii (EdPo: 8.82%, n = 34 fish, InIs: 0.69%, n = 145 fish), Chaenodraco wilsoni (EdPo: 5.88%, n = 34 fish, InIs: 0.69%, n = 145 fish) and Pagothenia borchgrevinki (EdPo: 2.94%, n = 34 fish, InIs: 0%, n = 145 fish). Percentages of Gammarid (EdPo: 73.91 ± 15.26%, InIs: 63.26 ± 12.29%; Table I) and Hyperiid amphipods (EdPo: 26.87 ± 15.26%, InIs: 36.63 ± 12.29%; Table I) did not differ between colonies. The sizes of Antarctic krill (EdPo: 46.09 ± 0.34 mm, InIs: 45.06 ± 0.43 mm; Fig. 3a & Table I) did not differ between colonies, but sizes of crystal krill (EdPo: 25.62 ± 0.43 mm, InIs: 23.12 ± 0.70 mm; Fig. 3b & Table I) and Antarctic silverfish (EdPo: 82.59 ± 8.83 mm, InIs: 52.29 ± 2.22 mm; Fig. 3c & Table I) were smaller at InIs. The Shannon and Pielou indices were higher for EdPo (H'EdPo = 0.64, H'InIs = 0.08, J EdPo = 0.46, J InIs = 0.07).
Fig. 3. Differences in kernel density estimates (KDEs) of the lengths of prey species (a. Antarctic krill, Euphausia superba; b. crystal krill, Euphausia crystallorophias; c. Antarctic silverfish, Pleuragramma antarctica) between colonies (red: Edmonson Point; blue: Inexpressible Island). Dashed lines show mean values.
Breeding chronology, breeding success and chick growth
The chronology of the breeding cycle in the 2000–01 summer is summarized in Table SI. Hatching occurred ~2 days earlier at EdPo (EdPo: 18.82 ± 0.34 December, n = 170 eggs, InIs: 20.63 ± 0.37 December, n = 135 eggs; Table I). Breeding success did not differ between colonies (EdPo: 0.91 chicks/nest, InIs: 0.90 chicks/nest; Table I). Chicks sampled regularly from study nests were significantly heavier at InIs throughout the breeding season (i.e. regardless of sampling period): the model predicted chicks from InIs to be 72.61–210.07 g heavier than those from EdPo (EdPo: 650.26–2452.37 g; Fig. 4a & Table II). Chicks from InIs achieved greater body mass at fledging (EdPo: 3291.80 ± 56.68 g, n = 46 chicks, InIs: 3581.20 ± 81.01 g, n = 30 chicks; Fig. 4b & Table I).

Fig. 4. a. Differences in chick weight between colonies in the hatching-to-crèche stage (red: Edmonson Point, EdPo; blue: Inexpressible Island, InIs; differences are significant irrespective of sampling period: see text). b. Difference in chick weight between colonies at fledging (* significant). Boxplots show medians (thick lines), interquartile ranges (boxes), ranges (whiskers) and outliers (dots).
Discussion
We showed that two colonies with various local ecological conditions displayed differences in foraging distance, diet and breeding performance. In group-living foragers, intraspecific competition for food may influence social and spatiotemporal behaviour: the larger the number of individuals in the group, the greater the foraging interference (e.g. Birt et al. Reference Birt, Birt, Goulet, Cairns and Montevecchi1987). Accordingly, foraging competition should be greater in large colonies of seabirds, and availability of resources per individual should decrease in proportion to colony size (e.g. Cairns Reference Cairns1989, Ainley et al. Reference Ainley, Dugger, La Mesa, Ballard, Barton and Jennings2018). In turn, all other factors being equal, individuals from large colonies should forage over a larger area to avoid competitors and to achieve adequate food intake (e.g. Ballance et al. Reference Ballance, Ainley, Ballard and Barton2009 for Adélie penguins). Our findings on the spatial range of foraging trips may support this hypothesis: the penguin population at InIs was ten times larger than the one at EdPo, and birds from InIs did indeed travel further and for longer than those at EdPo. There is a third Adélie penguin colony, Adélie Cove, ~17 km north of InIs (Fig. 1). On 12 December 2000, we estimated a population of 7735 breeding pairs by ground count at Adélie Cove. These extra competitors may have contributed to prey depletion in the Terra Nova Bay area, forcing penguins nesting at InIs to travel longer distances from the coast and to perform longer-lasting trips than those at EdPo in order to avoid foraging areas used by conspecifics. However, as no synoptic foraging data for the Adélie Cove colony or information on prey abundance are available for this season, we could not test whether extra competitors from Adélie Cove and/or food were limiting factors. Alternative explanations, such as varying prey distribution/availability, could also have influenced their foraging tactics (e.g. Watanuki et al. Reference Watanuki, Kato, Mori and Naito1993). Overall, we found that Adélie penguins nesting in central Victoria Land fed mainly on krill, fish and, to a lesser extent, amphipods. This is in line with our previous findings for the EdPo colony in various years (Olmastroni et al. Reference Olmastroni, Corsolini, Pezzo, Focardi and Kerry2000) and with those reported by Ainley et al. (Reference Ainley, Ballard, Barton, Karl, Rau, Ribic and Wilson2003) for colonies on Ross Island (95% crystal krill and silverfish, 5% amphipods).
The quantitative data for krill species of our study indicate that E. superba was on the whole the predominant species in the diet of penguins in January 2001 (30–50% of stomach contents in both colonies). The frequency distribution of body length of krill specimens in our samples also indicates that juvenile and adult stages of E. crystallorophias and E. superba (according to the age classification reported by Sala et al. Reference Sala, Azzali and Russo2002 and Ainley et al. Reference Ainley, Ballard, Barton, Karl, Rau, Ribic and Wilson2003) were both present in the Terra Nova Bay area in summer 2000–01. The stomach contents of penguins from InIs contained greater quantities of E. superba than E. crystallorophias, which, conversely, was more abundant in samples from EdPo, although differences were not significant. Penguins from InIs travelled longer times and distances than those at EdPo. This could explain the higher percentage of E. superba found in samples from penguins of InIs and the predominance of E. crystallorophias in the stomach contents of penguins from EdPo. In fact, oceanographic surveys in the western Ross Sea, described in Sala et al. (Reference Sala, Azzali and Russo2002) and Azzali et al. (Reference Azzali, Leonori, De Felice and Russo2006), report only a small overlap in the distributions of the two krill species, with a spatiotemporal distribution linked to sea-ice conditions. Euphausia superba has a prevalently more pelagic distribution than E. crystallorophias. Antarctic krill is the principal penguin prey throughout Antarctica, including northern Victoria Land. Conversely, it is reported to be absent or rare in the diets of penguins breeding at southern colonies (table 2.1 in Ainley Reference Ainley2002, Kristan et al. Reference Kristan, Emslie and Patterson2019). Our study shows that E. superba may be available to penguins nesting in central Victoria Land.
Studies on the diet of Adélie penguins of southern Ross Sea colonies (> 74°S) over three breeding seasons (Ainley et al. Reference Ainley, Wilson, Barton, Ballard, Nur and Karl1998) found crystal krill and Antarctic silverfish to be the main prey. Pleuragramma antarctica was the only fish present, constituting up to 50–90% of the stomach contents of penguins foraging in open-water habitats adjacent to fast ice. In January 2001, penguins from the two study colonies fed mainly on silverfish (95% of the species consumed), confirming that this species is a major food item when energy demand is high for raising chicks (Ainley et al. Reference Ainley, Ballard, Barton, Karl, Rau, Ribic and Wilson2003). The low percentages (1–2%) of other fish species may indicate opportunistic catches in trophic niches shared by a number of fish or varying predatory behaviour by individual Adélie penguins in the study area (Clarke et al. Reference Clarke, Manly, Kerry, Gardner, Franchi, Corsolini and Focardi1998, Nesti et al. Reference Nesti, Ropert-Coudert, Kato, Beaulieu, Focardi and Olmastroni2010).
The sizes of P. antarctica ingested by InIs penguins were smaller than those ingested by penguins from EdPo. According to La Mesa et al. (Reference La Mesa, Catalano, Russo, Greco, Vacchi and Azzali2010), silverfish in the ranges 28–33 and 53–74 mm are post-larval specimens and 1 year and over (i.e. juveniles) respectively, living in the water column at depths of 0–200 m. Post-larval and juvenile stages constitute 95–99% of the ichthyoplankton on the Ross Sea continental shelf (Granata et al. Reference Granata, Cubata, Guglielmo, Sidoti, Greco, Vacchi and La Mesa2002), where they tend to occupy extensive areas near submarine banks often in association with krill (Sala et al. Reference Sala, Azzali and Russo2002). During the study period, penguins used areas off their colonies for a mean linear distance of 40–60 km, closer to the coast in the case of EdPo and beyond the external edge of the Terra Nova Bay polynya in the case of InIs. The regions where the two groups foraged may have underwater topographic features (basins and banks; see fig. 1 in La Mesa et al. Reference La Mesa, Catalano, Russo, Greco, Vacchi and Azzali2010) that aid upwelling and concentration of prey. The fact that more fish were caught off InIs may also be due to favourable conditions for rapid growth of P. antarctica larvae near polynya, in line with autumnal phytoplankton blooms (Vacchi et al. Reference Vacchi, DeVries, Evans, Bottaro, Ghigliotti, Cutroneo and Pisano2012). Indeed, Terra Nova Bay seems to be particularly rich in silverfish at various growth stages (Davis et al. Reference Davis, Hofmann, Klinck, Piñones and Dinniman2017, O‘Driscoll et al. Reference O‘Driscoll, Ladroit, Parker, Vacchi, Canese and Ghigliotti2018).
Concerning the slight difference in breeding chronology between the two colonies, the colder weather and blizzard we recorded at InIs during early incubation could have delayed hatching. One might expect greater breeding success and chick growth at EdPo because offspring enjoyed a more sheltered (and therefore less energy-consuming) situation compared to InIs. Surprisingly, our findings showed that penguins at InIs reared heavier chicks than penguins nesting at EdPo, although there were no differences in breeding success, and despite the harsher weather, greater colony size and longer-lasting foraging trips were also associated with the InIs colony. We suggest that two factors may explain the varying early growth patterns of chicks in the two colonies, although other hypotheses remain to be tested. 1) Adults from EdPo had to walk several kilometres on fast ice to reach the foraging grounds and return to feed chicks, whereas penguins from InIs could swim all of the way. For penguins, locomotion on ice and snow is known to require greater energy expenditure than swimming (Pinshow et al. Reference Pinshow, Fedak, Battles and Schmidt-Nielsen1976, Wilson et al. Reference Wilson, Culik and Adelung1991). This difference in foraging trips to the sea may have affected parents from EdPo, causing them to consume a greater proportion of the food ingested in order to cover the extra exertion of walking (than in the case of penguins from InIs), thus reducing the food delivered to their young (sensu Ainley et al. Reference Ainley, Wilson, Barton, Ballard, Nur and Karl1998, Emmerson & Southwell Reference Emmerson and Southwell2008). If so, less of the similar food loads foraged by adults of the two colonies would have been delivered to chicks at EdPo. 2) As the quantity of food ingested by adults did not differ between the two colonies, chicks at InIs may have benefitted from the larger proportion of fish foraged by their parents. Fish has been shown to have a higher caloric content than krill (Ainley et al. Reference Ainley, Ballard, Barton, Karl, Rau, Ribic and Wilson2003, Reference Ainley, Dugger, La Mesa, Ballard, Barton and Jennings2018, Whitehead et al. Reference Whitehead, Lyver, Ballard, Barton, Karl and Dugger2015, Jennings et al. Reference Jennings, Varsani, Dugger, Ballard and Ainley2016). Chicks at InIs, fed a larger quantity of fish, may therefore have built up more fat reserves than chicks at EdPo, achieving faster growth and higher body weight at fledging. However, more data are needed to distinguish the effects of confounding variables in order to verify either hypothesis.
Clustered colonies are reported to have similar diets, with birds breeding in smaller colonies reducing their foraging distances (Ainley et al. Reference Ainley, Ballard, Barton, Karl, Rau, Ribic and Wilson2003). However, differences in population size, access to foraging grounds (in relation to fast ice and/or polynya), sea ice, sea currents, intraspecific competition and prey distribution/abundance can all be determinants for neighbouring colonies (Emmerson & Southwell Reference Emmerson and Southwell2008). The role of the Terra Nova Bay polynya has not been widely investigated for the top predators living in this area. However, this productive hotspot (Davis et al. Reference Davis, Hofmann, Klinck, Piñones and Dinniman2017) may improve foraging efficiency and prey quality (i.e. higher energy intake), ultimately supporting the larger penguin population at InIs and the neighbouring colony at Adélie Cove with respect to the Wood Bay colony (EdPo).
In describing two Adélie penguin colonies in central Victoria Land, including breeding phenology, reproductive output and (during chick rearing) foraging areas and diet, we observed that penguins breeding in neighbouring colonies with varying habitat conditions and population sizes successfully tackled both situations by implementing various foraging strategies in relation to the physical characteristics of their nesting and feeding sites. However, our analysis would have benefitted from a greater sample size and repeated data from various years. In particular, interannual comparisons of foraging trips and breeding success at the cluster of colonies in mid-Victoria Land could complete the complex scenario of the Ross Sea Adélie penguin population, which accounts for 38% of the global population of this species (Ainley Reference Ainley2002). To this end, our local baseline data may help future research in this area to clarify potential concerns regarding regional changes in sea-ice dynamics and the biological responses of Antarctic seabirds (Massom & Stammerjohn Reference Massom and Stammerjohn2010), as is required by the monitoring and management research plan for the Ross Sea Marine Protected Area.
Acknowledgements
We are grateful to K.R. Kerry for conceiving and supervising the research and for commenting on a draft of the manuscript. We are indebted to I. Bisogno and B. Sprugnoli for help with diet analysis and to V. Volpi for assistance with GIS analysis. The authors appreciated the support of the Australian Antarctic Division, the PNRA Meteo-Climatological Observatory at MZS and Victoria Land (www.climantartide.it), the dataset, data display and information provided by the University of Wisconsin-Madison‘s Automatic Weather Station programme, grant number ANT-1543305 from the National Science Foundation and the map in Fig. 1 from the Quantarctica‘s Norwegian Polar Institute. We thank the anonymous reviewers for their insightful comments and suggestions.
Author contributions
SO conceived the research and performed data collection and analysis. FP performed data collection. NF conceived and performed the statistical analysis. SF supervised the PNRA1999/1.3 project. SO and NF wrote the manuscript. All authors commented on the manuscript and approved the final draft.
Financial support
The Programma Nazionale di Ricerche in Antartide (PNRA) provided logistical support. This research was funded by Ministry of Education, University and Research (MIUR) project PNRA1999/1.3.
Supplemental material
A supplemental table and a supplemental figure will be found at https://doi.org/10.1017/S0954102020000085.


 Open access