


1. Introduction
In performing tests of dynamic ice-structure interactions in the model regime, it is important for reliable results that the mechanical properties of the model ice must be accurately scaled from those of the prototype ice. Based on Froude scaling, this entails scaling the strengths (including flexural, compressive, tensile and shear} and modulus of the ice by the linear scale factor λ of the tests while maintaining the same frictional coefficients, density and Poisson's ratio as in the prototype system. To date, the majority of tests performed in ice modelling basins have been concerned with evaluating the performance of icebreakers operating in level-ice conditions. As such, since flexural failures predominate in these types of tests, attention is given to scaling the flexural strength of the ice accurately. This scaling of one strength is straightforward over a wide range of scale factors. However, with the new wave of experiments being performed in the model regime, including determining the forces exerted by a slow moving ice sheet interacting with either a rigid or a flexible structure, it is clear that scaling of only the flexural strength is no longer sufficient. In these types of tests there can be mixed mode failures which involve both flexure (bending) and compression (crushing). In addition, in several types of tests such as an ice sheet fail ing along a long straight wall, a condition of plane strain can occur. Clearly, in order to interpret reliably these types of tests, it is necessary to have a quantitative appreciation of the compressive strength of the model ice. In this paper, both the uniaxial and plane-strain compressive strengths of carbamide (urea) model ice are documented for scale factors of 40>λ>5. In addition, the influences of loading stress and strain-rates, platen material and direction of loading are discussed. Finally, a numerical and physical comparison is made of the compressive failures of model and prototype ice.
2. Structural Properties of Model Ice
In order to have a full appreciation of the results of the compression tests, it is necessary to have a knowledge of the structure of model ice. When model ice is grown, the ice is constantly forced to grow in the supercooled regime. This creates a dendritic structure which traps the dopant chemical between the platelets and provides the mechanisms for reducing the strength of the ice.
Before the ice is grown, the solution is mixed under cold ambient air conditions until the temperature of the solution is reduced uniformly to a temperature -0.1°C above its freezing point. At this stage, agitation is stopped. With continued cooling, the upper surface of the solution becomes thermally supercooled so that a fine mist of water droplets (the “seeding”) nucleates the surface of the water and fine ice crystals start to grow into the melt (Fig.l: layer A). Because ice is a selective lattice, it incorporates very few substitutional ions. During ice growth, therefore, the chemical dopant is mostly pushed away from the growing interface. Because of the high growth velocity for this thin ice, however, some of the chemical dopant is trapped between grain boundaries. With continuing growth, the impurities in front of the growth interface build up to an extent whereby the solution in front of the interface becomes constitutionally supercooled (i.e. supercooled as a result of composition). At this stage (Fig.l: layer B), the dendritic structure becomes the stable growth phase, and the rest of the ice thickness grows with this structure (Fig.l: layer C). After the freeze, the air temperature is raised to -+l°C to warm the ice sheet. Because of the phase relationship between urea and water, the urea trapped in the ice starts to melt the ice internally. This results in a reduction in strength of the ice which continually decreases for increasing times of warming. In this way, the strength of the model ice can be altered to produce flexural strengths which represent model scale factors between 5 and 40, depending on the time of warming.
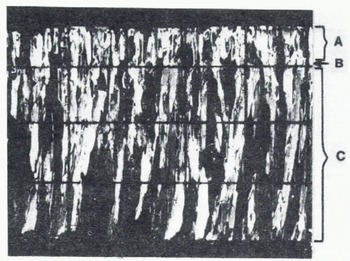
Fig. 1. Vertical thin section of model ice. The grid is 1 cm on a side.
3. Uniaxial Compression
In designing the tests, the mechanically weak nature of model ice presents several unique problems which influence the type of test which can be done (Reference TimcoTimco 1981). These problems include the necessity for quickly testing the ice once it is removed from the solution (to minimize the effects of liquid drainage from the ice), the difficulty in choosing a suitable platen material to minimize end effects, and the necessity of having two different types of test apparatus to cover the whole range of loading rates applicable to model tests. Moreover, since refrigerated model ice is anisotropic, two loading directions must be studied. In the present tests, several sheets of carbamide (urea) model ice were grown in the refrigerated modelling basin in the Hydraulics Laboratory at the National Research Council of Canada (Pratte and Reference TimcoTimco 1981). The urea-doped ice was chosen since it has a better ratio of strain modulus to flexural strength than has saline ice (Reference TimcoTimco 1979), and several of the existing experimental ice tanks are using this ice for their model tests.
In testing, the flexural strength of the ice was measured using a cantilever beam technique and the ice piece was immediately cut to size on a band saw for the compression test. In these tests, a standard-sized ice piece of 10.5 × 3.6 × 3.6 cm was used. This size was chosen since it gives a 3:1 aspect ratio column which, for the horizontal loading, has an ice thickness (3.6 cm) which is in the range commonly used in model tests of ice-structure interaction. In trimming the thickness, the cut was always made off the bottom of the ice sheet. It should be noted that since model ice is a two-layer system, the strength may depend upon the relative proportion of each layer to the total thickness of the ice. Two different test apparatuses were used to measure the compressive strengths at two different loading rates. Since model tests which involve an icebreaker crushing ice require a relatively high loading rate, a lever-type compression tester, operated with an instrument push-pull gauge, was used. This type of tester has been used by Reference TimcoTimco (1980) to document the compressive strength under a high loading rate of both carbamide-and saline-doped model ice over a limited range of scale factors, and by Nakajima and others (1981) in their model tests. For model tests of a slowly moving ice field interacting with a fixed structure, a much lower loading rate is required. For this, a screw-driven compression tester (Solltest CT-405) which had a capacity of 0.05 MN and was instrumented with a load cell, was used. The output of the load cell was recorded on an X-time recorder so that both the yield load and time to failure tf were obtained. The cross-head rate of the press was 4 × 10⁻² mm s_1 which gives a nominal strain-rate εn of 4 × 10⁻² s−1. For the Solltest press, three different platen materials were used: steel, masonite and bakélite. Of these three, only bakélite provided reliable results. With steel platens, the ice tended to melt when placed in contact with them, even when they were precooled. With masonite platens, the high friction between the ice and the platens influences the results substantially. The bakélite platens proved successful since they were essentially frictionless and, because bakélite is an insulator, the ice did not melt when placed in contact with them.
The results of the compression tests were related to the measured flexural strength of the ice. This was done because the scale factor of the model tests is usually defined in terms of the scaled flexural strength and thickness of the model ice. For this paper, the defined scale factor λ is based on a conservative prototype flexural strength »f» for freshwater ice of 800 kPa; i.e. λ = 800/af m, where of, m is flexural strength at the model scale.
3.1 Horizontal loading
For horizontal loading (i.e. loading perpendicular to the direction of growth of the ice) tests were performed at both loading rates. With regard to the strength of the ice, the results are presented in Figure 2. The uniaxial compressive strength is shown as a function of flexural strength and scale factor for both loading rates. In addition, the high loading-rate values of Reference TimcoTimco (1980) for carbamide ice and those of Síírensen (1978) and Reference Edwards and TrydeEdwards (1980) for saline ice are included. For the latter two, the loading rate is not known since no details of the test procedure were given. In the range of flexural strengths of 20 to 60 kPa (i.e. 40>λ>13) the compressive strength is relatively independent of flexural strength, whereas in the range of flexural strengths of 60 to 130 kPa (i.e. 13>λ>6) the compressive strength increases with increasing flexural strength. Over the range of flexural strengths from 40 to 130 kPa, the compressive strength is approximately twice the flexural strength. In general, the few published results of the compressive strength of saline model ice agree well with those of the carbamide ice.
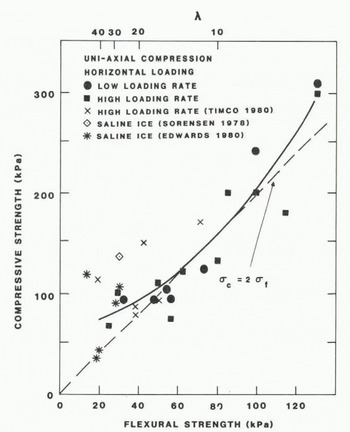
Fig. 2. Horizontally loaded compressive strength versus flexural strength and scale factor.
Within experimental accuracy, the compressive strength of the model ice is independent of the strain-rate in the range investigated. For both freshwater ice and sea ice in the ductile range, the strength is dependent on the strain-rate with a functional dependence of the type a = Aεn where A and n are empirically determined coefficients. Because of the independence of strain-rate for model ice, care must be taken in choosing an appropriate scale factor for the model test. For example, if the loads on an artificial island in a slowly moving ice field were being studied, the prototype strain-rate would be ε = v/2D where v is the rate of ice movement and D is the diameter of the island. For v = 2.4 m h−1 and D = 100 m, the strain-rate would be ε = 3.3 × 10⁻⁶ s−1. From uniaxial tests of the compressive strength of freshwater ice using a high-capacity closed-loop test machineFootnote * , α = 210(ε)0·34 (Reference SinhaSinha 1981) where α is in MPa and ε is in s−1. Thus, for ? = 3.3 × 10⁻⁶ s−1, αc, p = 2.9 MPa (note, αÇ, m is compressive strength at the prototype scale). Disregarding sample-size effects, for a model test at λ = 30 (say), αÇ, m = 97 kPa which is in good agreement with the experimentally measured value. As such, in a test of this type, both the flexural and compressive strengths would be scaled correctly. However, it should be borne in mind that since the strength is strain-rate dependent for “real” ice, but strain-rate independent for model ice, this correct scaling of both strengths will not always be possible. Therefore, an analysis such as this is required to check on the accuracy of the scaling of compressive strength. In many cases, such an analysis will define a unique λ at which both strengths are properly scaled.
From the load-time curves from the low strain-rate tests, the average loading stress-rate 5, can be determined as αa = αc/tf where αc is the compressive strength of the material and tf is the loading time to failure. The compressive strength is plotted versus the loading stress-rate for a constant strain-rate in Figure 3 Footnote ** In addition, the compressive with increasing stress-rate such that acM/ where ov is in MPa and 5, is in strength is plotted versus the yield modulus En = σa/εη (Reference SinhaSinha 1982). From this log-log graph, it is evident that the compressive strength increases = 3.1(αa) Analysis of tests on freshwater ice shows a similar power-law dependence of strength on stress-rate such that αc = 12(αa) 0.36 for freshwater ice (Reference SinhaSinha 1981) and αc = 5.2 (αa) 0·36 for sea ice (Frederking and Timco in press). Thus, these tests on model ice indicate that qualitatively the strength/stress-rate dependence of model ice is similar to prototype ice, but there is a stronger functional dependence for model ice.
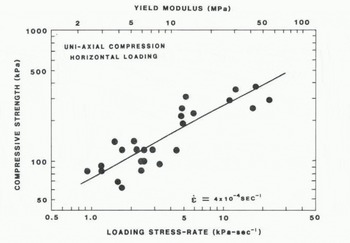
Fig. 3. Horizontally loaded compressive strength versus average loading stress rate and yield modulus.
With regard to the strain of the ice, no direct strain measurements were made. However, since the test machine is very much stiffer than the model ice, strain information can be inferred by assuming that the strain at yield εn in the ice is equal to the final product of the nominal strain-rate εη and the time to failure tf. The strain at yield and time to yield are shown versus the scale factor in Figure 4. This figure indicates that as the scale factor increases (i.e. the ice gets weaker) the strain at yield increases, such that, at the higher scale factors, there is considerable deformation in the ice before yield. Since strain is a dimensionless quantity, it should not depend on the scale factor. Rather, it should be the same for both prototype and model at any scale factor. The results of Figure 4 show that this is not the case. To see if the strain at yield at the low scale factors is in any sort of agreement with the strain at yield measurements on sea ice, a linear least-squares fit through the data was performed. Extrapolation of this fit to λ = 1 gives a strain at yield of 0.006 for model ice at that scale factor. Since the assumption made in determining the strain would tend to overestimate it, there is good agreement of this extrapolated value with the strain at yield measurements on sea ice (ε = 0.003 ± 0.001 (Frederking and Timco in press). This comparison indicates that at λ = 1, the strain behaviour of model ice is quantitatively similar to that of sea ice. However, as previously discussed, with increasing scale factor the strain behaviour of model ice becomes increasingly more incorrectly scaled. Overall, these tests indicate that although ice loads on structures can be well estimated in model tests, the amount of strain in the ice itself cannot.

Fig. 4. Strain at yield and time to yield versus scale factor for horizontally loaded uniaxial compression.
In viewing the tests, there were two different failure mechanisms evident. In many cases, there was cracking in the sample which accelerated as the load approached the yield point until a general coalescence of the cracks weakened the internal structure and failure occurred. This is the same type of failure observed in ductile failures for freshwater ice and sea ice. In other cases, however, as the load was increased, the upper layer (Fig.l: layer A) and lower lower layer (Fig.l: layer C) physically split apart. With increasing load, the upper layer would buckle and crack in the centre at right angles to the direction of the load. This failure mode is not observed in smal1-sample tests on freshwater ice or sea ice. Clearly, the structure of the ice controls the failure behaviour of the ice.
3.2 Vertical loading
For vertical loading (i.e. loading parallel to the direction of ice growth), tests were performed only at the higher loading rate. These tests were meant to simulate the crushing behaviour of ice vertically loaded by a model icebreaker. The results of the tests are shown in Figure 5. This figure shows the vertically-loaded compressive strength as a function of flexural strength and scale factor. Included on this figure are the previous tests by Reference TimcoTimco (1980) on carbamide ice over a limited range of conditions, and the results of Søfrensen (1978) on saline ice. In general, the compressive strength increases with increasing flexural strength (decreasing scale factor) such that it is approximately 4.5 times the flexural strength. In comparing the vertically and horizontally loaded compressive strengths, it can be seen that for the lower scale factors (λ<20) the vertically loaded compressive strength is approximately 2.3 times higher than the corresponding horizontally loaded strength. This is in good agreement with the results for sea ice. For the higher scale factors, the vertically loaded strength approaches that of the horizontally loaded strength; i.e. the ice becomes isotropic with respect to compressive strength.
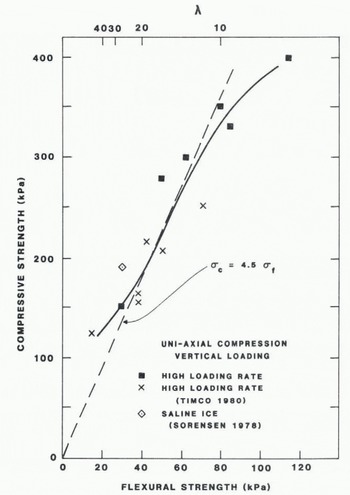
Fig. 5. Vertically loaded compressive strength versus flexural strength and scale factor.
4. Plane-Strain Compression
When ice interacts with a structure, it can experience a complex stress field. As such, information on the behaviour of ice under multi-axial loading is important. To date, tests of the plane-strain strength have been performed on freshwater ice by Croasdale and others (1977) and Reference FrederkingFrederking (1977), and on sea ice by Timco and Frederking (in press). In the present test series, the plane-strain compressive strength of model ice has been investigated over a range of scale factors for both Frederking type A and type B confinement conditions for one loading rate.
Plane strain has been defined as the condition where flow is everywhere parallel to a given plane and independent of position normal to the plane; i.e. there is no strain in one coordinate direction (Reference HillHill 1950). To approach this condition, a subpress was built with two parallel confining walls which restrict the ice déformation in that direction. The inside of the subpress was lined with bakélite in order to reduce the friction on the side walls. The ice samples were carefully cut to size on a band saw so that there was a tight fit in the subpress (sample size 10.5 × 3.6 × 3.6 cm). The ice was then loaded using the Solltest press at the same rate as the uniaxial tests. For horizontal loading, confinement is possible on either the sides of the sample (A-type) or on the top and bottom of the sample (B-type). These confinement conditions are shown schematically in Figure 6.

Fig. 6. Schematic showing A-type and R-type confinement for plane-strain tests.
The results of the tests are presented in Figure 7, which shows the plane-strain compressive strength versus the flexural strength of the ice and the scale factor. It is evident that the plane-strain strength increases with increasing flexural strength (i.e. decreasing scale factor). In addition there is a general trend for the A-type strength to be greater than the B-type strength which is greater than the uniaxial strength of the ice. The results of tests of this type on columnar freshwater ice and sea ice have shown that the A-type strength is generally two to five times greater than either the B-type or uniaxial strengths, and that in general, the B-type and uniaxial strengths are comparable. This occurs because the predominant direction of failure for horizontal loading is in the plane of the ice cover. The A-type confinement restricts this deformation and results in significantly greater strengths (see Reference FrederkingFrederking (1977) for more detail). For model ice, a similar predominant failure direction is in the plane of the ice cover (i.e. the crack coalescence failure). As such, the side constraint of the A-type test inhibits this deformation and results in greater strengths. In most cases in the A-type test, the ice failed by separation and buckling of the two layers of the ice (i.e. the splitting failure). For the 6-type tests, this splitting failure mode is prevented and the ice fails with a crack coalescence-type failure. The trend shown in Figure 7 in which (α(A)>α(B)>α(uniaxial) suggests that although this latter failure mode is the predominant one, the failure of unconstrained samples is influenced by both fai1ure modes.
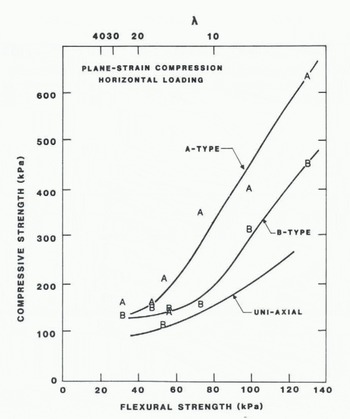
Fig. 7. Plane-strain compressive strength versus flexural strength and scale factor.
5. Acknowledgements
The author would like to thank R Frederking for the loan of the Solltest press. The technical assistance of A K Dewar is gratefully appreciated.


