


INTRODUCTION
Many global and regional climate models (GCMs/RCMs) are now available to study the evolution of the climate system including the impacts of climate change on the cryosphere. When coupled with state-of-the-art land surface models, GCMs and RCMs form the most comprehensive tools used to simulate and project the climate on decadal to century timescales. The recent generation of climate models now strives to resolve more complex land surface processes as computational power increases. To do so, their land surface schemes often parameterize subgrid-scale processes for more representative simulations of land surface processes including snowpack evolution and its contribution to runoff generation (Prein and others, Reference Prein2015; Zhao and Li, Reference Zhao and Li2015; Kauffeldt and others, Reference Kauffeldt, Wetterhall, Peppenberger, Salamon and Thielen2016). This is especially important in western North America (among other regions worldwide) where snowpacks form the largest component of seasonal water storage (Cayan, Reference Cayan1996; Barnett and others, Reference Barnett, Adam and Lettenmaier2005; Hamlet and others, Reference Hamlet, Mote, Clark and Lettenmaier2005; Lapp and others, Reference Lapp, Byrne, Townshend and Kienzle2005; Mote and others, Reference Mote, Hamlet, Clark and Lettenmaier2005; Mote, Reference Mote2006; Kang and others, Reference Kang, Gao, Shi and Déry2014, Reference Kang, Gao, Shi, Islam and Déry2016). Snow also influences the surface energy fluxes, radiative budgets and hydrologic conditions during the winter accumulation and spring ablation seasons (Cayan, Reference Cayan1996; Brown, Reference Brown2000; Leung and Qian, Reference Leung and Qian2003; Pan and others, Reference Pan2003; Hernández-Henríquez and others, Reference Hernández-Henríquez, Déry and Derksen2015).
Snow depth and SWE are two key variables quantifying the seasonal snowpack and its potential contribution to snowmelt runoff and flooding (Mote and others, Reference Mote, Grundstein, Leathers and Robinson2003). Accurate simulations of snow depth, SWE and snowmelt runoff, among other hydrologic variables, rely on realistic estimates of the amount and timing of snowfall, the overall surface energy and radiative balances, and other snow-related processes. Due to the high temporal and spatial variability of snow, it is important to incorporate subgrid-scale representations of snow-related processes and properties in models (Liston, Reference Liston2004). Advancements in simulating subgrid complexity in snow evolved through the parameterization of such factors as snow redistribution by wind (Déry and Yau, Reference Déry and Yau2002; Gordon and others, Reference Gordon, Simon and Taylor2006), snow–vegetation interactions (e.g. Bartlett and Verseghy, Reference Bartlett and Verseghy2015), snow-specific surface area (Roy and others, Reference Roy, Royer, Montpetit, Bartlett and Langlois2013), snow-cover fraction and non-uniform snow distribution (Liston, Reference Liston2004; Nitta and others, Reference Nitta2014), and topography (slope, aspect, elevation) (Déry and others, Reference Déry, Crow, Stieglitz and Wood2004). The validity of including one parameterization over another depends on the grid scale and location of analysis. For example, blowing snow processes only contribute significantly to snow distribution at small spatial scales in regions such as Arctic and alpine tundra, ice sheets and ice shelves, prairies and steppes (Déry and Yau, Reference Déry and Yau2001; Gordon and others, Reference Gordon, Simon and Taylor2006; Lenaerts and others, Reference Lenaerts2010, Reference Lenaerts, van den Broeke, van Angelen, van Meijgaard and Déry2012). Despite recent subgrid-scale snow (SSS) developments, inaccuracies related to the simulation of snowpack evolution persist (e.g. Liston, Reference Liston2004; Roy and others, Reference Roy, Royer, Montpetit, Bartlett and Langlois2013). Further analyses of subgrid variations on the topographic control of air temperatures and incoming solar radiation with impacts on snow evolution are thus warranted, particularly when considering the positive snow-albedo feedback on climate change in high latitude and altitude regions (Hernández-Henríquez and others, Reference Hernández-Henríquez, Déry and Derksen2015; Wang and others, Reference Wang, Fan and Wang2016).
Recent increases in air temperature have been observed in many of the world's mountainous regions (Pepin and Lundquist, Reference Pepin and Lundquist2008; Ohmura, Reference Ohmura2012; Sharma and Déry, Reference Sharma and Déry2016). This induces modifications to winter and spring snowpack levels, in turn leading to shifts in seasonal streamflow and a reduction in summer flows (Dettinger and Cayan, Reference Dettinger and Cayan1995; Arnell, Reference Arnell2003; Déry and others, Reference Déry, Stadnyk, MacDonald and Gauli-Sharma2016; Kang and others, Reference Kang, Gao, Shi, Islam and Déry2016). Thus, altitude emerges as an important variable to consider since air temperature trends are most sensitive at snow lines (Jefferson, Reference Jefferson2011; Wi and others, Reference Wi2012; Pepin and others, Reference Pepin2015). High elevations may thus respond more strongly to global and regional warming trends than their lower counterparts (Liu and Chen, Reference Liu and Chen2000; Diaz and Eischeid, Reference Diaz and Eischeid2007; Liu and others, Reference Liu, Cheng, Yan and Yin2009; Pepin and others, Reference Pepin2015).
This paper's main objective is to develop a strategy for a subgrid-scale parameterization for a land surface model with consideration of the effects of elevation, slope and aspect on snow evolution in an idealized model setting. Observational data from a meteorological station over 1 year are utilized to force and evaluate the model. Air temperatures are first adjusted with the moist adiabatic lapse rate (MALR) for a range of elevations. Then incoming direct-beam shortwave radiation is modified according to varying slope angles and aspect quadrants to test model sensitivity of snowpack simulations for these new exposures. Finally, the spatio-temporal evolution of SWE at ~75 m resolution considering the combined effects of elevation, slope and aspect yields insights on the dominant topographic controls on snow evolution at the scale of an RCM grid cell. As such, this sensitivity study provides guidance in the development of an SSS parameterization for future implementation into the land surface scheme of the Canadian Regional Climate Model (CRCM) for improved climate simulations and projections of western North America's snow-dominated, mountainous watersheds (Poitras and others, Reference Poitras, Sushama, Seglenieks, Khaliq and Soulis2011; Šeparović and others, Reference Šeparović2013).
MODEL, DATA AND METHODS
Canadian Land Surface Scheme (CLASS)
This study uses the current operational version of the CLASS, version 3.6, which is the standard land surface model for the CRCM (Verseghy, Reference Verseghy1991, Reference Verseghy2012; Verseghy and others, Reference Verseghy, McFarlane and Lazare1993; Šeparović and others, Reference Šeparović2013). CLASS 3.6, a second-generation land surface model (Pitman, Reference Pitman2003), provides physically based energy, momentum and water exchanges between the land surface, a vegetation canopy and the atmosphere. It represents explicitly four vegetation types: needleleaf trees, broadleaf trees, crops and grasses. The soil column is discretized into three standard layers: 0.10, 0.35 and 4.10 m. Additional deeper layers in the multi-layered configuration can also be specified by the user (Verseghy, Reference Verseghy1991; Ganji and others, Reference Ganji, Sushama, Verseghy and Harvey2017). Soil temperatures vary over time following a one-dimensional heat conduction equation with heat capacities and thermal conductivities dependent on liquid and frozen soil moisture contents and soil texture (Langlois and others, Reference Langlois2014). Heat conduction transfers rely on the quadratic relationship between soil temperatures and depth.
CLASS incorporates snow as a fourth variable-depth bulk ‘soil’ layer with a thermal regime distinct from the underlying soil. It resolves snow density for fresh snow based on empirical functions involving air temperature (Hedstrom and Pomeroy, Reference Hedstrom and Pomeroy1998). Following deposition, snow density increases exponentially with time to a maximum possible value depending on snowpack depth for compaction (Brown and others, Reference Brown, Bartlett, MacKay and Verseghy2006). Thermal conductivity is derived from an empirical function of snowpack density (Sturm and others, Reference Sturm, Holmgren, Konig and Morris1997). Snowpack temperature variation with depth is solved from a quadratic equation, while a linear equation relates the surface heat flux to the snowpack temperature gradient. As such, snow temperature constitutes a prognostic variable that is computed through the same quadratic equation for soils and is resolved iteratively from the surface energy balance. Snow accumulates when surface air temperatures are below a threshold value T rs of 0 °C during periods of precipitation (although T rs can be modified and include mixed (solid and liquid) precipitation at warmer temperatures (Brown and others, Reference Brown, Bartlett, MacKay and Verseghy2006)). Implementation of T rs is usually not required when CLASS is coupled to an atmospheric model such as the CRCM that then supplies amounts for each phase of the precipitation. Snowmelt occurs when the snow surface or bulk snow layer temperature reaches 0 °C. In this case, the melting of the snowpack occurs partially or completely through the excess energy and snow temperature is reset to 0 °C. Snowpacks retain liquid water up to 4% (of snowpack weight) prior to drainage. While this approach is consistent with some land surface schemes (e.g. Noah; Niu and others, Reference Niu2011), others (e.g. the Interaction Soil Biosphere Atmosphere (ISBA) model (Noilhan and Mahfouf, Reference Noilhan and Mahfouf1996), the European Centre for Medium-Range Weather Forecasts (ECMWF) land surface model (Viterbo and Beljaars, Reference Viterbo and Beljaars1995) and the Versatile Integrator of Surface and Atmosphere (VISA) processes model (Yang and Niu, Reference Yang and Niu2003)) parameterize the maximum liquid water retention capacity as a function of density, with increased water retention capacity as snow densifies. Snow meltwater can also refreeze (causing the snow density to increase). This process continues until the entire snowpack becomes isothermal. Thereafter meltwater may pond on the surface and eventually infiltrate or contribute to surface runoff.
Albedo, an important parameter for assessing slope and aspect effects on snow, is modeled in CLASS using empirical exponential decay functions. If the amount of new snowfall at a given time step ⩾0.1 mm, the snow albedo is set to the fresh snow value of 0.84. The background albedo value for old snow (if the melt rate is non-negligible or the snowpack temperature exceeds −0.01 °C) and for new snowfall on bare ground is 0.50. CLASS integrations typically operate on time steps of ⩽30 min as longer values may induce numerical instabilities (Verseghy, Reference Verseghy2012). Verseghy (Reference Verseghy1991), Bartlett and others (Reference Bartlett, MacKay and Verseghy2006), Music and others (Reference Music2009), Marsh and others (Reference Marsh, Bartlett, MacKay, Pohl and Lantz2010), Bartlett and Verseghy (Reference Bartlett and Verseghy2015), Verseghy and others (Reference Verseghy, Brown and Wang2017) and Ganji and others (Reference Ganji, Sushama, Verseghy and Harvey2017) provide further details on the CLASS model structure, its operation, evaluation and recent improvements.
Study area and forcing data
The University of Northern British Columbia's Quesnel River Research Centre (QRRC) is the site of a meteorological station and is part of the Cariboo Alpine Mesonet climate network (CAMnet; Déry and others, Reference Déry, Clifton, MacLeod and Beedle2010). The QRRC site resides in Likely, British Columbia (BC), Canada on the western perimeter of the Cariboo Mountain chain at 744 m a.s.l. with coordinates 52°37′60″ N and 121°35′24″ W. The Cariboo Mountains span 44 150 km2 between BC's Interior Plateau and the Rocky Mountain Trench, forming the northern extension of the Columbia Mountains (Sharma and Déry, Reference Sharma and Déry2016). The region observes strong orographic forcing owing to the natural obstruction of moisture transport from the Pacific Ocean. Its climate is wetter compared to the Rocky Mountains to the east and the Interior Plateau to the west with annual precipitation ranging from 500 mm in the town of Quesnel up to 2500 mm along the spine of the Cariboo Mountains (Burford and others, Reference Burford, Déry and Holmes2009; Sharma and Déry, Reference Sharma and Déry2016). More than half of the precipitation falls as snow leading to heavy snowpacks that reach peak accumulations of ~900 mm SWE at treeline (Déry and others, Reference Déry, Knudsvig, Hernández-Henríquez and Coxson2014). Above treeline (>1700 m), vegetation in the Cariboo Mountains comprises alpine meadows, mosses and lichens, while at mid altitudes, lodgepole pine (with most mature trees decimated by a recent mountain pine beetle outbreak), Engelmann spruce and subalpine fir abound. Valley bottoms are the setting of a unique inland temperate rainforest (ITR) dominated by old-growth red cedars and hemlocks (Sharma and Déry, Reference Sharma and Déry2016). While the QRRC resides in the ITR along the north-facing wall of the Quesnel River Valley, the weather station itself remains in an open, flat clearing with short grass as vegetation cover.
CLASS uses seven variables as meteorological forcing, all of which are available at 15 min intervals over 1 July 2008 to 30 June 2009 from QRRC meteorological station values: incoming long and shortwave radiation, 2 m air temperature and relative humidity (with respect to water), 10 m wind speed, atmospheric pressure and precipitation. A heated tipping bucket gauge protected by an Alter shield quantifies precipitation amounts but without discriminating snowfall from rainfall. These measurements are not modified for gauge undercatch given the phase of the precipitation remains unknown (near T rs = 0 °C) and winds remain light at the QRRC (see Meteorological forcing for and preliminary tests with CLASS section). A standard anemometer records 10 m wind speed and direction, while a radiometer measures the incoming solar and infrared radiation and an ultrasonic sensor gauges snow depth, which is used only for validation purposes. Details of all sensors at this weather station are available in MacLeod and Déry (Reference MacLeod and Déry2007) and Déry and others (Reference Déry, Clifton, MacLeod and Beedle2010). CLASS requires the reference height of air temperature and wind speed measurements to be higher than the vegetation height. This is especially important where canopies exist with heights >20 m. For stations with bare soil or short grass vegetation types (e.g. QRRC), the air temperature and wind reference heights are 2 and 10 m above ground, respectively, sufficiently above the maximum vegetation height.
Given the high frequency of data availability, CLASS is forced at 15 min time intervals with simulation output at the same frequency in addition to daily averages or totals. While air temperature and incoming shortwave radiation are modified to account for subgrid-scale topographic effects, all other CLASS forcing variables remain unchanged (see CLASS simulations section). Analyses focus on CLASS-simulated snow depth and SWE owing to their importance to BC's hydrological cycle. Peak SWE results are analyzed as a measure of total seasonal accumulation, which typically occurs annually between mid-April to mid-May in the study area (Déry and others, Reference Déry, Knudsvig, Hernández-Henríquez and Coxson2014). Prior to comparisons with CLASS output, the observed snow depths recorded by the ultrasonic ranger are adjusted for a 20 cm positive bias that appears in its original time series. This bias correction is supported by the lack of subfreezing precipitation and low shortwave albedo values in early fall 2008. The source of this positive bias in the original snow depth data may arise from vegetation at the site (grasses) and/or an incorrect value for the distance to target in the data logger code.
Incorporation of elevation bands
Partitioning of the land surface into ten different elevation bands centers on the QRRC's altitude of 744 m, hereafter referred to as the ‘mean elevation’. The ten elevation bands, all with the same areal weighting of 0.1, are distributed into 100 m vertical increments from 244 to 1244 m excluding 744 m (Arola and Lettenmaier, Reference Arola and Lettenmaier1996). The 15 min observed air temperature data from the QRRC meteorological station are then modified for each elevation band using the MALR, taken as 6.4 °C km−1 (Whiteman, Reference Whiteman2000; Marshall and others, Reference Marshall, Sharp, Burgess and Anslow2006), with additional sensitivity tests to other lapse rate values (see CLASS simulations section).
Incorporation of slope angles and aspect ratios
The observed incoming shortwave radiation (K↓, W m−2) data are first partitioned into direct-beam (I b, W m−2) and diffuse (D, W m−2) components using (DeWalle and Rango, Reference DeWalle and Rango2008):
 $$\displaystyle{D \over {K\!\! \downarrow}} = 1 - 1.2\left( {\displaystyle{{K\!\!\downarrow} \over {I_{\rm q}}}} \right) + 0.13\left( {\displaystyle{{K \!\!\downarrow} \over {I_{\rm q}}}} \right)^2,$$
where I q (W m−2) is the calculated potential incoming solar radiation. From Eqn (1), we then set I b = K↓ − D, which is then modified to account for different slope angles and aspects. Five slope angles of 10°, 20°, 30°, 40° and 50° are prescribed to idealized surfaces, in combination with four different aspect quadrants: north (N), east (E), south (S) and west (W) for each of those slope angles, for a total of 20 different slope/aspect combinations. Inclusion of topographic effects on I b follows Li and Lam (Reference Li and Lam2007):
 $${\rm \;} I_{{\rm bs}} = \left( {\displaystyle{{I_{\rm b}} \over {\sin (\alpha )}}} \right)(\sin (\alpha )\cos (\beta ) + {\rm cos}(\alpha )\sin (\beta )\cos \left \vert {\gamma - \gamma _{\rm n}} \right \vert ).$$
Here, I bs (W m−2) represents the adjusted incoming direct-beam shortwave radiation for a sloped surface, α denotes the solar elevation angle (radians), β is the slope angle (radians), γ denotes the solar azimuth (radians) and γ n = 0, π/2, π and 3π/2 for north-, east-, south- and west-facing slopes, respectively (Li and Lam, Reference Li and Lam2007). Thereafter, I bs and D are summed to provide K↓ s, the total incoming solar radiation on a sloped surface as the forcing data in the CLASS simulations.
CLASS simulations
Four sets of CLASS offline simulations in idealized settings are performed to explore the impacts of topographic variations on snow evolution at the QRRC over 1 July 2008 to 30 June 2009. First, CLASS is run over the study period for a horizontal surface at the mean elevation without adjustment of the meteorological forcing data and this baseline simulation is evaluated with mean daily snow depth observations (as SWE observations are unavailable). Sensitivity tests to the T rs parameter are also performed. Next, CLASS is operated for ten elevation bands with air temperatures adjusted by the MALR while all other forcing variables remain unchanged. Two additional simulations are run with the lapse rates set to 4.4 and 8.4 °C km−1 to test the CLASS model sensitivity to this parameter with the focus on peak seasonal SWE accumulation. In the third set of simulations, CLASS incorporates 20 different slope and aspect combinations whereby observed incoming direct-beam solar radiation is modified following Eqn (2) while all other input variables remain unmodified. Then results for snow depth and SWE averaged either over all ten elevation bands (referred to as the ‘mean of all remaining elevations’ or MAREs) or 20 slopes/aspects (referred to as the ‘mean of all slopes’ or MASs) are compared with those from the baseline simulation.
In the final set of CLASS simulations, the effects of elevation as well as slope angle and orientation are both considered. Here the simulation domain spans an area of 7.8 km × 10.3 km encompassing the QRRC. The Shuttle Radar Topography Mission (SRTM) 3 arc second (56.2 m longitudinally and 92.7 m latitudinally) resolution digital elevation model (DEM; Jarvis and others, Reference Jarvis, Reuter, Nelson and Guevara2008) provides grid-scale elevation, from which slope and aspect ratios are retrieved for 15 429 points. Then we partition the DEM data according to seven 100 m elevation bins (centered on 644, 744, 844, 944, 1044, 1144 and 1244 m), five 10° slope angle ranges (centered on 5°, 15°, 25°, 35° and 45°) and four aspect quadrants (N, E, S and W) for a total of 140 topographic combinations. Cells with a 0° slope are assumed to represent flat, open water surfaces (e.g. Quesnel Lake and River; see Déry and others, Reference Déry, Clifton, MacLeod and Beedle2010 or Petticrew and others, Reference Petticrew2015) and are excluded from the simulations. We then run CLASS adjusting the observed air temperature and incoming solar radiation for each of the 140 topographic exposures and track the biweekly evolution of SWE for each grid cell in the 80.4 km2 domain during spring 2009.
The time step for all model integrations is 15 min and a 1-year spin-up period is applied whereby the meteorological data are used recursively to ensure prognostic soil variables approach equilibrium prior to analysis. The surface at the QRRC is taken as 100% covered by grasses, and the corresponding grassland surface parameters for CLASS are prescribed in all simulations (Table 1).
Table 1. Surface parameters used in the CLASS simulations
RESULTS
Meteorological forcing for and preliminary tests with CLASS
Daily averages or totals of seven meteorological variables driving CLASS show the evolution of atmospheric conditions at the QRRC during 1 July 2008 to 30 June 2009 (Fig. 1). Meteorological conditions exhibit a seasonal pattern typical for western Canada, with high air temperatures in summer, followed by a cooling trend in autumn with the coldest conditions in winter (December and January). Air temperatures then rise in late winter and spring to exceed consistently 0 °C on 3 April onward. Precipitation shows no particular seasonal pattern although more intense events arise with the passage of synoptic storms in December and January. Incoming solar radiation follows the expected annual cycle with minimal values during winter. The 10 m mean daily wind speeds remain light (0.4 m s−1 on average) and surpass 1 m s−1 only on eight occasions, in contrast to conditions in nearby alpine terrain (Déry and others, Reference Déry, Clifton, MacLeod and Beedle2010; Petticrew and others, Reference Petticrew2015). These quiescent conditions suggest that gauge undercatch and blowing snow have minimal impact on the observed precipitation and snow depth accumulation, respectively. For the study period overall, the QRRC average air temperature and total precipitation are 3.2 °C and 652.3 mm, respectively, with more than half of the precipitation falling as snow (370 mm w.e.).
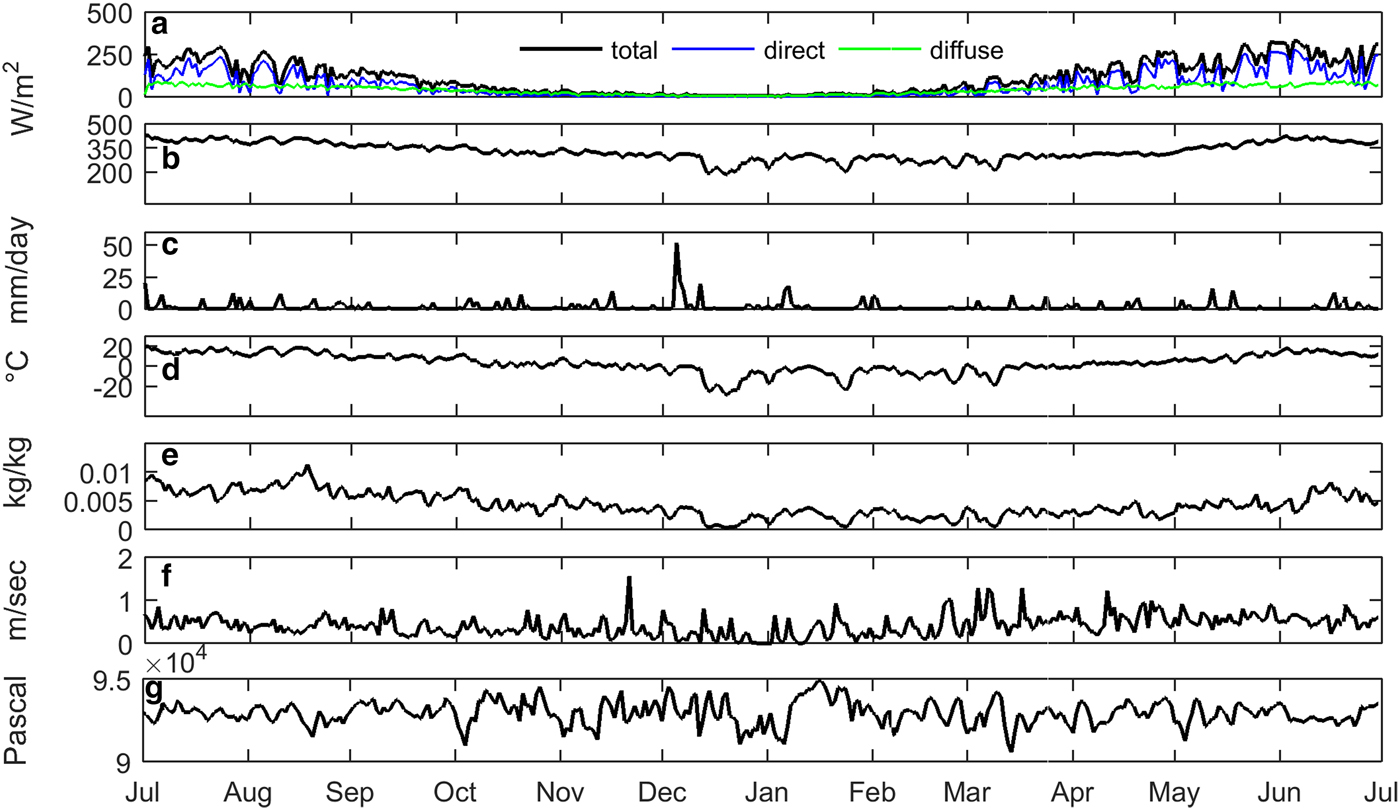
Fig. 1. Daily averages and precipitation totals of meteorological data from the QRRC station, 1 July 2008 to 30 June 2009. Shown are (a) incoming shortwave radiation partitioned as direct, diffuse and total, (b) incoming longwave radiation, (c) daily total precipitation, (d) 2 m air temperature, (e) 2 m specific humidity, (f) 10 m wind speed and (g) atmospheric pressure.
In response to the autumn cooling trend, snow begins to accumulate in November, with each storm passage yielding rapid rises in snow depth (Fig. 2). Following periods of accumulation, snow depth declines relatively slowly as the snow settles and compacts. Mean daily snow depth stabilizes at ~80 cm from early February until early April at the onset of melt. As air temperatures exceed the melting point, snowmelt proceeds quickly with complete ablation by early May.
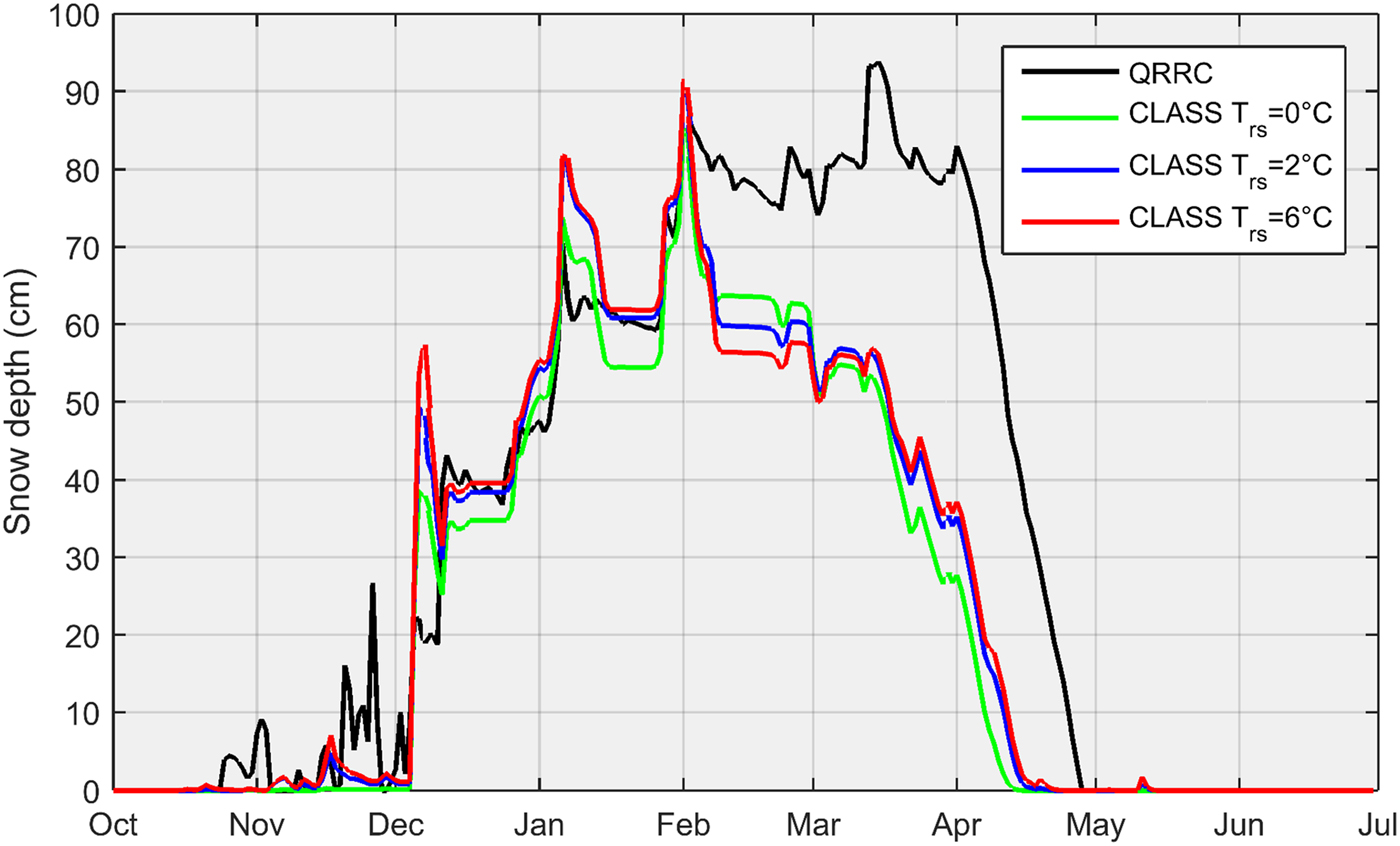
Fig. 2. Daily average snow depth simulated by CLASS with different values of T rs and observed at the QRRC meteorological station from 1 July 2008 to 30 June 2009.
While the simulated snow depth closely matches observations from November through January, thereafter CLASS underestimates snowpack depth compared to the QRRC observations, leading to early melting of snow. Thus, the CLASS threshold air temperature (T rs) partitioning precipitation into rainfall or snowfall was increased from 0 °C to preset temperature flags for rain of 2 and 6 °C but the snow simulations showed little improvement (Fig. 2). For example, the QRRC observed maximum daily snow depth of 94 cm occurred on 15 March 2009, while CLASS simulated peak daily snow depths of 86, 91 and 92 cm for T rs = 0, 2 and 6 °C, respectively, on 2 February 2009. Thus, as recommended by Brown and others (Reference Brown, Bartlett, MacKay and Verseghy2006), the original (unadjusted) precipitation data with T rs = 0 °C are used henceforth to run CLASS, and it is assumed that the model underestimates the snow depth and simulates an early melt at the QRRC (as reported for other locations; see Pomeroy and others, Reference Pomeroy1998; MacDonald and others, Reference MacDonald, Davison, Mekonnen and Pietroniro2016).
Effects of elevation
Snow depth and SWE simulated by CLASS forced by the QRRC data between 1 July 2008 and 30 June 2009 exhibit strong elevational dependence (Fig. 3). Indeed, snow depth and SWE increase as a function of elevation with maximum values at the highest elevations. A comparison between the QRRC (mean elevation) simulated snow depth and SWE with the MAREs reveals notable differences (Fig. 4). For example, the mean elevation maximum SWE equals 197.3 mm, whereas the corresponding value for the MAREs achieves 151.6 mm. Similarly, the maximum snow depth for the mean elevation attains 86.4 cm, while for the MAREs it reaches 58.4 cm. These differences persist throughout the year, from the accumulation to the ablation period, due to the inclusion of air temperature change at elevation in MARE values compared to the horizontal surface at the QRRC.
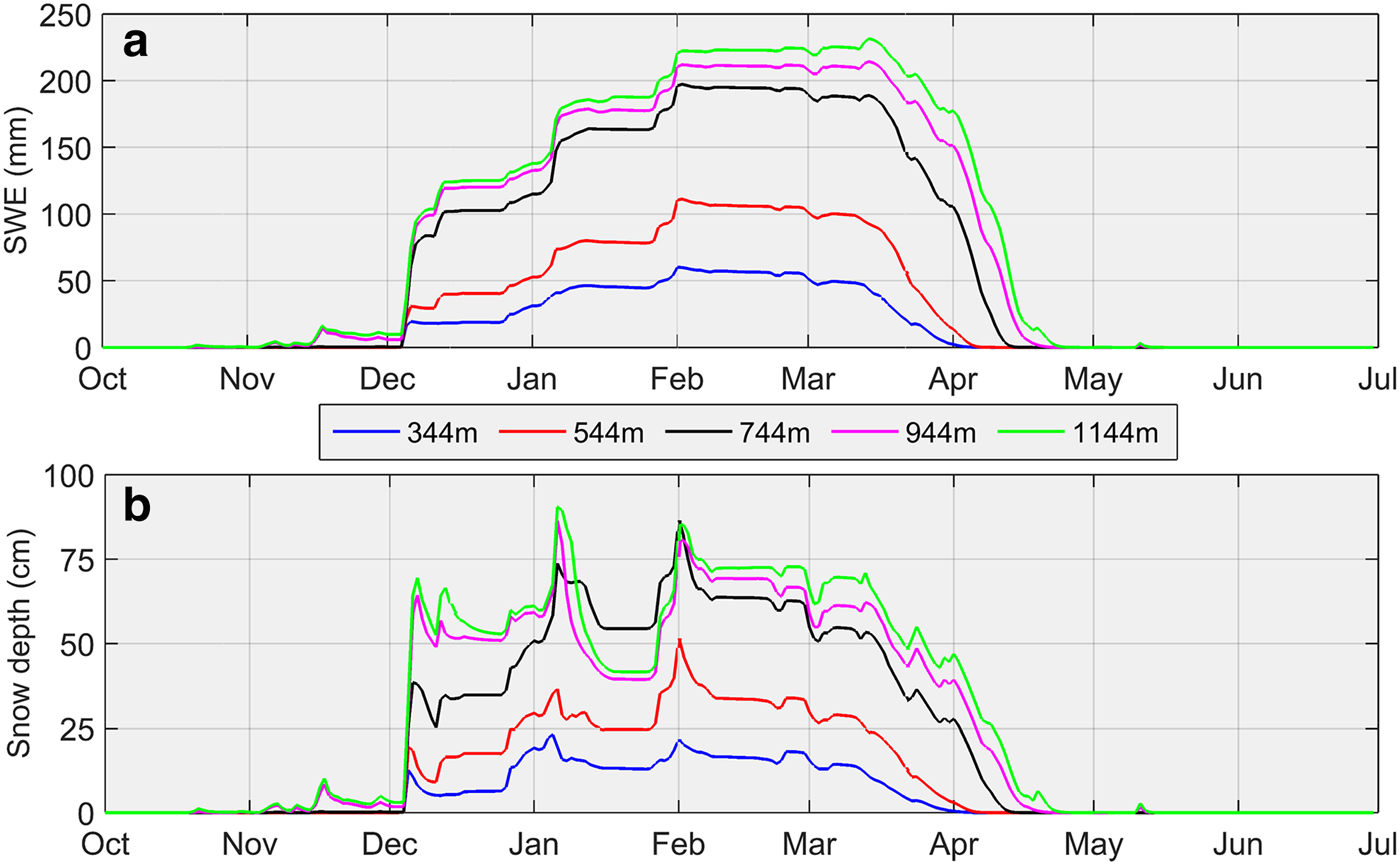
Fig. 3. Elevational dependence of average daily (a) SWE and (b) snow depth, simulated by CLASS from 1 July 2008 to 30 June 2009 when applying the moist adiabatic lapse rate (MALR).
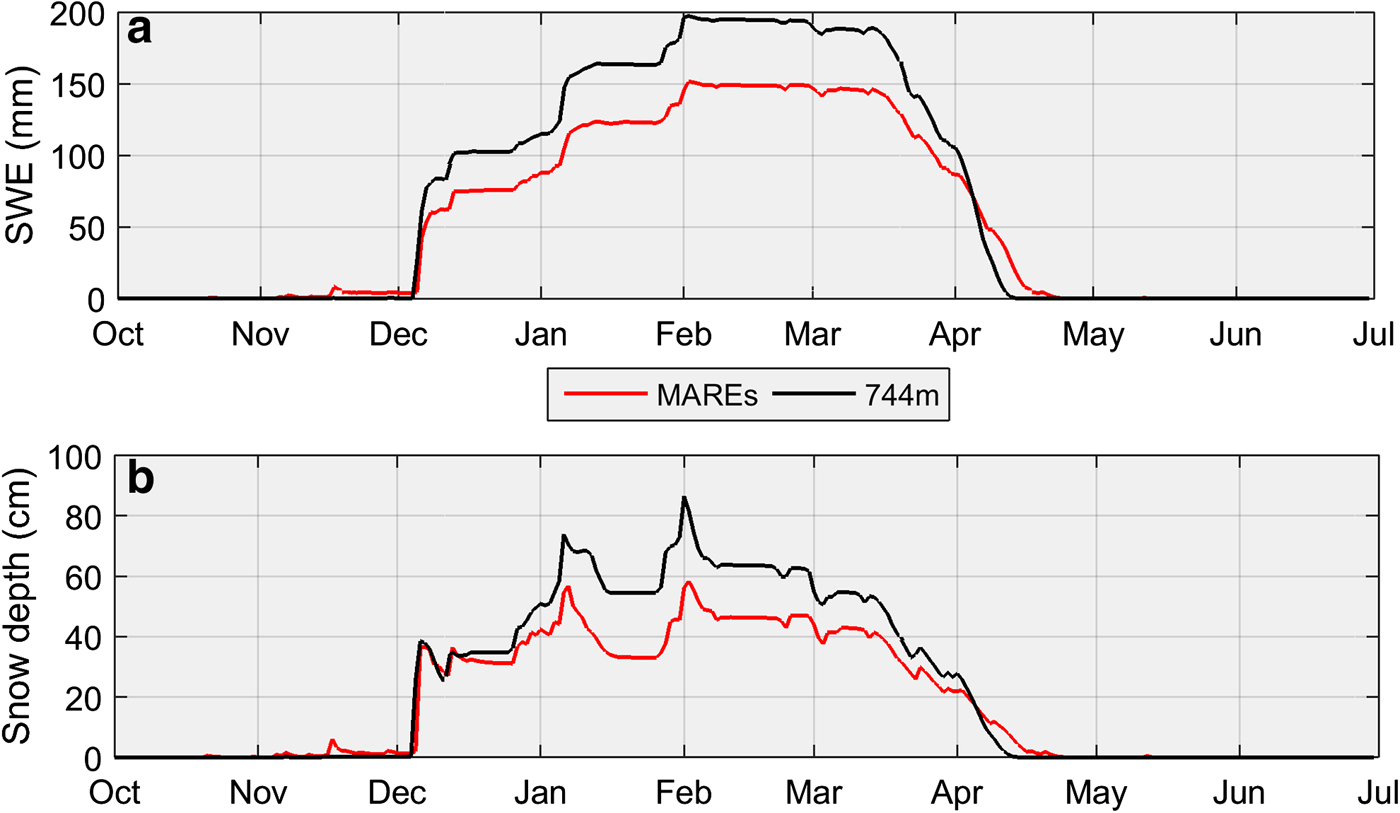
Fig. 4. Elevational dependence of average daily (a) SWE and (b) snow depth, comparing simulated CLASS results for the mean elevation (744 m) with the mean of all remaining elevations (MAREs), from 1 July 2008 to 30 June 2009.
Sensitivity tests to the prescribed lapse rates reveal stronger differences in the simulated maximum SWE at lower than mid or higher elevations (Fig. 5). The simulated snowpack is more sensitive to air temperatures at low elevations where wintertime precipitation phase and snowmelt remain important. At high elevations, the peak annual SWE shows relatively minor differences between the three lapse rates given that air temperatures remain ⩽0 °C throughout winter and the precipitation forcing unchanged from that at lower elevations. Thus, orographic enhancement of precipitation may be a more important factor controlling an elevation dependence in maximum SWE in regions where air temperatures remain subfreezing through the accumulation periods.
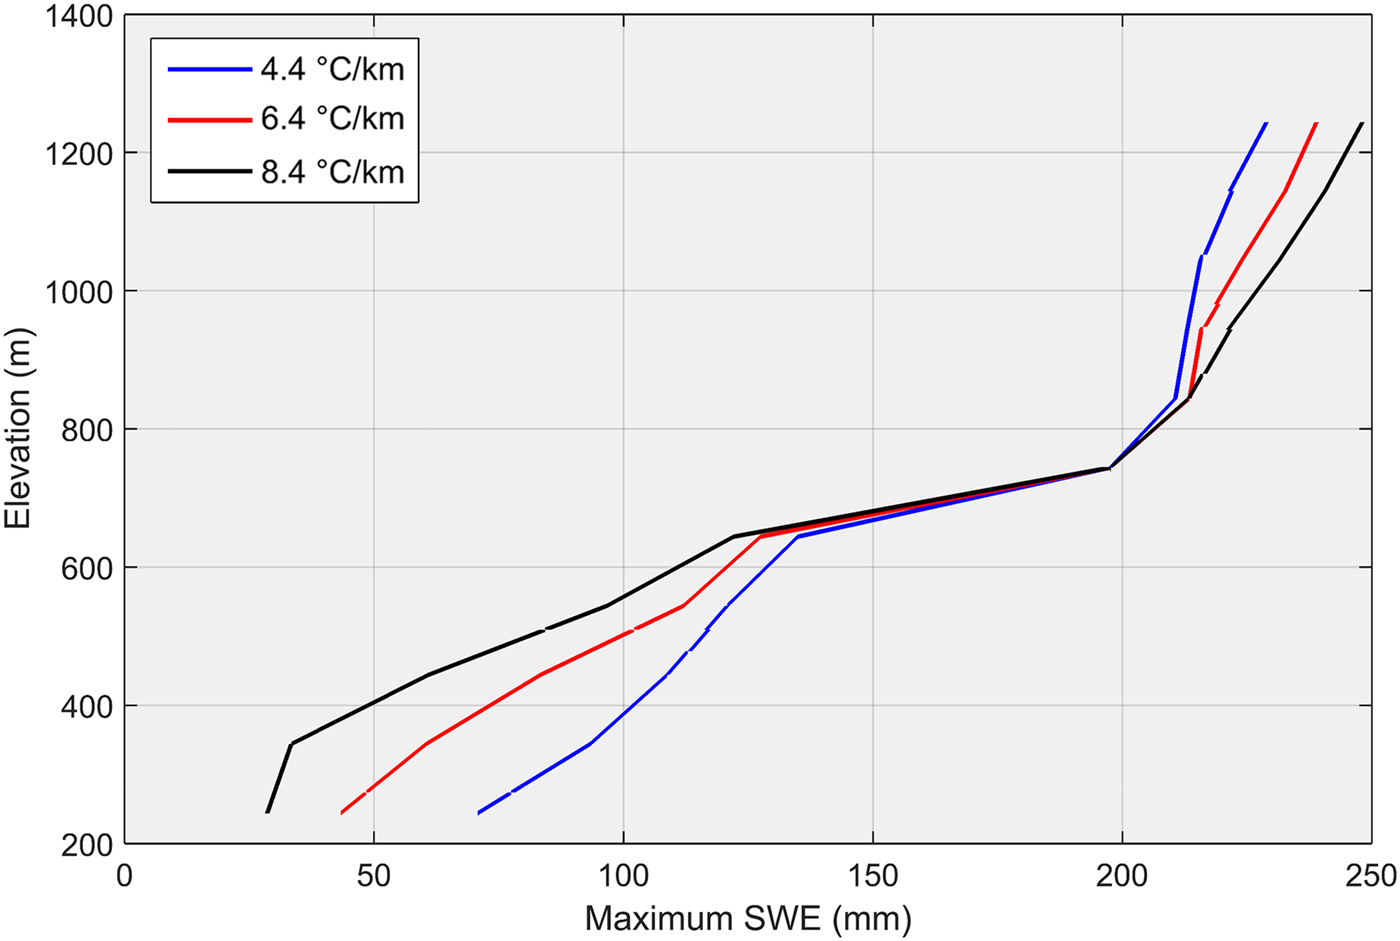
Fig. 5. Maximum SWE as a function of elevation for three different lapse rates simulated by CLASS during the winter of 2009.
Effects of slope and aspect
Table 2 and Fig. 6 report peak SWE accumulation values and their timing for different slopes and aspects relative to that for a horizontal surface at the QRRC. Peak SWE for the north-facing slope at 10° attains 198.9 mm on 2 February 2009, whereas for the south-facing slope, peak SWE reaches 195.9 mm on 2 February 2009. With slope angles increasing from 10° to 50°, peak SWE values on north-facing surfaces rise by 11.1 mm, while on south-facing surfaces, they decrease by 3.7 mm owing to altered incoming direct-beam solar radiation. For example, the daily mean shortwave radiation intercepted by a north-facing (south-facing) surface on 1 April at 10° and 50° slope angles attains 76.3 and 55.2 W m−2 (87.4 and 97.1 W m−2), respectively. Table 2 also presents the timing of complete snowmelt on different slopes and aspects. The date for complete snowmelt for the north- and south-facing 10° slopes is 19 April 2009 and 15 April 2009, respectively. With increasing slope angle, the north-facing slope melts more slowly (timing of complete melt for a 50° slope is 7 May 2009), whereas the south-facing surface melts earlier with increasing slope (timing of complete melt is 11 April 2009 for the 50° slope angle). Next for each aspect, the simulated SWE for a horizontal slope angle is compared to the mean SWE of the MASs to assess how simulations differ when using a sole mean slope angle versus a range of subgrid slope angles (Fig. 7). Averaging SWE simulated from different slopes influences the magnitude of peak SWE and the timing of snow disappearance, depending on aspect. This effect is greatest on north-facing slopes where energy input is lowest (Fig. 7a) but lesser on other aspects where energy input is higher (Figs 7b–d). Comparing mean SWE of all aspects for different slope angles to that for a horizontal surface demonstrates the effects of slope on the timing of snowmelt (Fig. 8). Increasing slope angles delay snowmelt, reinforcing the influence of north-facing slopes on idealized snowmelt simulations. Given the scant incoming solar radiation recorded at the QRRC (Fig. 1a), slope and aspect controls on snow evolution become significant only during the ablation period.
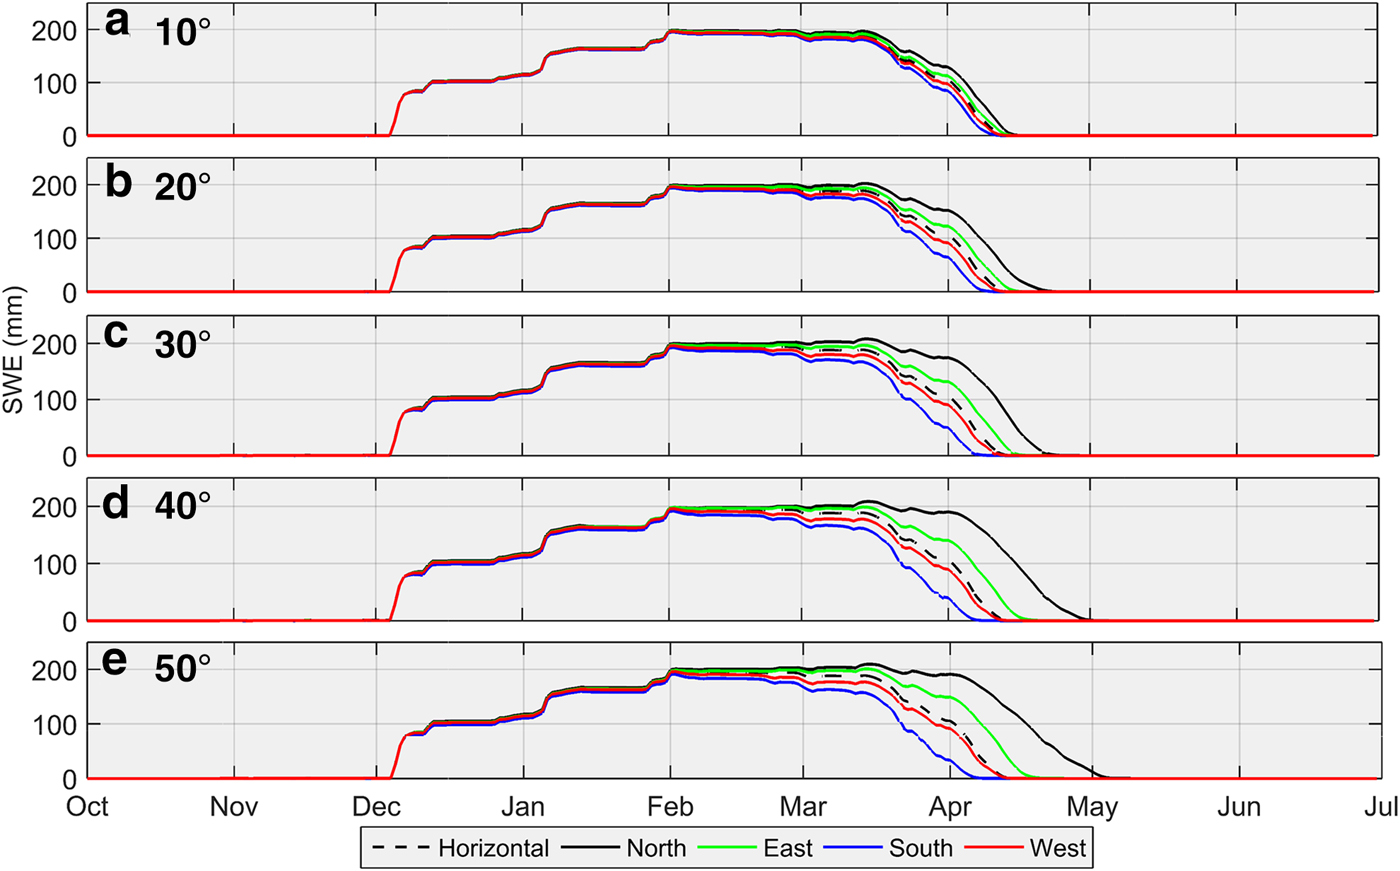
Fig. 6. Average daily SWE plots for five slope angles (10°, 20°, 30°, 40° and 50°) with SWE values plotted for comparison between aspects (horizontal, N, E, S, W), simulated by CLASS from 1 July 2008 to 30 June 2009. A similar pattern is seen for snow depth (not shown).
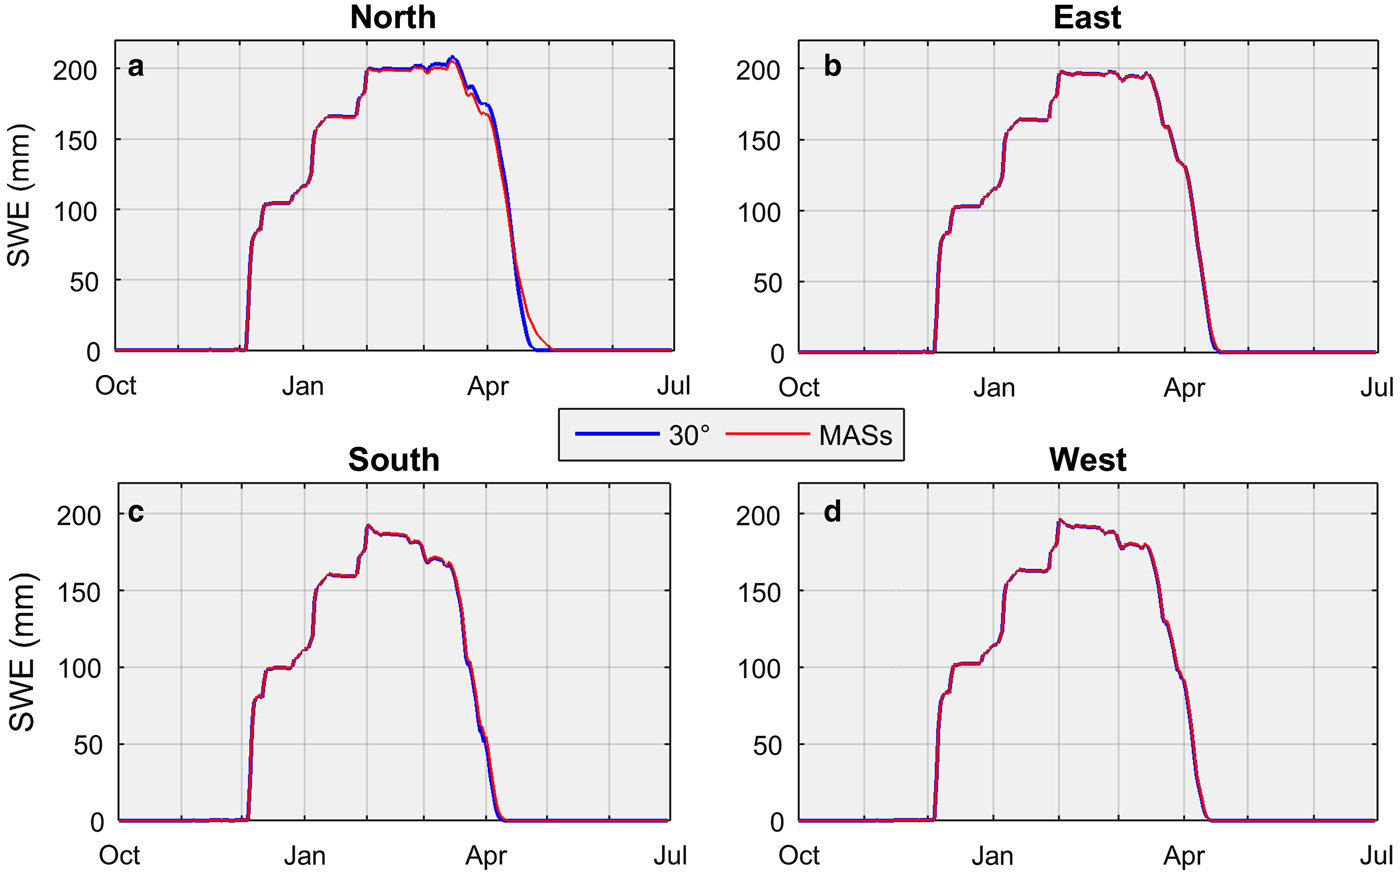
Fig. 7. Average daily SWE simulated by CLASS for a 30° slope angle compared with the mean of all slopes (MASs) for different aspects, 1 July 2008 to 30 June 2009. A similar pattern is seen for snow depth (not shown).
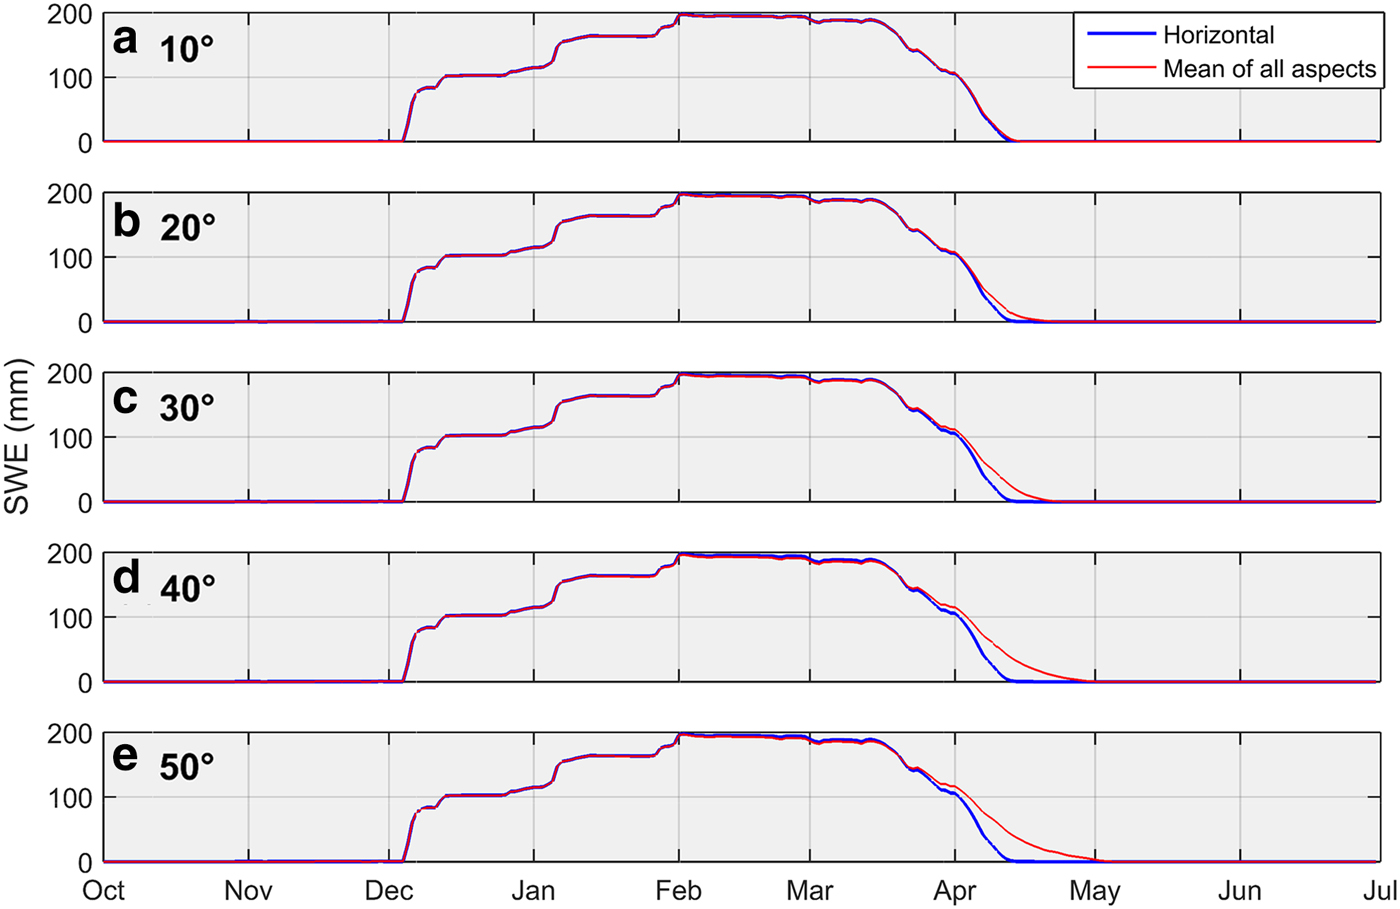
Fig. 8. Average daily SWE for a horizontal surface compared with the mean SWE of all four aspect quadrants plotted for five different slope angles (10°, 20°, 30°, 40° and 50°). SWE is simulated by CLASS from 1 July 2008 to 30 June 2009. A similar pattern is seen for snow depth (not shown).
Table 2. Peak SWE accumulation values (PV, mm), dates of peak accumulation (PD) and complete melt (CM) for different slope angles and aspects in 2009 as simulated by CLASS
Combined effects of elevation, slope and aspect
The final set of simulations incorporates the effects of elevation on air temperatures plus slope and aspect on incoming direct-beam solar radiation over an area of 80.4 km2, which approaches that in the current generation of RCMs. The area encompasses the QRRC in the valley of the Quesnel River, just to the west of its outlet from Quesnel Lake with higher elevations to its southwest (Fig. 9a). During spring 2009, topography has a dominant control on SWE with the most abundant accumulations at the highest elevations and the least amounts along the valley floor (Figs 9b–f). This pattern persists over time, but by April, the effects of slope and aspect emerge. For instance, on 15 April, areas on the north-facing slope along the Quesnel River Valley show higher SWE values than exposed areas just to the south at higher elevations (Fig. 9e). With the prolonged days in April, the snow ablates rapidly such that only bare ground or vegetation remains by the end of the month.
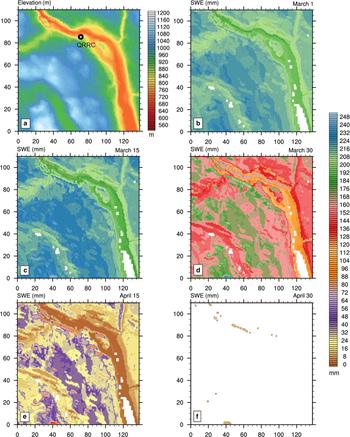
Fig. 9. (a) Topographic map of a 7.8 km × 10.3 km area encompassing the QRRC with elevations inferred from a 3 arc second resolution DEM. The CLASS simulated SWE considering elevation, slope and aspect on (b) 1 March, (c) 15 March, (d) 30 March, (e) 15 April and (f) 30 April 2009. Areas in white denote water surfaces or absence of snow.
SUMMARY AND CONCLUSIONS
This paper presents preliminary results on the development of a SSS parameterization for CLASS simulations to explore the effects of varying elevations, slopes and aspects on snow depth and SWE evolution in idealized settings. CLASS was first validated against observational data at the QRRC weather station in Likely, BC for the period 1 July 2008 to 30 June 2009, revealing negative biases in the simulated snowpack accumulation and an early onset of melt. In the next set of simulations, ten elevation bands 100 m apart vertically spanning 244–1244 m (excluding the mean elevation of 744 m) were implemented and observed air temperatures were modified using the MALR. Differences of 28 cm in peak snow depth and 45.7 mm in peak SWE emerged between the mean elevation versus the MAREs. In the subsequent CLASS simulations, the incoming direct-beam shortwave radiation was adjusted for slope angles ranging from 10° to 50° at 10° intervals on four different aspects (north, east, south and west) and results compared to those for a flat surface. Peak SWE values not only rose in magnitude (up to 11.1 mm increase) on north-facing slopes but their timing of occurrence was also delayed by nearly 3 weeks. Averaged simulated SWE for a combination of different tilt angles and aspects compared to values on a horizontal plane revealed the importance of subgrid-scale topography on peak accumulation and the timing of snowmelt, particularly for north-facing aspects. Finally, slope angles and aspect ratios were combined with elevation bands, based on topographic bins generated from a high-resolution DEM, to illustrate the spatio-temporal effects of complex topography on snowpack evolution at the subgrid scale of a typical RCM grid cell. Overall, these results revealed distinct trends in snow depth and SWE with elevation, indicating that elevation has more influence than slope and aspect angles when comparing spatial averages. Indeed, representing snowpacks using only mean (model grid cell) topographic characteristics masks the non-linear effects elevation, slope and aspect introduce in their evolution through time. As such, consideration of SSS effects in relatively coarse-scale climate models, particularly in regions of complex topography such as western North America, remains a priority for accurate simulations of basin-scale cryospheric and hydrologic processes.
Additional idealized simulations with the SSS parameterization in CLASS are being undertaken to further assess the robustness of the preliminary results reported here. CLASS experiments will be extended by several years to test the sensitivity of the simulated snowpack to interannual variations in climatic conditions. This will reveal whether subgrid topographic effects on snow evolution are more important in some years over others (or remain relatively constant over time) and the atmospheric controls on such variations (or lack thereof). Finally, CLASS model performance will be further explored by using SWE data from nearby snow pillow stations. This extended investigation will assist in demonstrating the importance of incorporating SSS effects within the coupled CRCM/CLASS framework, leading to an improved representation of snowpacks, snowmelt, and streamflow generation across the mountainous terrain of western North America.
ACKNOWLEDGEMENTS
Supported by the Natural Sciences and Engineering Research Council of Canada through the Canadian Network for Regional Climate and Weather Processes (CNRCWP) and the Canadian Sea Ice and Snow Evolution (CanSISE) Network. Thanks to Diana Verseghy and Paul Bartlett (Environment and Climate Change Canada) for sharing the CLASS code and support in its use, Shawn Marshall (University of Calgary), Laxmi Sushama, Katja Winger and Arman Ganji (UQAM), and Aseem Sharma and Michael Allchin (UNBC) for ongoing discussions and assistance with this work. Thanks to three anonymous reviewers and Dr Gerhard Krinner (Scientific Editor) for their highly constructive comments and guidance that led to a much improved paper.


 Open access