Introduction
The Antarctic ice sheet exerts a large influence on Earth's climate. On the local scale, there is a continual interaction among processes such as wind, radiation balance and temperature variations of the snow surface (Reference Schwerdtfeger and OrvigSchwerdtfeger, 1970, Reference Schwerdltfeger1984); in particular, the surface-energy balance and katabatic wind patterns are highly inter-related. The Antarctic ice sheet also contains a record of past climate which can be recovered through ice-core analysis. A broad spectrum of global, regional and local climate processes contribute to the ice-core paleoclimate record. The result can be a rich and varied climate resource to be exploited or a bewildering and uninterpretable muddle to be avoided, depending on the quality of the data and the physical understanding applied to the problem. Both the geochemical signal in the ice and the deep ice temperatures could be affected if spatial patterns of local climate differed in the past. Migration of an ice divide with an associated wind and temperature microclimate could cause such changes at an ice-core site. We present preliminary climate data and consider local climate processes that may influence interpretation of ice-core records from Taylor Dome (also sometimes called McMurdo Dome), Antarctica.
Taylor Dome
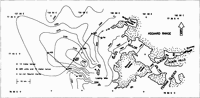
Taylor Dome is centered at 77°45'S, 159°00'E (Fig. 1), near the edge of the East Antarctic plateau and adjacent to the McMurdo Dry Valleys. It has topographic closure of about 100m and horizontal scale of 100km. It was first identified as a separate topographic feature by (Reference DrewryDrewry 1980, Reference Drewry and Craddock1982), who recognized that ice from Taylor Dome, rather than ice from the central East Antarctic plateau, was the source for glaciers that enter the Dry Valleys. Taylor Dome is expected to have a good geochemical paleoclimate record preserved in the ice, because the accumulation of approximately 0.1 m ice a-1 (Reference DrewnryDrewry, 1983) is higher there than at other domes in East Antarctica, and even the deepest ice is thought to originate locally. A geophysical, geochemical and stratigraphic research program was started in December 1990 to identify the characteristics of the local depositional environment and to select an ice-coring site (Reference Grootes, Steig and MasseyGrootes and others, 1991; Reference Waddington, Morse, Balise and FirestoncWaddington and others, 1991, Reference Waddington, Morse, Grootes, Steig and Peltier1993; Reference Grootes and SteigGrootes and Steig, 1992a; Reference Grootes, Steig and MasseyMorse and Waddington, 1992, in press). An ice core is scheduled to be drilled to bedrock in December 1993 at Taylor Dome.

Fig. 1 Taylor Dome, Antarctica, showing sites of 10 m firn-temperature measurements and Automatic Weather Stations (A WS). Note that the contour interval varies from 25 to 200 m.
Firn temperatures and the isotope thermometer
In regions of negligible summer melting, as found throughout most of the East Antarctic plateau, temperature measured at 10m depth in the firn is generally taken to be equal to the mean annual surface-air temperature (Reference Hooke, Le, Gould and Brzozowskie.g. Paterson, 1981, p. 188; Reference DrewnryHooke and others, 1983). Reference Fortuin and OerlemansFortuin and Oerlemans (1990) used a data set of several hundred 10m firn temperatures to show that mean annual surface temperatures at elevations above 1500 m on the East Antarctic plateau were controlled largely by altitude and latitude. We have measured 10m firn temperatures at several locations on Taylor Dome. Our temperature data show significant spatial variability in local climate unrelated to altitude. This is a concern because of the potential impact on the interpretation of the ice-core record.
The stable-isotope method (Reference Dansgaard, Johnsen, Clausen and GundestrupDansgaard and others, 1973; Reference Jouzel, Merlivat and LoriusPaterson and Hammer, 1987) is a primary tool for paleoclimate ice-core analyses. Under certain conditions which are often met in polar precipitation, variations in the stable-isotope ratios δ18O and δD in snow can be related to temperature variations at the place where the ice crystals formed from the vapor phase. We need to calibrate this isotope thermometer to derive the paleotemperature signal from an ice core. A linear relation of the form has been reported between isotopic values δ and temperature T (Reference Dansgaard, Johnsen, Clausen and GundestrupDansgaard and others, 1973; Reference KatoRobin, 1983). The constants a and b are determined from the isotope and temperature values in the area under study. Climate processes at all spatial scales can influence this calib-ration. Both T and δ must be measured and all physical processes influencing their values must be understood. Possible nontemperature- related influences on the isotopic signal δ have been described elsewhere (Reference Grootes and SteigKato, 1978; Reference Grootes and Steigjouzel and others, 1982; Reference Fortuin and Oerlemansjouzel and Merlivat, 1984; Reference Jouzel, Merlivat and LoriusPaterson and Hammer, 1987; Reference Grootes and SteigGrootes and Steig, 1992b); we address here the problem of determining representative temperatures T, and understanding how they are influenced by other local climate factors that may vary in both time and space.
Observations of 10m firn temperature
We measured temperatures at 10m depth in the firn at the eight locations indicated in Figure 1. Thermistors were left in hand-augered air-filled holes tor several hours to equilibrate. The same thermistor string, calibrated to 0.1°C, was used for all measurements. All observations were made during late December and early january of three successive field seasons. Figure 2 shows the temperatures along the two profiles 40S 10S and 40S- TM indicated by broken and solid lines, respectively, in Figure 1. We plot the firn temperatures against surface altitude in Figure 3.
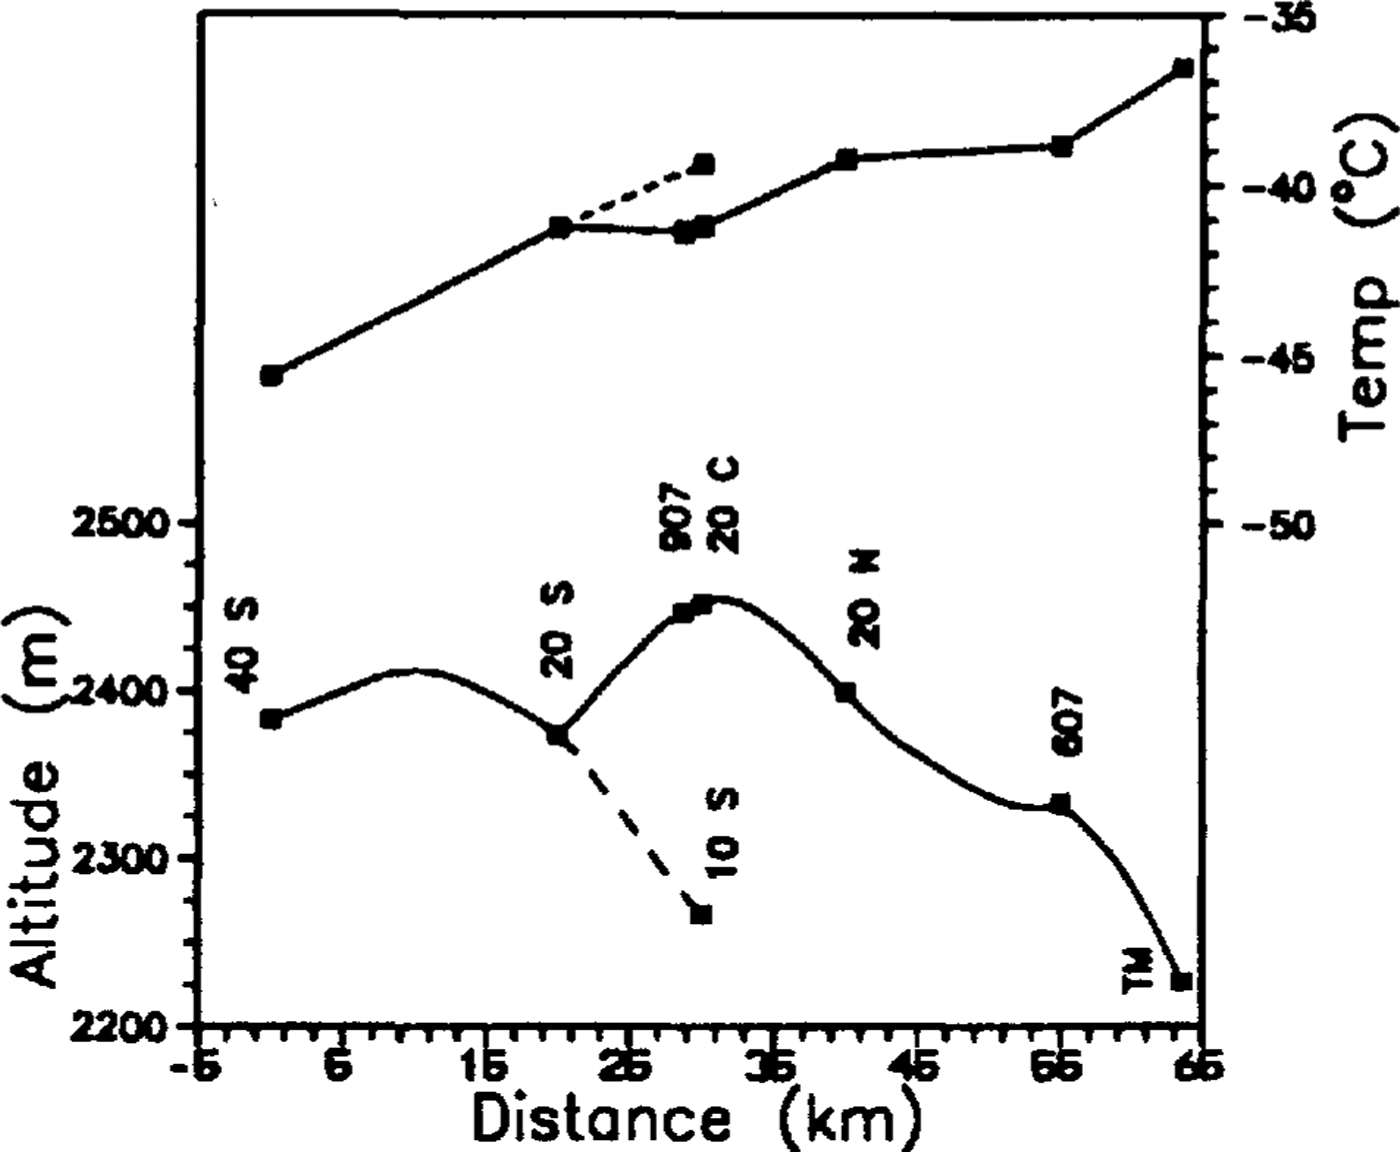
fig.2 Temperatures measured at 10 m depth in the fir. Distance and surface topography are measured along the profiles shown in Figure 1.
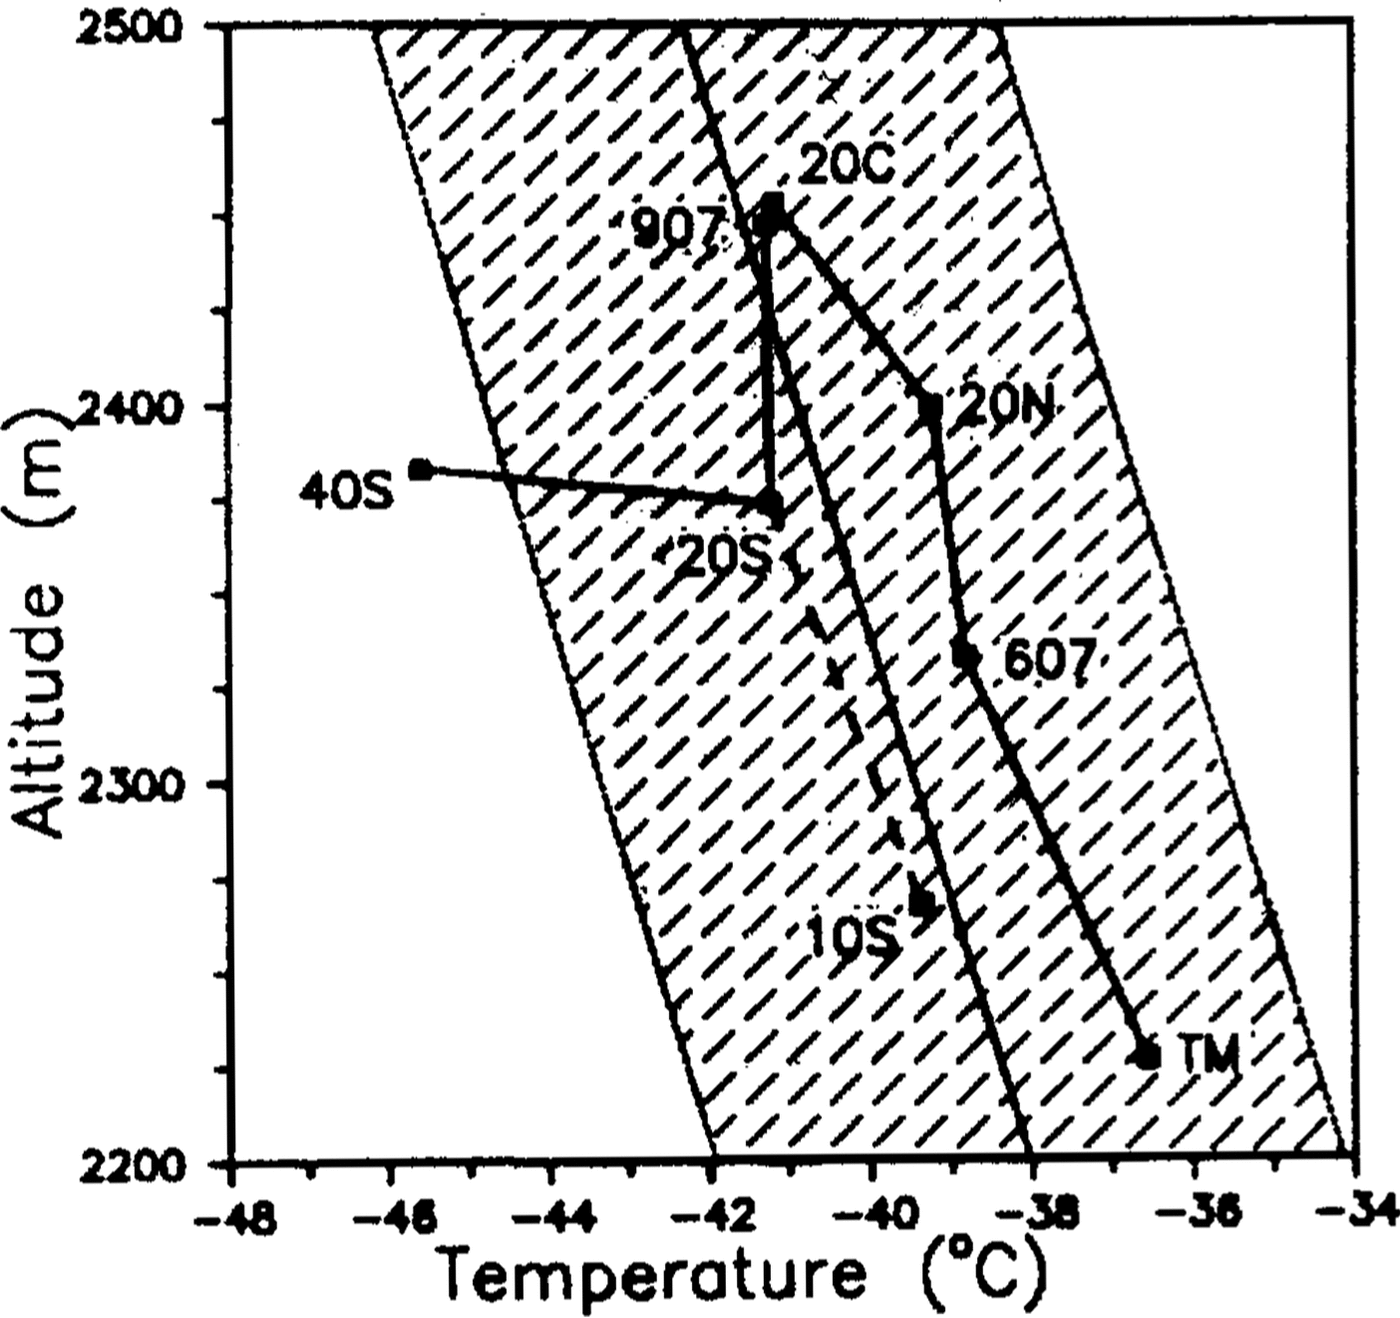
fig.3 Temperatures at 10 m depth in firn as a function of ice-sheet surface altitude. The shaded band shows the regression fit by Reference Fortuin and Oerlemans Fortuin and Oerlemans (1990) of surface temperature to altitude at 77°45'S.
Figure 2 shows a westward cooling trend away from the Transantarctic Mountains. The temperature data do not closely mirror ice-surface altitude. The Reference Fortuin and Oerlemans Fortuin and Oerlemans (1990) multiple-regression analysis attributed 85% of the variance of their 10m temperature data to altitude and latitude. Since their model attributed only a 0.05 deg temperature change to the 15min of latitude spanned by our sites, we will not concern ourselves further with the latitude dependence. In Figure 3 we show their altitude-temperature regression line at 77"45' S. Some local climate processes can be parameterized by altitude; the super-adiabatic lapse rate on the polar plateau, as found by Fortuin and Oerlemans, has been attributed to widespread adiabatic heating of katabatic winds by Reference Wendler and Kodama Wendler and Kodama (1985). However, the large standard deviation of the Fortuin and Oerlemans study shown by the shaded band in Figure 3 reflects the inclusion of data from widely spaced parts of the continent with inherently different synoptic influences and with locally variable microclimates that influence temperature in ways not easily quantifiable in their regression model.
In Figure 3, the two profiles descending from the summit (20C-TM and 20C-10S) fall within the Fortuin and Oerlemans band, suggesting that they are subject to local climate processes similar to those at most other plateau sites. However, the slopes on these two profiles differ noticeably. The line 40S-20S, to the west, has a third distinctively smaller slope. This suggests that physical processes that cannot be parameterized entirely by altitude and latitude are at work. These processes differ on the north and south flanks of Taylor Dome and cause strong relative surface cooling to the west.
We wish to separate the signal due to these unidentified factors from the signal due to altitude. The solid squares 111 the upper panel of Figure 4 show the deviations of observed firn temperatures from the best altitude-temperature line fit to our eight data points. Because the westernmost data point 4OS skews the best fitting line (see Fig. 3), we plot (open squares) the deviations of all eight data points from the best-fitting altitude-temperature line for the seven other points only. Finally, the solid asterisks show the deviations of our 10m firn temperatures from the Fortuin and Oerlemans line for the interior plateau. The residuals calculated by all three methods consistently show that the temperatures get colder westward from 20N, in a way that cannot be accounted for by altitude alone.
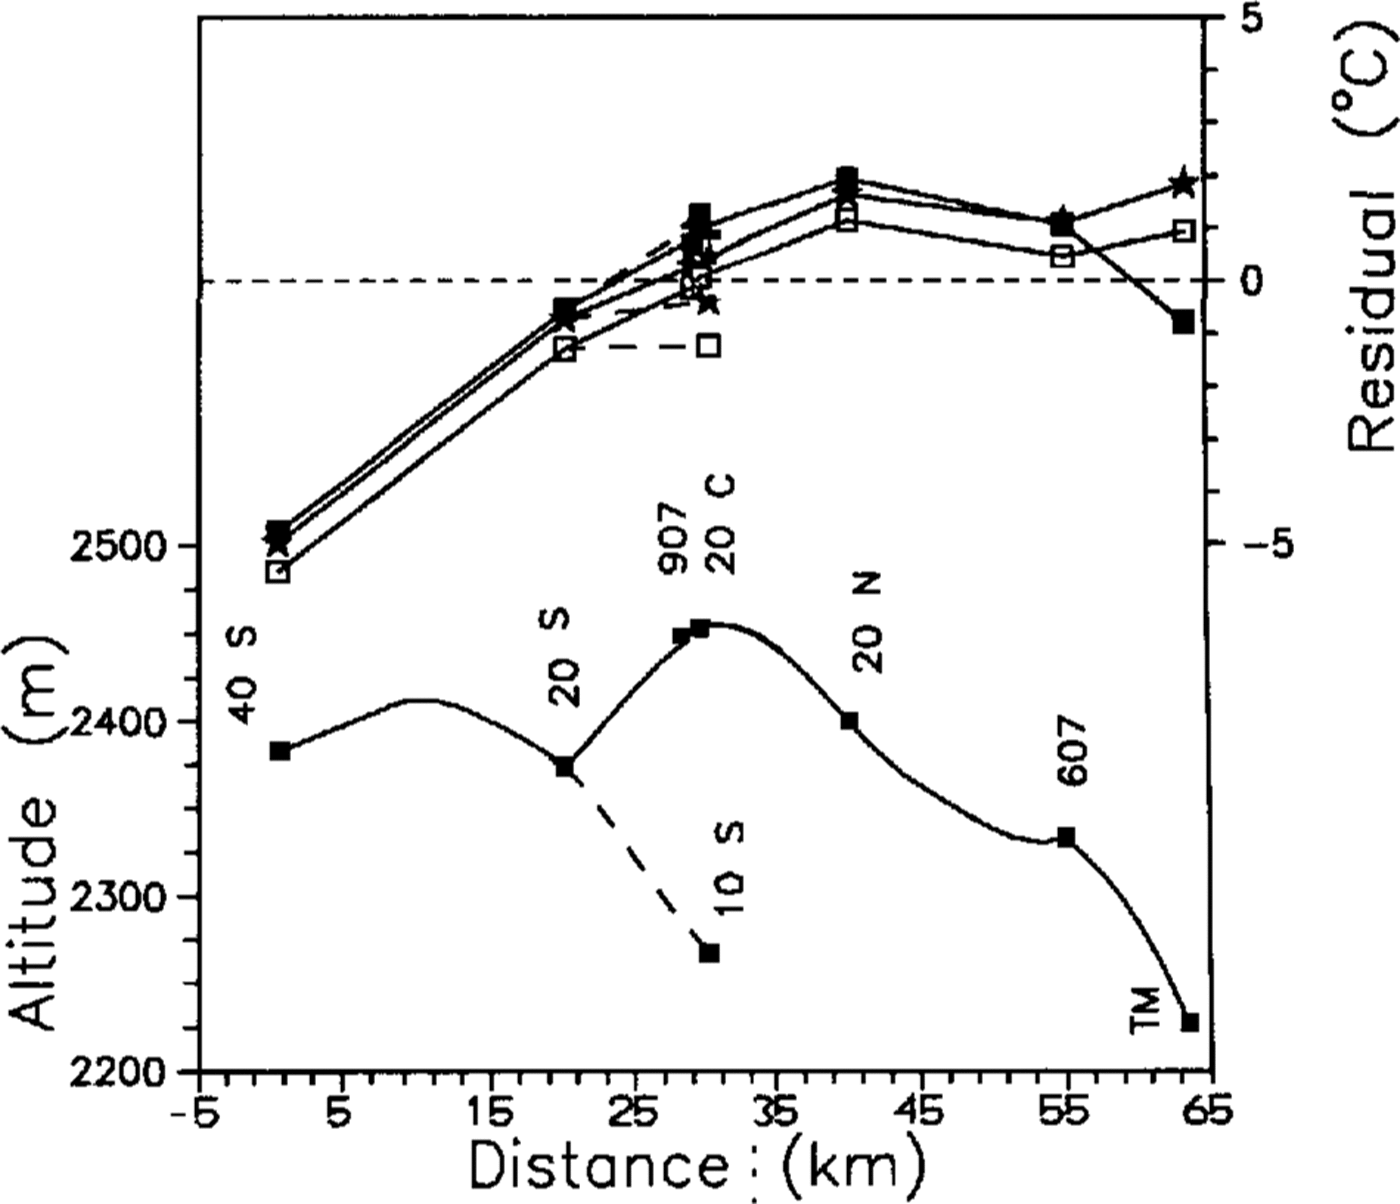
fig.4 Deviations of Taylor Dome firn temperatures from the best-fitting altitude-temperature line for all eight Taylor Dome data points (solid squares) and from the best-fitting line to seven Taylor Dome data points, excluding point 40S (open squares) and from the Reference Fortuin and OerlemansFortuin and Gerlemans (1990) regression line (asterisks).
Weather-station data
Annually averaged air temperatures (as estimated from the firn temperatures) have inadequate temporal resolution to reveal unambiguously the physical processes acting at Taylor Dome.Figure 5 shows the difference between the average daily air temperatures from two Automatic Weather Stations (AWS) that recorded simultaneously throughout 1992 at sites 40S and 20C (Fig. 1). There are three features to note in Figure 5. First, there appears to be an annual cycle in the temperature difference.During the austral summer, the air temperatures are very similar at the two sites but,during the winter, 20C near the centre of Taylor Dome tends to be 5 deg or more warmer than 40S on the western flank. Secondly, superimposed on the annual cycle, we see episodes lasting 1-2 d during the winter when it can be as much as 20 deg warmer at 20C. Thirdly, we see winter periods of several days when the temperatures at the two sites are nearly equal.
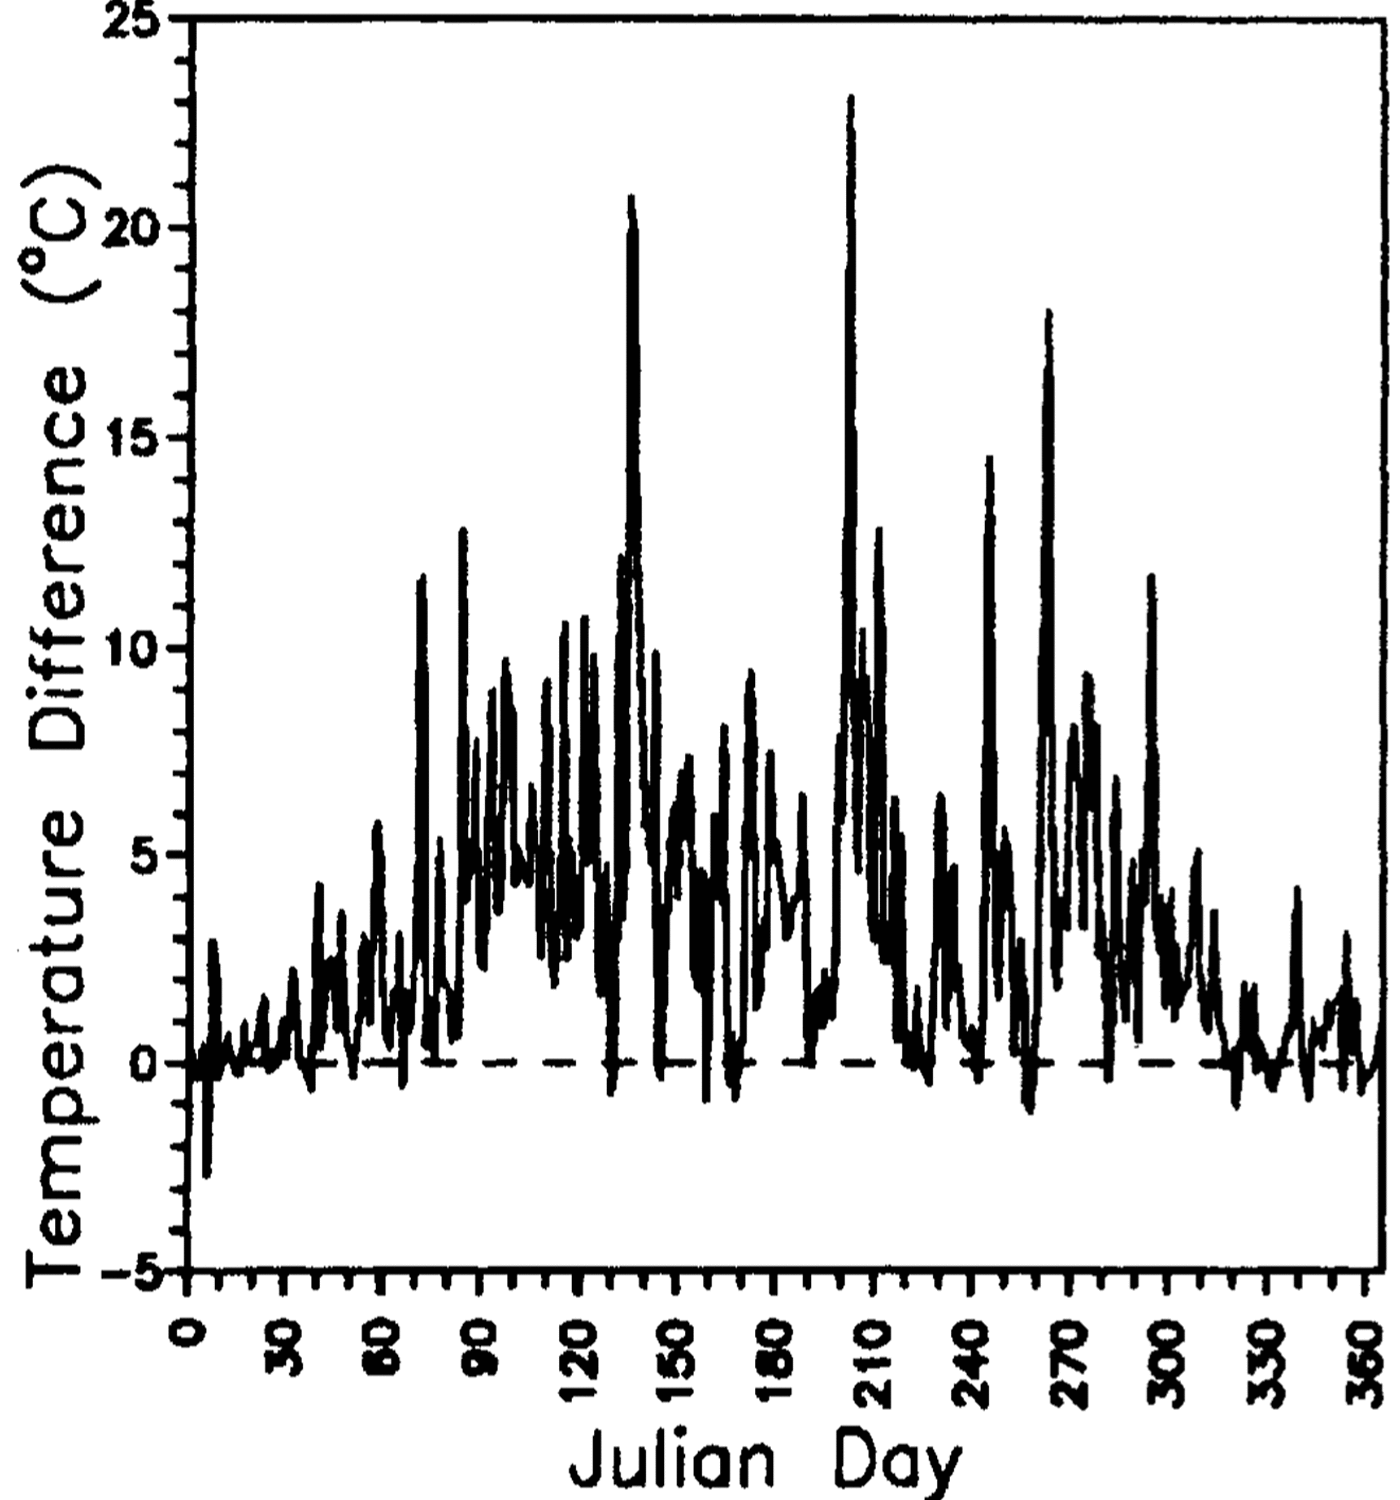
fig. 5 Difference in mean daily air temperature between site.20C and 40S (temperature at 20C minus that at 4OS) at 3 m above the snow throughout 1992. Firn temperature at site 40S is colder by 4.4 deg. The two sites have similar summer temperatures but winter temperatures can be warmer by up to 20deg at 20Cfor short time periods.
Examination of the individual air-temperature records (not shown) from the two sites 40S and 20C showed that the largest winter-temperature differences coincided with cold temperatures at 40S. During the winter periods, when the temperature difference was very small, the temperature tended to be relatively warm at both sites or rising rapidly at both sites. The relative warming and cooling trends at the two AWS sites during the rest of the winter do not show a simple pattern
We find that the difference in air temperature in Figure 5, when averaged over the full year 1992, accounts for 75% of the observed difference of 4.4 deg in the firn temperatures at the two sites. The times of extreme temperature difference account [or only a small fraction of the annual average temperature difference because of their short duration. The 1992 annual average air temperatures from each of the two sites were several degrees warmer than the corresponding firn temperatures. This difference is probably due to: the inversion-layer temperature gradient between the snow surface and the sensors located 3m above it, and (b: sensor shields that imperfectly prevented radiative heating. Further analysis of AWS data should clarify this.
Physical processes
The trend seen in the residual temperatures in Figure 4 must result from spatial differences in the surface-energy balance (radiation or latent- and sensible-heat fluxes) or in the sub-surface energy fluxes or sources. We have insufficient data yet to evaluate these terms across Taylor Dome. Spatial differences or temporal changes in local energy balance result from differences or changes in meteorological processes affecting the regional or local area. These processes, which are complex and interrelated (Reference Morse and WaddingtonSchwerdtfeger, 1970, Reference Morse and Waddington1984; Reference Allison, Wendler and RadokAllison and others, 1993), are the link between climate and ice cores. We now outline physical processes that could contribute to the temperature patterns that we observe.
(1)Cloud-cover differences
Snow radiates as a black body in the infrared and radiative cooling is a major control on ice-sheet surface temperatures (Reference Crutcher and RexCrutcher, 1969; Reference Morse and WaddingtonSchwerdtfeger, 1970, Reference Morse and Waddington1984). Snow-surface temperature tends to equilibrate with the temperature o[ the nearest black-body radiator above. This black body can be a cloud, which is relatively warm, or the clear sky which is relatively cold. If clouds associated with storm systems moving into the Ross Sea sometimes penetrate the Transantarctic Mountains barrier, the frequency of cloud cover could diminish with distance from the Transantarctic Mountains, causing enhanced radiative cooling of the snow surface to westward.
(2)Inversion-layer strength
Under a clear sky, strong radiative cooling leads to the persistent and strong temperature-inversion layer widely seen over ice caps. However, windier areas are known to have less-stable inversions; turbulence mixes warmer air from aloft down into the inversion layer and may totally disrupt it. Differences in wind and turbulent mixing across Taylor Dome could result in a spatial gradient in the strength of the surface-inversion layer.
(3)Warm-air intrusion
Storm systems could bring warmer air up through the Transantarctic Mountains, transferring a diminishing amount of sensible heat to the surface with distance on to the polar plateau.
(4)Cold-air intrusion
Wind from the inland plateau may have a complicated flow pattern that preferentially brings colder air to the west and south of Taylor Dome.
(5)Firn thermodynamics
As yet unidentified physical processes in the near-surface firn might heat or cool the firn without altering the temperature of the snow surface or the air above. Latent heat of refreezing melt water (Reference Jouzel and Merlivat Paterson and Clarke, 1978), internal heating of the firn by viscous wind dissipation or transfer of sensible heat deep into the firn (Reference Clarke, Fisher and WaddingtonClarke and others, 1987; Reference Clarke and WaddingtonClarke and Waddington, 1991) would be examples. Spatial variations of such processes could account for the observed firn temperatures.
Discussion
We now assess the importance of these various processes.
In summer, heavy cloud cover was often observed near the mountains to the east, while the sky remained clear to the west. However, Figure 5 shows that the firn temperature pattern results mainly [rom processes active in winter. In winter, the very cold temperatures at 40S during periods of extreme temperature difference in Figure .5 could result when skies clear at 40S while cloud cover persists to the east.
Differences in inversion-layer strength appear to account for strong spatial gradients in 10 m firn temperature at Agassiz Ice Cap on Ellesmere Island in Arctic Canada (Reference Waddington, Magnusson, Fisher and KoernerWaddington and others, 1988, Reference Waddington, Cunningham, Fisher and Koerner1989; unpublished data of E. D. Waddington and D. A. Fisher). The inter-dependence of katabatic winds and surface temperatures in Antarctica has been studied previously Reference Morse and WaddingtonSchwerdtfeger, 1970, Reference Morse and Waddington1984; Reference Wendler and KodamaWendler and Kodama, 1985; Reference BromwichBromwich, 1989; Reference Allison, Wendler and RadokAllison and others, 1993). The case for Taylor Dome is also compelling but as yet poorly documented. The cold temperatures at 40S during times of large temperature differences in Figure .5 could be explained by calm conditions with a strong inversion at 40S. while wind turbulence mixes the inversion layer at 20C. We do not yet have adequate wind data to test this. We observe more sastrugi and scouring, features related to strong wind, on the north flank of Taylor Dome in the vicinity of 20N than elsewhere.
Reference Hogan, Barnard, Samson and WintersHogan and others (1982) reported large changes in temperature at South Pole Station associated with incursions of different air masses on to the plateau. At Taylor Dome, during summer we have observed rising temperature and changes in wind direction coincident with the arrival of marine air from the Ross Sea. Similar patterns can be seen in other seasons in the weather station data. The relatively warm winter temperatures or warming trends associated with times of little or no temperature difference in Figure .5 arc compatible with penetration of warm air masses far into the interior; however, those data are also compatible with the absence of an inversion layer due either to the formation of heavy and uniform cloud cover or to windy conditions throughout the area
We have inadequate data on wind patterns or source areas to assess the importance of cold-air intrusions from the interior. The cold temperatures seen at 40S during times of extreme temperature differences in Figure 5 arc compatible with a flow of cold air around the southwest Hank of Taylor Dome. However, katabatic flows tend to warm as they descend: it is unclear what temperature would be associated with such winds at 40S. Future AWS data should resolve this. Processes (1) – (4) all attribute the 10m firn-temperature differences to differences in the mean air temperature at the snow surface. Firn thermodynamic processes would attribute the temperature difference to differences in heat sources within the upper 10 m of firn, without a corresponding difference in air temperatures. Since Figure 5 shows that the air-temperature difference accounts for most of the firn-temperature difference, we conclude that firn processes are not a major contributing factor. In addition, there is no evidence of surface melting at Taylor Dome and a study of firn temperatures and wind speed (personal communication from P. Trowbridge) indicated that the thermal effect of wind was small during experiments at site 20C during the summer.
Further data are needed to determine the relative impacts of these processes. Probably, no single process accounts entirely for the firn-temperature pattern; however, we expect that the interplay of katabatic wind and the winter temperature inversions is very important. Cloud cover may be obtainable from satellite images. However, clouds are often difficult to distinguish from cloud-free ice surfaces. Advanced Very High Resolution Radiometer (AVHRR) images can be processed to yield the surface temperature of cloud-free areas. These images can reveal temperature patterns associated with compressional heating of katabatic winds (Reference BromwichBromwich, 1989) in spatial detail unattainable by an AWS network. Longer AWS records and better AWS spatial coverage would complement AVHRR data by calibrating AVHRR derived temperatures and measuring associated winds and pressures. Three automatic weather stations at Taylor Dome Fig. 1) now measure air and snow temperatures, wind, visible insolation and air pressure. We plan to examine these data, when retrieved, for evidence of differences in air temperature, in vertical temperature gradient and in wind speed among the three sites throughout the year.
When we understand the modern local climate, we will be able to address the impact of past local climate changes on the ice-core-derived climate record. Local climate processes can (1) alter the geochemical record in the ice, or (2) affect the ice temperatures and the calibration of the isotope thermometer, or both
Impact on the geochemical ice-core record
Some aspects of the geochemical climate signal in the ice may be affected by changes of the local surface temperature regime. We must understand the processes causing these changes, so that the local geochemical signal is not mistaken for a regional or global signal.
Gas and chemistry measurements in the ice-core should be largely unaffected by microclimate-related changes in near-surface air temperature, as long as the temperature has stayed below -1.5°C. Dust and aerosol measurements should also be largely unaffected by temperature; however, they could show indirect correlation with temperature if differences in windiness, which may also affect dust and aerosol deposition (Reference Cunningham and WaddingtonCunningham and Waddington, 1993), cause the temperature differences.
Precipitation on polar ice sheets tends to come from air masses that move continuously from a warmer to a colder environment such that vapor saturation is maintained, and precipitation and water removal are controlled by the rate of cooling. If the vapor source and atmospheric circulation do not vary with time, and if precipitation always occurs under Rayleigh conditions (Reference Dansgaard, Johnsen, Clausen and GundestrupDansgaard and others, 1973) without vapor exchanges along the path, then the stable-isotope ratios δ18O and δD in an ice core can reveal the difference in temperature between past and modern times at the place where the ice crystals formed from the vapor phase (Reference Jouzel, Merlivat and Loriuse.g. Paterson and Hammer, 1987). If all precipitation originates as snow falling from above the inversion layer, the stable-isotope record should be unaffected by microclimate-related temporal changes in the surface temperature. Ice crystals known as diamond dust can form from vapor cooling within the inversion layer. The relative importance of this source of accumulation at Taylor Dome is unknown; however, it is significant at the South Pole (personal communication S. G. Warren, 1992). When this vapor has been brought into the area by global-circulation patterns satisfying all the above isotopic conditions, the stable-isotope ratio of diamond dust will depend on the air temperature in the inversion layer.
A changing local temperature pattern could also change local sublimation and precipitation processes near the surface, thus affecting the stable isotopes in the firn. Snow-pit studies at Taylor Dome (Reference DrewryGrootes and others, 1991; Reference Cunningham and WaddingtonGrootes and Steig, 1992a) show that a significant fraction of the firn is metamorphosed to form depth hoar at some locations, particularly on the north flank. with a strong inversion layer, surface cooling and light winds, vapour from sublimating firn may move toward the surface, only to be partially redeposited locally as hoar. The hoar, isotopically heavier than the vapor, could enrich the snow in heavy isotopes. In a windier regime, with a weaker inversion layer and warmer near-surface air temperatures, all the vapor would tend to escape from the local area without redeposition. Thus, changes in the local surface temperature and wind could cause a secondary change in the average isotopic composition of the snow.
Finally, if wind mixes or redistributes snow or diamond dust horizontally over distances comparable to the length scale of the local climate variations, the temperature pattern and the resulting isotope pattern may be out of phase or unrelated
Impact on isotope-thermometer calibration
The coefficients a and b in Equation (1) can be determined from at least three types of data sets. Linear relations have been reported between isotopic values 8 of precipitation at a specific site and temperature T of the precipitating cloud (reviewed by Reference KatoRobin, 1983, table 2). Cloud-temperature data are difficult to obtain and this technique is seldom used. Over areas of the Greenland and Antarctic ice sheets, a linear relation is commonly seen between spatial variations of mean isotopic value 8 of surface snow and corresponding variations of mean annual surface temperature T (Reference Dansgaard, Johnsen, Clausen and GundestrupDansgaard and others, 1973; Reference Hooke, Le, Gould and BrzozowskiPaterson, 1981, p.324; Reference KatoRobin, 1983). At Taylor Dome, where the firn temperatures deviate up to 5 deg from both the Reference Fortuin and OerlemansFortuin and Oerlemans (1990) model and from the local altitude-temperature best-fit model (Fig. 4), it is not yet apparent how to choose representative values for the modern surface temperature T. Inappropriate values for T will yield a poor modern spatial δ-T relationship and give the wrong absolute paleotemperatures from δ18O in the ice core. A linear relation may also be found by comparing the time series of the isotopic ratio 8 in an ice core with the temperature history inferred from the temperature profile measured in the borehole (Reference Cuffey, Alley, Grootes and AnandakrishnanCuffey and others, 1993). At Taylor Dome, we do not yet know whether the local spatial pattern of firn temperature has been stable for thousands of years. Therefore, we must be cautious about calibrating the isotope thermometer with a temperature history derived from borehole temperatures. In situations where the firn temperature and isotopes may respond independently to local climate conditions, it may prove to be more practical to use borehole temperatures and isotope ratios to assess the long-term stability of the local surface temperature pattern.
Ice-divide migration
Significant changes in the regional climate, such as the glacial-interglacial transition, clearly could force changes in local climate patterns. However, the ice-cap flow dynamics could also affect the local climate pattern. The interplay of katabatic wind and temperature-inversion strength probably makes a significant contribution to the firn-temperature variability. Since katabatic winds are controlled by surface topography, the topographic crest of an ice divide can have a wind and temperature microclimate associated with it. A moving ice divide could carry its associated microclimate across an ice-core site. Conversely, we might anticipate that the local climate zones may have remained stationary as long as the dome has remained stationary. Because Taylor Dome is centered on a region of high bedrock topography, there is reason to expect that the ice divide and any associated local climate zones have not moved substantially over the time-scale significant to the ice core, i.e. 30 000 years (Reference Waddington, Morse, Grootes, Steig and PeltierWaddington and others, 1993). Ice-dynamical analysis utilizing ice-core data, radar internal-layer data and ice flow models is needed to verify this. Until we fully understand the processes affecting the temperature distribution, we cannot be certain how or if they impact the ice-core record. It is possible that similar local temperature patterns have introduced undetected biases into isotope calibrations or ice-core paleoclimate interpretations at other sites where the firn temperatures have been less thoroughly sampled. Our findings indicate the importance of measuring the local climate variables and carefully checking assumptions about their spatial uniformity.
Acknowledgements
We thank D. H. Bromwich, D. A. Fisher, P. M. Grootes, E. J. Steig, V. Walden, S. J. Warren and two anonymous reviewers for helpful comments. We are grateful to all those who assisted with field preparations, field measurements and logistical support in Antarctica. This research was supported by C. S. National Science Foundation grant NSF DPP-8915924.