


Introduction
The Southern Alps of New Zealand are a major mountain system surrounded by vast areas of ocean in mid-latitudes of the Southern Hemisphere. While there is a reasonable history of observations of snout position and end-of-summer snow-line for key glaciers, there is little knowledge of past behaviour of seasonal snow. Seasonal snow of the Southern Alps is economically important for hydro-electricity generation, irrigation water and recreation, but because the area is so vast (60 000 km2) and unpopulated, it is difficult to monitor. Electricity authorities do not measure snow. Some ski resorts make observations, but reliable and systematic records are available only for the past decade and none relate to the main alpine chain. Consequently, there is no systematic cheek on what is currently happening to seasonal snow in the Southern Alps and little knowledge of past variations or whether there is any long-term trend.
Conceptual models represent one of the more realistic ways to assess past and present snow. This paper calculates the water equivalent of seasonal snow in the main hydroelectric river catchments in the eastern part of the Southern Alps for the period 1930-93. The catchments are for eight South Island lakes: Tekapo, Pukaki and Ohau in the Waitaki River system; Hawea, Wanaka and Wakatipu in the Clutha River system; Te Anau and Manapouri in the Waiau River system (Fig. 1). Their combined area is termed the macro catchment, and represents about 25% of the Southern Alps. Its area is 15 000 km2 and it ranges in elevation from 400 to over 3700m. The Main Divide shown in Figure 1 has an elevation of about 2000 m in the south and over 3000 m in the north of the macro catchment.
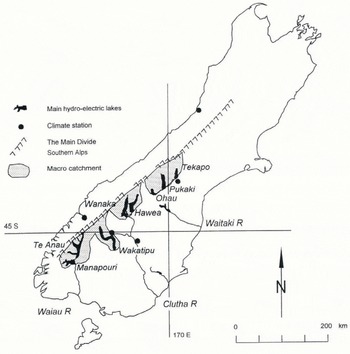
Fig. 1. South Island showing lakes, macro catchment and location of climate stations with long records
The South Island of New Zealand lies within the Southern Hemisphere westerlies and its climate along the coast is moist and equable. Annual mean temperatures are about 11° C and monthly averages have a seasonal range of less than 10° C. Annual precipitation in the macro catchment varies from about 10 000 mm near the Main Divide to less than 1000 mm in the east. There is only a small seasonal variation with a winter minimum and spring maximum. Below 1000 m elevation, almost all precipitation falls as rain. Because of the mild climate, rain can also occur at elevations above 3000 m on some occasions, but above 2000 mm winter precipitation mainly falls as snow.
The long-term water balance has been assessed using methods outlined by Reference Hare and Hay.Hare and Hay (1971) and applied to other New Zealand catchments by Reference Fitssharris and Griminond.Fitzharris and Grimmond (1982). Runoff into each of the eight lakes of the macro catchment has been measured since 1930 and averages 2336 mm annually. Annual evaporation is estimated at 522 mm based on the formula of Reference Priestley and Taylor.Priestley and Taylor (1972). Thus, mean annual precipitation for the macro catchment is calculated as 2858 mm. On average, the storage term in the long-term water balance accumulates from April to reach a maximum in October of 360 mm. Most of this is assumed to be due to snow. Water is lost to storage from September to March so that, on average, net change in storage over the year is Zero.
Methods
A conceptual snow-wedge model, similar to those of Reference Moore and Owens.Moore and Owens (1984), Reference BarringerBarringer (1989) and Reference Woo and Fiszhams.Woo and Fitzharris (1992), provides estimates of seasonal snow. The mass balance of the snowpack is calculated as water equivalent for each day (d), at elevation hands (z) of 300 m vertical height. The elevation bands cover the range 850-2350 m a.s.l. This more than covers the seasonal snow zone in New Zealand, which seldom accumulates below 1000 m, and as shown by Reference ChinnChinn (1988) the usual late-summer snow-line is at about 2000-2100 m in this part of the Southern Alps. The highest elevation band in the model (centred on 2200 m) normally contributes to perennial rather than seasonal snow, but is included so as to check that the model behaves correctly. The seasonal-snow year begins on 1 April and ends on 31 March. The daily specific mass balance at each elevation (b (z,d)) is given by
where p is snow deposition and a is snow ablation.
Daily snow deposition at each elevation band (p (z,d)) is:

where T (z,d) is daily mean temperature (°C) at elevation z, and T h is the threshold temperature that decides whether precipitation occurs as snowfall rather than rainfall. Precipitation (P (z,d)) is calculated with a distribution similar to that used by Reference Thompson, Adams., Murray and AckroydThompson and Adams (1970) and Reference Moussavi, Wyseure and Feycn.Moussavi and others (1989):
where P (o,d) is the daily precipitation averaged over five suitable climate stations about the macro catchment. These stations have quality records that extend back to 1930 (Fig. 1). From north to south they are Hokitika, Tekapo, Milford Sound, Queenstown and Alexandra. Their elevations range from 3 to 683 m and average 243 m. l is a Coefficient that adjusts the distribution of precipitation with elevation, and h is (z – 243) and takes account of the average elevation of the climate stations above sea level.
Daily ablation at each elevation band (a(z,d)) is calculated using a degree-day model:

where f is an ablation factor that determines melt per degree day (mm °C−1 d−1) provided T (z,d) > 0° C.
The daily mean temperature at each elevation, (T (z,d)), is calculated by lapsing the average temperature recorded at the climate stations shown in Figure 1 at a rate of 0.7° C per 100 m. This lapse rate is similar to that found by Reference GarnierGarnier (1950) and used in other New Zealand studies (e.g. Reference Moore and Owens.Moore and Owens, 1984). Values of f are varied throughout the year over the range 3-8 mm °C−1 d−1 as suggested by Reference Mariinee. and Rango.Martinec and Rango (1986). Exact values are unknown and are set a priori based on elevation and time of year. For example, f is set to 3 mm °C−1 d−1 at the start of winter at all elevations. At 1000 m, it rises to 8 mm °C−1 d−1 before the beginning of spring, but at 2200 m does not achieve this value until mid-summer. Intervening elevations have intermediate values, f stays at 8 mm °C−1 d−1 until it begins to decrease to 3mm °C−1 d−1, first at 2200 m in mid-autumn. but not until late autumn at 1000 m.
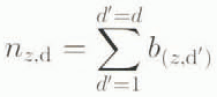
Net specific snow accumulation (n (z,d)) is calculated daily from 1 Aprir for a year ending on 31 March:
and this is multiplied by the respective band area (Sz ) to give net snow balance (B z,d):
Total seasonal snow (Bd ) in m3 of water is computed for each day:
Snow in the 2200 m elevation band is not included in B d because it is above the end-of-summer snow-line (Reference ChinnChinn, 1988) and so adds to perennial ice storage, rather than seasonal snow storage. On any day, the amount of water stored as seasonal snow as averaged over the whole catchment (w d) is:
where S is the area of the macro catchment and w d is expressed in millimetres of water, Annual maximum seasonal snow is defined as the highest value of w d achieved during a given snow year.
The model uses daily climate data (T d,P d), for the period 1930-93. Missing values make up less than 3% of a total of 340 000 observations, and are estimated using regression relationships with nearby climate stations.
Tuning the Model
The model was tuned so that output was compatible with the long-term water balance. First, l was adjusted to 0.0005 so that average precipitation over the macro catchment was 2858 mm, the same as that obtained from the long-term water balance. Secondly, values of T h, were adjusted so that there was a good match of w d averaged over 1930-93 compared with the seasonal storage term obtained from the long-term water balance. This gave T h at 2.5° C.
Testing the Model
Unfortunately, there have been few continuous observations of snow in the macro catchment, and those available tend to be located in the eastern part, where precipitation is lower. Thus there are few observational data to test the model, and some of these are qualitative rather than quantitative.
Observations of seasonal snow on Tasman Glacier (located within the Pukaki catchment) made in 1968, a bigger than average snow year, are summarised by Reference Fitzharris, Murray and AckrroydFitzharris (1979). As shown in Figure 2, model net specific snow accumulation correlates well with measured snow at tour elevations from May to December. However, the model tends to underestimate, especially at 2200 m. In 1993/94, continuous measurements of the snowpack were made at 1650 m on Mount Belle (near the Te Anau catchment) and at 1600m at Mueller Hut (within the Pukaki catchment). In these cases, modelled net specific snow accumulation at 1600 m overestimates the observations (Fig. 3). However, the model starts and ends the snowpack at the observed times.

Fig. 2. Comparison of specific seasonal snow at four elevations from the model with those measured on Tasman Glacier, 1968/69.

Fig. 3. Comparison of specific seasonal snow at 1600 m from the model with actual measurements at about the same elevation, 1993/94.
The best available syntheses of past snow conditions in the Southern Alps are published in Reference ChinnChinn (1981) and Reference BreezeBreeze and others (l986). These were compiled from a comprehensive range of all available sources, including Alpine Club journals, diaries, old photographs, snow avalanche histories, road reports and ski-field records. These are often qualitative, anecdotal and heterogeneous, and may miss a few winters with notable snow since 1930. These syntheses of historical data were updated with reports on the nature of each winter and state of the snowpack, which are systematically collected by the New Zealand Mountain Safely Council and made available annually. A summary of notable winters identified in these sources is given in Table 1. Also listed are the largest snow years as determined from the model (defined as annual maximum seasonal snow greater than 450 mm; see Fig. 4). Comparison shows that the eight largest snow years as judged by the model (1943, 1949, 1968, 1983, 1988, 1991, 1992, 1993) all appear as big years in the historical record. The historical evidence identifies five other years (1946, 1957, 1964, 1972, 1980) as notable: all these years have above-average seasonal snow according to model values given in Figure 4.

Fig. 4. Annual minimum seasonal snow, 1930-93.
Table 1. A comparion of notable snow years from the historical record with those obtained from the model. See text for details

In summary, the model underestimated the snowpack on Tasman Glacier but overestimated it at two other sites in another year. Modelled seasonal snow accumulates and melts in a similar way to that observed. The model captured the biggest snow years in the historical record. It must also be considered that it represents seasonal snow for the whole macro catchment, whereas measurements are at particular points. The model is tuned to be consistent with the long-term water balance. While these tests are not definitive, they indicate that the model is useful. At worst, the model acts as an index of snow conditions in the macro catchment.
Results
Figure 5 illustrates the model output for a typical year (1943/44). Values of net specific snow accumulation (n z,d) for each elevation band are presented in the upper part of the figure. In this example, snow accumulated through-out the winter and reached a peak progressively later at higher elevations (October at 1300 m, but December at 2200 m). No snow accumulated at 1000 m. Once melt began, snow melted rapidly and was gone at all elevations before March, except at 2200 m. Because this elevation is above the permanent snow-line, snow in this band melts little and contributes to the many glaciers in the macro catchment. The lower part of Figure 5 gives seasonal snow in m3 (B d). It shows steady accumulation to reach a maximum of 6150 × 106 m3 in October 1943, equivalent to 410 mm averaged over the macro catchment. Most of this water was released through snowmelt by the end of January 1944.

Fig. 5. Example of output from the model: seasonal snow for 1943/44.
Over the period 1930–93, the annual maxima of W d averaged 366 mm. Figure 4 is a chronology of such values as determined by the model for 1930–93. They vary from less than 200 mm depth of water average over the macro catchment to 650mm. Their standard deviation is 100 mm. reflecting the large inter-annual variability of seasonal snow. A linear regression analysis between annual maximum W d and year number showed zero slope and no statistically significant relationship with time. The 1940s and early 1990s had higher average seasonal snow than other decades, while the 1980s was the most variable decade (Table 2).
Table 2. Statistics of annual values of maximum seasonal snow (mm) by decade and for the period 1930–93

The way seasonal snow accumulates and melts is shown by the composite patterns of w d for each year between 1930 and 1993 (Fig. 6). The long-term mean is shown as the sinusoidally shaped, bold line. This “spaghetti graph” demonstrates that there has been considerable variability in the history of seasonal snow in every month. Values of w d over 64 years are near-normally distributed for any month. Standard deviations of w d are 40 mm in June, 100 mm in October and 60 mm in February. Annual maximum values of w d occur at any time between early September and late December. About half the years experienced maximum snow in October.

Fig. 6. Composite graph of seasonal snow for each year, 1930–93.
The model can be run during any current year to access the size of snow storage in the macro catchment in near-real lime. The current year’s seasonal snow can be placed in its relative historical context when plotted onto Figures 5 and 6. Thus snow in an important part of the Southern Alps can be monitored in a way not possible before and its size relative to the past assessed.
Conclusion
A model has been constructed which calculates accumulation and ablation of seasonal snow over a large area of the Southern Alps. It can be used to monitor snow in the current year and to place the water stored as seasonal snow in the perspective of 64 years of history since 1930. The model also provides an indication of past variability of seasonal snow. On average, seasonal snow in the macro catchment builds systematically from about May to a maximum of 366 mm in October. However, over the period 1930–93 it has been highly variable both within and between years. There is no identifiable long-term trend in annual maximum values, but the 1980s demonstrated higher variability. Ongoing research investigates the role of circulation patterns and weather types in the southwest Pacific in generating both larger and smaller snow years. Further tests of the model with field measurements and comparison with lake inflows are also planned.
Acknowledgement
This research is funded by the Electricity Corporation of New Zealand.


