


Introduction
In the present discussion of climate change and its influence on glacier growth or shrinkage, the focus is often placed on the relation between glacier mass change and the rise in air temperature as analyzed by Reference HoughtonHoughton and others (2001). In this context, the retreat of mountain glaciers since the end of the Little Ice Age, or at least since the beginning of the 20th century, is related to the 0.6 K warming of the atmosphere worldwide and an even higher rise of 1 K in the Alps. Yet this increase in air temperature also has an impact on other control parameters of glacier behaviour (e.g. counter-radiation or precipitation type). If snowfall becomes less frequent due to rising air temperatures even in high mountain regions, smaller amounts of snow are deposited on the glaciers, and the shielding effect of the high snow albedo during summer is reduced, leading to an increase in radiation absorption and consequently in meltwater production during summer. As shortwave radiation absorption accounts for 70–80% of the meltwater production, it is of interest to investigate possible changes in precipitation type with relation to air-temperature trends for highly glaciated regions, as the albedo effect could provide an additional explanation for the high mass losses and increasing runoff of alpine glaciers.
To our knowledge, no quantitative analysis of the effect of precipitation type on glacier discharge has been performed over longer observation periods. Reference RangoRango (1997) discusses the importance of the areal snow cover for snowmelt–runoff models and considers the location of snow in a basin as a basic modelling requirement for applying snowmelt and rain-on-snow algorithms at the right locations; he also comments on the effect of climate change on precipitation type. In their study of mountain glacier discharge modelling and climate warming, Reference Hock, Jansson, Braun, Huber, Bugmann and ReasonerHock and others (2005) mention the importance of determining the precipitation type, as ‘a strong summer snowfall can effectively shut off glacier discharge for an extended period of the melt season’, but they do not go into detail. Reference Oerlemans and KlokOerlemans and Klok (2004) investigated the influence of a severe summer snowfall (10–11 July 2000) on Morteratschgletscher, Switzerland, using meteorological and sonic ranger data and model experiments. They concluded that two significant summer snowfalls could compensate for the effect of a 1K higher mean temperature during the ablation season.
For the Vernagtbach drainage basin (Fig. 1) in the Oetztal Alps, Austria, covering an area of 11.44km2 of which approximately 72% is currently glacierized, and an altitudinal range 2640–3630 m, runoff, air temperature and humidity, as well as other meteorological quantities such as radiation and wind, have been recorded on an hourly time-step since 1974 at the Vernagtbach Pegelstation, the only exception being precipitation where only daily sums could be analyzed from the analogue precipitation charts until 2001. In principle, this extensive dataset provides the basic quantities for a precipitation type analysis, and the hydrograph of these 30 years gives sufficient examples of the albedo effect on meltwater production and discharge (cf. Fig. 3b). However, as this station is visited only once a month during summer and once or twice between November and April, precipitation type cannot be determined directly by observers as is done on climate stations, but has to be retrieved by indirect methods. For the Vernagtbach basin, some information is provided by daily photographs of the larger part of the catchment taken around noon every day during the summer months since 1976. Originally, the photographs were used for the analysis of the albedo distribution of the glacier on a 100m grid (Reference Moser, Escher-Vetter, Oerter, Reinwarth and ZunkeMoser and others, 1986), as they deliver the actual daily size of ice and firn areas, respectively, and spatially distributed meltwater production calculations were based on and validated with these data (Reference Escher-VetterEscher-Vetter, 1985, Reference Escher-Vetter2000). In the study presented here, the main focus of the photographic analysis is placed on the precipitation type development during the ablation seasons of the last 30 years.

Fig. 1. Map of the Vernagtferner basin with position of measurement sites.
In the following investigation, we first present the temporal evolution of total glacier discharge and air temperature for the ablation seasons 1976–2005.We discuss the methods and problems of distinguishing between snowfall and rainfall in the ablation period, and continue with the determination of snow amounts and number of snowfall days for the Vernagtbach basin, validating the results from the photo analysis with additional, more highly resolved data for the last 4 years. The temporal development of precipitation type during the last 30 years is then related by simple statistics to the change in glacier discharge, in order to investigate whether the marked rise in discharge is caused primarily by a change in snowfall during the accumulation or ablation season. We conclude that the development of the ablation area size must also be considered in order to provide a better explanation of the albedo effect and the consequent discharge rise.
Development of Air Temperature and Discharge for the Vernagtferner Basin
In Figure 2, average values of air temperature (upper panel) for the ablation season, May–September, are presented for the period 1976–2005, combined with discharge amounts (lower panel) for the same period. Although air-temperature data show some scatter, the trend is clearly visible. From quite low values of <3˚C in the 1970s, air-temperature averages rose to >5˚C in the late 1990s and even reached a value of 6.7˚C in 2003. The running average increases by 1.5 K, or 35% of the total range, for the ablation seasons 1976–2005. This is an even higher rise than found in the data from Hoher Sonnblick, Austria. For this station, the average air-temperature rise for the summer season April–September amounts to approximately 1 K (Reference Auer, Böhm, Leymüller and SchönerAuer and others, 2002), and the smaller increase is probably caused by the slightly different averaging period and the higher station altitude (3106ma.s.l.) above the glaciated surface and thus outside the range of the glacier wind regime.

Fig. 2. Time series of air temperature (upper panel), averaged over the ablation period, and discharge (lower panel) for the Vernagtbach gauging site (2640ma.s.l.). Bold lines: centred running average over 5 years.
The lower panel of Figure 2 depicts the discharge development in the basin for the same period. When the Vernagtbach gauging station was built in 1973, a maximum discharge average of 10 m3 s–1 for 1 hour was expected and used for the construction of the measurement channel for the 11.44 km2 large catchment. This hourly average was first exceeded on 22 August 1993, and the time series of specific discharge volume for the mass-balance years since 1974 reached 3300 mm in 2003, representing the absolute record in the series. The overall increase results in a doubling of the average discharge after 30 years of recording, as the trend line starts at 1260 mmw.e. in 1976 and ends at 2310mmw.e. in 2005.
The correlation between average air temperature and discharge for the ablation period is rather high for the >30 years of records, indicating the close connection between the two quantities, which also forms the basis for many models with air-temperature and precipitation data as the only meteorological–hydrological input data (e.g. Reference Braun, Weber and SchulzBraun and others, 2000; Reference Braithwaite, Zhang and RaperBraithwaite and others, 2002). In the discussion presented here, however, we concentrate on the correlation between higher air temperature and precipitation type, and the consequences that a shift from less snowfall to more rainfall might exert on the discharge development in this high alpine region.
Determination of Precipitation Type
There is abundant literature available dealing with the problems of measuring precipitation in general and in mountainous terrain in particular. B.E. Goodison and others (http://www.wmo.ch/web/www/IMOP/publications/IOM-67-solid-precip/WMOtd872.pdf) investigated various sources of measurement error for solid precipitation when using precipitation gauges; they found that wind effects were the predominant influence. Reference Fuchs, Rapp, Rubel and RudolfFuchs and others (2001) mention some of the problems caused by assuming the wrong precipitation type, which can lead to underestimations as high as a factor of three for snowfall amounts. Reference RangoRango (1997) also comments on the problems of measuring precipitation with precipitation gauges in mountain regions and suggests the use of remote sensing to measure an existing snow-cover extent in a larger basin. For the Vernagtbach basin, as already mentioned, the change in snow cover by snowfalls is analyzed on the basis of the daily photographs in the ablation season.
Accumulation season
The separation of snowfall from rainfall can be restricted to the ablation seasons in a basin such as Vernagtbach, as during the accumulation season all precipitation falls as snow. In this sense, the lack of photographs for the period October–April poses no difficulty for this analysis.
The uninterrupted recording of the snow amounts during the accumulation season with a gauge, however, presents other difficulties. If the station is unattended, the instruments can become covered by snowfall; snow can be blown over the device, or removed from the bucket by wind, or the recording itself is interrupted. This is the reason why the winter snow amount in the basin is determined on the basis of the continuous accumulation measurements taken on the glacier since 1964/65 (Reference Escher-Vetter, Braun, Siebers and WeberEscher-Vetter and others, 2005). This kind of procedure delivers the total value for the accumulation season over the entire glacier surface, and it gives a much more reliable temporal pattern than do the gauge recordings of the Pegelstation site. On the basis of these data, the influence of winter accumulation on the runoff of the subsequent summer can also be investigated.
Ablation season
During the ablation season, rainfall has been observed even at the highest altitudes in the Vernagtbach basin, so it is necessary to distinguish rainfall from snowfall for each individual day. For the years 1976–2001, this separation is based primarily on visual inspection of the photographs taken around noon each day from Schwarzkögele mountain.
Figure 3 shows two examples of these photographs from 2003, with an extreme expanse of dark bare ice on 28 August and with a snow-covered glacier surface on 4 September after a snowfall of 14mmw.e. on 31 August. In the lower part of the figure, the hydrograph for this period clearly demonstrates the albedo effect of newly fallen snow, which totally cuts off the diurnal maximum for 3 days (31 August–2 September) due to the small radiation absorption of the white glacier surface. This kind of change, from dark ice to a white surface from one day to the next, clearly reveals the type of the precipitation event during the last day. There are, however, several problems with this approach:
-
1. Small amounts of snow which have fallen during the last 24 hours may have already melted away by noon, i.e. at the time the photograph was taken.
-
2. During May and part of June, it is difficult to distinguish newly fallen snow from a still remaining winter-snow cover, and the same applies for sequences of several days with snowfall in the ablation period.
-
3. Due to technical problems or the inaccessibility of the camera location, the time series of the photographs is not always complete.
-
4. Although the glacier is snow-covered in the photograph, the precipitation type at the recording site in the glacier forefield is not snow but rain.
In order to validate the results of the visual classification, we developed the following procedure. We used the data series from the Campbell data logger, installed in October 2001, where precipitation is recorded on an hourly basis. Then we calculated the hourly mean of the wet bulb temperature, t w, derived from the records of air temperature, t a, air pressure, p, and relative humidity of the air, rh, for the Pegelstation site and the actual period during the day when precipitation is recorded. These procedures are in agreement with those of Reference RohrerRohrer (1992) and R. Steinacker (personal communication, 2006), who recommend the application of t w instead of t a to separate snowfall from rainfall, as the temperature at the snowline is much better represented by t w. Next, we applied the climatological temperature gradient, 0.65 K (100 m)–1, to t w and determined the altitude where t w equals +2˚C, the value used as the threshold temperature. If H(t w) is equal to or lower than 2950 m, 90% of the glacier area lies above the snowfall line. These days were then marked as ‘snowfall days’ and were compared to the results of the photographic method.

Fig. 3. (a) Photographs of the western part of the Vernagtbach basin (28 August and 4 September 2003). (b) Hydrograph of the Vernagtbach stream for the period 27 August–6 September 2003.
Validation results
For the ablation periods 2002–05, Tables 1 and 2 show the results of the comparison for two quantities: snowfall amounts and snowfall days. In this evaluation, only days with snowfall in the entire basin and with solid precipitation sums of >1mm are considered. One millimetre looks like a rather small threshold, but the inner Oetztal valley is a dry region with average monthly precipitation amounts in summer not exceeding 100 mm (for 1976–2005), so daily amounts of <1mm are sometimes observed.
Table 1. Absolute values of, and relative differences in, snowfall amounts for May–September of 2002, 2004 and 2005 and June–September 2003 for the Vernagtbach site, based on analysis of the daily (photographic) and hourly (H(t w = 2˚C)) ≤ 2950 m) data (see text). (The shorter comparison period of 2003 is caused by missing photographs in May)
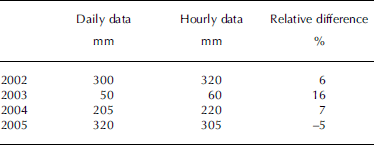
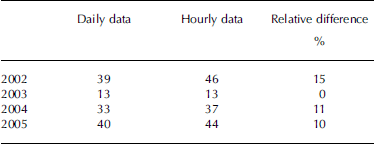
Table 2. Numbers of days with snowfall for May–September 2002–2005 (June–September 2003) from the two gauges for the Vernagtbach site
The difference in snowfall amounts indicates that there is no systematic deviation between the two records, and the agreement for 2002, 2004 and 2005 is rather good; the larger relative difference in 2003 can be attributed to the small absolute amounts. In this context, one should bear in mind that these precipitation amounts are most likely only approximations of ‘real conditions’. However, as we are comparing data for the same site, recorded with similar gauges (Belfort weighing gauges, unshielded, unheated), they should show basically the same errors and therefore have little influence on the present validation procedure.
In Table 2, the records analyzed hourly show a greater or equal number of days with snowfall, compared to the records made on a daily basis. The main reason for this difference is most likely the poor temporal resolution of the paper charts, which can lead to faulty dating of a precipitation event; this erroneous temporal assignment can cause the photographs to be analyzed for the wrong day.
On the whole, however, snowfall amounts and frequency, i.e. the number of days with snowfall in the ablation period as analyzed from the daily photographs, on the one hand, and from the hourly wet bulb temperature evaluation, on the other, do not differ so much for the 4 years of comparison as to preclude the use of simple photo analysis for the whole period 1976–2005. Thus, the following investigations are based primarily on the classification of precipitation type from the photographs. Only for years with larger periods missing in the photo documentation (1987, 1988, 1990, 1992 and 1999) is the altitude of the daily average of the 2˚C air-temperature isotherm used to distinguish between snowfall and rainfall.
Precipitation Analysis: Results
In contrast to most meteorological parameters, precipitation offers a wide range of quantities which can be analyzed in order to see any temporal changes. These include the amount of precipitation, the number of precipitation days, and the ratio of precipitation days to all days in the selected period. When we additionally distinguish between precipitation types, the possibilities for discerning potential changes are increased by considering, for example, the ratio of solid to liquid precipitation amounts, by comparing the number of days with snowfall to all days with precipitation or to all days in the selected period. In the following discussion of the precipitation type analysis for the Vernagtferner basin since 1976, we first present some time series of snowfall amounts and frequency, and then some simple statistical analyses are made between these parameters and the discharge of Vernagtferner.
Time series
In Figure 4a–d respectively, the following time series are presented: absolute accumulation amounts for the accumulation season, total point precipitation and snowfall amounts, and number of snowfall days for the ablation season. For Figure 4a, ‘1976’ refers to the accumulation period 1975/76, and the data are average values for the altitudinal range of the glacier. The ablation period amounts are taken from the records at the gauging station site, with no correction factors for wind losses and no adaptation to the glacier altitudinal range applied. The centred 5 year running average is included for every parameter (bold lines with no markings). The ablation area size as a percentage of total glacier size, i.e. the ablation area ratio, is given in Figure 4e and is discussed later.

Fig. 4. Time series for the years 1975/76–2004/05 of (a) snow amounts in mmw.e. for the accumulation period; (b) total precipitation amounts in mmw.e. for the ablation period; (c) snowfall amounts in mmw.e. for the ablation period; (d) number of days with snowfall for the ablation period; and (e) percentage of ablation area to total glacier area. Bold lines: centred running average over 5 years.
The series of accumulation season precipitation is characterized by a rather small variation, with an average of 950 mmw.e. and a standard deviation σ = 190 mmw.e. The trend is almost zero, with only a slight tendency to lower values since the mid-1980s. The lowest winter accumulation was analyzed for winter 1995/96 (490mmw.e.), and the highest in 1984/85 (1410mmw.e.). The ablation seasons, by contrast, show much more variable data, both in total precipitation (Fig. 4b) and in snowfall amounts (Fig. 4c). Total point precipitation amounts vary from <300mmw.e. (in 1980) to >600mmw.e. in 1999, and summer snowfall amounts range from <100mmw.e. (in 1982) to >300mmw.e. in 2005. As a consequence, the percentages of solid to total precipitation also display a high variability during the ablation seasons: in 1979, 2002 and 2005, snowfall delivered 60–70% of total precipitation, but there are years like 1982, 1999 and 2003 with ratios falling below 30% or even 20%. The lowest rate of solid to total precipitation (17%) is reached in the 1999 ablation season, as there was no snowfall from 22 June to 28 September, and the 360mm precipitation between these two days fell completely in the form of rain in the entire catchment. Of the 150 months of the ablation seasons 1976–2005, 21 showed monthly snowfall amounts <5 mm, but, surprisingly enough, only two of them occurred in the last 6 years, i.e. June 2003 and June 2005. Therefore, the centred running average in snowfall amounts decreased between the late 1970s and 1992 but rose during the period 1992–2005.
Lastly, we look at the number of days with snowfall in the ablation period (Fig. 4d). The variation, again, is considerable, from <20 days in 1982 and 1999 to >50 days in 1978 and 1996. A comparison with the snowfall amounts shows that snowfall intensity, defined here as the snowfall amounts divided by the number of days with snowfall, varies to some extent: for example, the rather high snowfall amount of 213mm in 1979 fell on only 21 days, whereas in 1993, 127 mm solid precipitation was distributed over 46 of the total 153 days.
In the study for the Hoher Sonnblick site (3106ma.s.l.), Reference Auer, Böhm, Leymüller and SchönerAuer and others (2002) analyzed the annual solid fraction of total precipitation for the summer seasons 1890–2000. They found that the snowfall amount decreased from nearly 90% in 1890 to about 70% in 2000. A comparison of the data from Vernagtferner and Hoher Sonnblick for the period 1976–2000 results in an increase of around 10% in rainfall amounts for both sites, in spite of the different altitudes of the stations. This could indicate that relative changes in precipitation type should be undisturbed by altitudinal effects, whereas absolute amounts typically show an altitudinal gradient.
When we compare the time series between discharge amounts (Fig. 2) and snowfall amounts in the ablation period (Fig. 4c), we see that low snowfall amounts coincide with high discharge for 1982, 1986, 1994 and 2003, which supports our hypothesis, that the albedo effect influences the meltwater production to some extent. However, in 2003, nearly the same amount of ablation period snowfall (80mmw.e.) coincided with a much higher runoff than in 1982, while for 1978 and 1984 the lowest discharge amounts of the whole series combine with just average snowfall amounts of 220 mmw.e. (1978) and 210mmw.e. (1984). When we next compare discharge to the numbers of days with snowfall in the ablation season, we see that the years 1978 and, to some extent, 1984 display high numbers of snowfall days and low discharge heights, and in 1994 and 1995 the second highest snowfall frequencies coincide with lower discharge values, though not nearly as low as in the 1970s. So, on the whole, the relation between snowfall (amounts and number of days) and runoff is not at all unambiguous, a finding which is also reflected in the statistical relations, discussed in the next subsection.
Statistical analysis
Table 3 gives linear correlation equations and coefficients between discharge, Q, and some precipitation parameters, which are analyzed regarding their influence on meltwater production and thus on discharge height of the ablation season. In addition, the statistics for air temperature and ablation area size are included.
Table 3. Statistical parameters of the relations between discharge, on the one hand, and precipitation data, air temperature and ablation area size, on the other

The very poor correlation of 0.01 between discharge height and winter mass balance is caused by the missing trend in winter mass-balance values (cf. Fig. 4a) in contrast to the clear rise in discharge over the 30 years (cf. Fig. 2, lower panel), thus confirming that glacier mass balance depends mostly on the weather conditions during the ablation season. The small correlation coefficient of 0.14 between discharge and solid precipitation in the ablation period suggests a very weak statistical dependency, as already discussed. There is a slight decline in the trend line, but the scatter is very high. The relation between discharge and number of snowfall days shows an equally high scatter, yet the tendency is correctly described.
The rather high linear correlation between air temperature and discharge heights confirms the often used parameterization of glacier runoff by air temperature, and it is also obvious that the correlation should be higher for June–September (r2 = 0.74) than for the whole ablation season (r2 = 0.60). The highest correlation coefficient is determined between ablation area size and discharge (r2 = 0.80).
Discussion
The time series of snowfall amounts and days with snowfall as well as the statistics between discharge and these quantities show that the albedo effect of newly fallen snow during the ablation period is visible in the discharge of Vernagtferner, but that it does not dominate the meltwater production, at least during most of the last 30 years. Therefore, ablation area size development is discussed below as an additional factor influencing the effectiveness of snowfall events.
As we saw in Figure 3b, the immediate effect of snowfall on a bare ice surface is quite pronounced, reducing discharge amounts from >12m3 s–1 on 28 August 2003 to about 1 m3 s–1 on 2 September. The high meltwater amount was produced over a large bare-ice area of Vernagtferner, as at the end of August 2003 more than 80% of the glacier surface was free of firn or old snow. In the 1970s and early 1980s, however, Vernagtferner had a much larger firn and old-snow area, caused by the positive mass balances during the 1970s (Reference Reinwarth and Escher-VetterReinwarth and Escher-Vetter, 1999). The considerable mass losses of Vernagtferner since 1981/82 have led to a reduction of the accumulation area and a corresponding increase in the ablation to total glacier area ratio (Fig. 4e; the data here are given for the end of the ablation seasons in the fixed date system; thus ‘1976’ stands for 30 September 1976). From 1976 to 1981, the size of the ablation area at the end of the mass-balance year amounted to about 20% of the total glacier area, but the high mass losses in 1982 and 1983 (1982 being a year with especially small summer snowfall amounts and few snowfall days) increased the size of the ablation area to 7 km2, or 75% of the glacier area, in spite of the second-highest winter accumulation of the whole series (1300mmw.e.) in 1981/82. The enlargement of the bare-ice area was interrupted in 1984 and 1985, partly by high snowfall amounts in the ablation period, but also by the highest winter accumulation amount (1984/85). The small winter accumulation of 870 mmw.e. in 1985/86, however, coincided with small summer snow amounts and rare snowfall days in the 1986 ablation period and thus added to the ablation area which increased to >80% of the glacier size. With the exception of 1999 (44%), this share never fell below 50% since the beginning of the 1990s, and reached 100% in 2003. The rise in ablation area ratio, however, was not coupled with a major reduction of total glacier size, as Vernagtferner had an overall area of 9.3 km2 in 1976 and 8.4 km2 in 2005.
This development of the ablation area ratio helps to explain the influence of ablation period snowfall on meltwater production. In the 1970s and early 1980s, the overall rise in glacier albedo due to snowfall was much slighter than in the 1990s, as part of the glacier already had a rather high albedo caused by firn and old snow. The smaller the firn and old-snow region grew, the higher was the albedo increase due to snowfall and the ensuing reduction of shortwave radiation absorption on the whole glacier. This is fairly well demonstrated by the comparison of mass-balance years 1977/78 and 1994/95. For both years, winter accumulation and snowfall in the ablation period have similar values, whereas discharge in 1995 is more than twice as high as in 1978. Using air temperature (Fig. 2, upper panel) as a parameterization quantity for the general melting situation, there is no large difference between the two years, at least for the ablation period average (2.6˚C in 1978, 3.1˚C in 1995). Therefore, the difference in discharge amounts can be mainly attributed to the differing ablation area ratio, which is 18% in September 1978 but >60% in September 1995.
Since 1999, every snowfall has covered a large bare-ice area with low albedo and thus reduced the meltwater production considerably. On the other hand, years like 2003 with extremely small snowfall amounts in summer and an ablation season with about 100 ‘hot days’, i.e. days with an average air temperature >10˚C, caused the discharge to rise to unexpected values. For the majority of the 30 years, there was an average of 50 hot days, i.e. approximately half the 2003 value. Moreover, the negative mass balances over many years led to ever darker bare ice, because the dust and the amount of gravel from the moraine increases on the surface ice layer as long as it is not washed out of the glacier by the meltwater. Thus, for Vernagtferner, we have reached a state in the year 2006 where summer snowfall is of major importance for runoff production.
Summary and Conclusions
In this study, we have investigated a possible dependency between the temporal development of discharge from Vernagtferner and precipitation type changes over the period 1976–2005, the analysis of precipitation type being based primarily on daily photographs of the glacier. Although the rise in air temperature was quite pronounced for this basin and period, this did not reduce snowfall amounts much, and a slight decrease between 1976 and 1991 was followed by an even higher rise between 1992 and 2005, mainly caused by high snowfall amounts in the ablation periods 2000–02 and 2005. In addition, snowfall frequency, i.e. the number of days with snowfall per ablation season, displayed an even greater variability, with a slight tendency to higher values since the mid-1990s. We found an important quantity controlling the discharge–snowfall relationship in the size of the ablation area, which impacts the variation of total glacier surface albedo to a major extent. This reflects the complexity of the factors controlling glacier melt on the whole, since the development of the bare-ice size over the 30 years, as well as during each ablation period, is both a result of and a precondition for the melt processes on the glacier surface.
But there are other, more methodical factors that could also influence the relationships presented here. The first is the sometimes inadequate information provided by the photographs, which influences the subsequent precipitation type analysis. Although the validation with higher resolved data for the last 4 years gave a rather good agreement, it cannot be excluded that results are worse for some of the earlier years. The daily time-step of both precipitation and photographic records can also cause a deterioration of the classification and thus of the statistics. Other parameters besides snowfall amounts and number of days with snowfall could possibly result in a better statistical relation, and perhaps we should not average over whole ablation seasons but use the temporally finer-resolved information in the original records for all parameters, including ablation area size. Thus this investigation can only be considered as a first step, as such data are needed in the high mountains since no climatology of precipitation type exists (personal communication from R. Steinacker, 2006).
Acknowledgements
The collection of long-term, reliable data series over several decades in a high alpine research area depends on numerous colleagues who are dedicated to their sometimes strenuous work. Only a few can be mentioned here: O. Reinwarth, E. Heucke, L. Braun and M. Weber. S. Braun-Clarke improved the paper’s English. We are grateful to two unknown referees for constructive and extensive recommendations. Funding from Deutsche Forschungsgemeinschaft (DFG), the Federal Ministry of Education and Research of Germany (BMBF), the Thiemig Foundation, and the Academy Research Programme III.B.1 of the Federal Republic of Germany and the State of Bavaria is gratefully acknowledged.


