


Introduction
Glaciers move by a combination of internal deformation and basal motion, the latter involving sliding at the ice–bed interface and/or the deformation of subglacial sediment. Knowledge of the relative importance of these mechanisms, how they vary spatially and temporally, and what controls this variability is crucial to an understanding of glacier and ice-sheet dynamics and the representation of these mechanisms in numerical models. Several studies have measured surface motion, calculated internal deformation from Glen’s flow law, and estimated basal motion as the residual (see Reference Copland, Harbor, Minner and SharpCopland and others, 1997b; Reference Gudmundsson, Bauder, Luthi, Fischer and FunkGudmundsson and others, 1999; and references therein). The problem with this method is that the accuracy of Glen’s flow law in these circumstances is unknown since it assumes that the local shear strain rate is controlled by the local shear stress, and it ignores variations in ice rheology and the effects of longitudinal stress gradients (Reference Blatter, Clarke and ColingeBlatter and others, 1998). Other studies have measured surface motion and then used inverse force-balance techniques to calculate basal drag, as a surrogate for basal motion (Reference Hooke, Calla, Holmlund, Nilsson and StroevenHooke and others, 1989; Reference Van der Veen and WhillansVan der Veen and Whillans, 1993; Reference Iken and TrufferIken and Truffer, 1997; Reference Mair, Nienow, Willis and SharpMair and others, 2001). Although longitudinal stress gradients are accounted for in this approach, they are calculated on the basis of surface strain rates that are assumed to be constant with depth. Consequently, the method can only be applied over spatial scales greater than a few ice depths. Other studies have attempted to measure basal motion directly in natural cavities, artificial tunnels or at the base of boreholes using photography, video or purpose-built instruments (see Reference Gudmundsson, Bauder, Luthi, Fischer and FunkGudmundsson and others, 1999 and references therein; Reference HubbardHubbard, 2002). Such studies tend to measure basal motion over a spatially restricted area and over time-scales of hours to weeks, and the results cannot easily be extrapolated to broader spatial scales or longer time-scales. Furthermore, such studies have not usually been combined with measurements of surface motion and have therefore not been able to determine the contributions of internal deformation and basal motion to overall flow.
Repeat borehole inclinometry has successfully been used to examine the contribution of internal deformation (and, by subtraction, basal motion) to net glacier motion over time-scales of months to years (see Reference Copland, Harbor, Minner and SharpCopland and others, 1997b and references therein; Reference Harbor, Sharp, Copland, Hubbard, Nienow and MairHarbor and others, 1997; Reference Harper, Humphrey and PfefferHarper and others, 1998). However, on slow-moving glaciers such as Haut Glacier d’Arolla, Switzerland, repeat inclinometry cannot be used to resolve the components of surface motion at time-scales less than about 1year (Reference Copland, Harbor, Minner and SharpCopland and others, 1997b). Recently, englacial tiltmeter records collected by data logger at high temporal resolution have been used to reconstruct the ice-deformation profile and the contributions of ice deformation and basal motion to surface flow (Reference Gudmundsson, Bauder, Luthi, Fischer and FunkGudmundsson and others, 1999).While the technique was applied to just one borehole on the centre line of Unteraargletscher, Switzerland, over a 2 year period, the high sensitivity of tiltmeters and their ease of manufacture means that the technique has the potential to work over large areas and over much shorter time intervals.
The overall aim of this paper is to use surface motion measurements, englacial tiltmeter records and repeat inclinometry data to determine patterns of surface, internal and basal motion across the tongue of a temperate valley glacier over a variety of temporal scales ranging from days to months. We interpret the findings with reference to contemporaneous measurements of subglacial water pressures, and in terms of what we already know about the hydrology of the glacier.
Methods
Field site
Haut Glacier d’Arolla is a ∼ 6.3 km2 , ∼ 4.0 km long temperate valley glacier in Valais, Switzerland (45°58’N, 7°32’ E), ranging in elevation from ∼2560 to 3500ma.s.l. (Fig. 1). During each of the summers of 1992–99, an array of boreholes was drilled ∼1.5 km from the glacier snout and east of the glacier centre line (Fig. 1). On average, ∼ 2 5 boreholes were drilled each year, ranging in depth from ∼ 3 0 m near the margin to >130m on the centre line, and these have been used to study the englacial and subglacial hydrology (B. Reference Hubbard, Sharp, Willis, Nielsen and SmartHubbard and others, 1995, Reference Hubbard, Blatter, Nienow, Mair and Hubbard1998; Reference Copland, Harbor and SharpCopland and others, 1997a; Reference Kulessa and HubbardKulessa and Hubbard, 1997; Reference Gordon, Sharp, Hubbard, Smart, Ketterling and WillisGordon and others, 1998, Reference Gordon2001) and geochemistry (Reference LambLamb and others, 1995; Reference Tranter, Lamb, Sharp, Brown, Hubbard and WillisTranter and others, 2002) of this part of the glacier. Boreholes drilled in 1995 and 1996 were also used to calculate annual patterns of surface, internal and basal motion in a cross-section of the glacier from the centre line to the eastern margin using repeat inclinometry techniques (Reference Harbor, Sharp, Copland, Hubbard, Nienow and MairHarbor and others, 1997). Analysis of several boreholes drilled in this area in 1998 and 1999 forms the basis of the work presented in this paper. The boreholes were drilled with reference to a subglacial drainage axis that ran down the eastern half of the glacier during the early to mid-1990s (Reference SharpSharp and others, 1993; Reference Hubbard, Sharp, Willis, Nielsen and SmartHubbard and others, 1995). The axis location is controlled largely by the glacier geometry but also by the position of moulins. Changes in glacier geometry and moulin position may have altered the precise location of this axis since it was first identified, but, for the purposes of this paper, we refer to the axis as it existed in the early to mid-1990s.The axis transports surface-derived waters and evolves from a distributed to a channelized morphology during the early summer (Reference Gordon, Sharp, Hubbard, Smart, Ketterling and WillisGordon and others, 1998; Reference Nienow, Sharp and WillisNienow and others, 1998). In late summer, it consists of a channel bounded laterally by subglacial sediments. During the day, water and water-pressure waves are forced out of the channel into the surrounding sediments and possibly a thin film between the glacier sole and the sediments, and at night water and water-pressure waves are driven back to the channel (Reference Hubbard, Sharp, Willis, Nielsen and SmartHubbard and others, 1995). Pressure fluctuations in the channel affect areas of the bed up to ∼70 m either side (Reference Hubbard, Sharp, Willis, Nielsen and SmartHubbard and others, 1995).

Fig. 1. Haut Glacier d’Arolla, showing the location of the seven borehole sites. The sites are labelled according to their position the glacier (U, upper; M, middle; L, lower) and across glacier (A, over the axis; C, near the centre line; B, between the the centre line). Contours are shown for the glacier surface (solid) and bedrock (dashed).
Inclinometry
In late May and early June1998, four boreholes were drilled to the bed at seven sites on the glacier tongue, giving 28 boreholes in total (Fig. 1). Sites UA, MA and LA were located along the centre of the subglacial drainage axis. Sites UB, MB and LB were positioned ∼70m west of the axis. Site MC was located a further ∼70 m to the west, near the glacier centre line. All boreholes were inclinometered within 2 days of being drilled, using a MountainWatch Inc. digital borehole inclinometer.The inclinometer consists of a flux-gate magnetometer and two tilt transducers housed in a 2 m long stainless-steel tube. The inclinometer is connected via a control box to a portable computer. The tilt and azimuth of the inclinometer were recorded at intervals of 1m along the borehole. The measurements were made as the instrument was both lowered down and raised up the borehole, and the final profile was constructed from the mean of the two sets of readings. This gives measurements that are accurate to ∼0.5% of ice depth (cf. Reference Copland, Harbor, Minner and SharpCopland and others, 1997b). Software developed by Icefield Instruments Inc. was used to resolve the tilt and azimuth data into a north– south profile (approximately along glacier) and an east– west profile (approximately across glacier), and trigonometry was used to produce a profile in the flow direction.
In August 1999, six of the original 28 boreholes (one borehole each at six of the seven sites) were re-drilled to the bed using a cable-following drill tip. Unfortunately, none of the boreholes at site UA could be re-drilled to the bed because the water in the boreholes drained when the drill tip reached an englacial connection at ∼ 80 m depth, making further drilling impossible. The six boreholes were re-inclinometered within 2 days of being re-drilled, using the same procedure as in 1998 (Table 1).The data were again used to calculate along-glacier, across-glacier and flow-direction profiles. Subtraction of the original profiles from the new profiles was used to determine the vertical variations in velocity through the glacier.
Table 1. Inclinometry and surface survey dates. Dates given as days since 1 January 1998

Borehole instrumentation
In May/June 1998, a suite of instruments was deployed at each of the seven sites, including a pressure transducer (to monitor subglacial water pressure); and an englacial tiltmeter at 50% and 90% of ice depth (with which to construct the internal deformation profile). In August 1998, additional englacial tiltmeters were placed at 75% of ice depth at site MB and 100% of ice depth (0.5m above the bed) at sites MA and MB in order to reconstruct the internal deformation profiles at these sites more accurately. Each pressure transducer consists of a GEMS Sensors 2000A 1–16 bar transducer in stainless-steel housing. They were calibrated in the field by lowering and raising them in an inclinometered water-filled borehole. Repeat calibrations suggest that they have an accuracy of ±0.25m. Each englacial tiltmeter consists of a single Fredericks Company, proportional non-linear dual-axis miniature electrolytic tilt sensor are (0717 2201) housed and sealed into a 0.8 m long stainless-steel rod. The sensors were similar to those used to monitor subglacial sediment deformation and described by Reference Blake, Clarke and GerinBlake and others (1992) and Reference Porter and MurrayPorter and Murray (2001).The output from each tiltmeter consists of two voltage signals (one for each axis). These are converted to tilt and relative azimuth data using a purpose-written inversion program (based on Reference Blake, Clarke and GerinBlake and others, 1992).
Surface motion
The tops of all 28 boreholes were surveyed within 4 days of being inclinometered in May/June 1998 and were resurveyed within 4 days of being re-inclinometered in August 1999 (Table 1). These data were used to calculate surface velocities over the whole measurement period. Additional surveys were made at regular intervals throughout the spring and summer of 1998 and 1999, from which seasonal surface velocities were derived. Surveys were conducted using a Geodimeter 400 total station from a survey station at the eastern margin of the glacier tongue with reference to three stationary reference points fixed within the Swiss Grid (Fig. 1). The instrument accuracy is ±(2mm +3 ppm) which corresponds to 5 ± 3 mm over the distances surveyed.This corresponds to velocity errors of <5% over the shortest 10 day time period considered here and negligible errors over longer intervals.
Results and Discussion
Repeat inclinometry
The vertical variations in horizontal velocity (borehole deformation profiles) at the six sites are shown in Figure 2. The boreholes at sites MB, MC, LB and UB, which are located away from the drainage axis, show classic deformation profiles, with greatest velocities at the surface declining very gradually and quasi-linearly with depth to ∼70% of ice depth, and then more steeply to the bed. The ratio of basal velocity to surface velocity was ∼ 5 0% at site UB, ∼60% at sites MB and MC and ∼65% at site LB. These values are similar to those found for this part of the glacier by repeat inclinometry between 1995 and 1996 (Reference Harbor, Sharp, Copland, Hubbard, Nienow and MairHarbor and others, 1997). Similar results were also found on Worthington Glacier, Alaska, U.S.A., where annual basal velocities accounted for 60–70% of the annual surface motion in an area around the centre line of the upper ablation area, where ice depths were ∼200m (Reference Harper, Humphrey and PfefferHarper and others, 1998). Slightly higher ratios were found in the ablation areas of both Athabasca Glacier, Canada (ice depths ∼300m), and Storglaciaren, Sweden (ice depths ∼150 m), of ∼85% on the centre line and ∼70–75% halfway to the margin (Reference RaymondRaymond,1971; Reference Hooke, Pohjola, Jansson and KohlerHooke and others, 1992).

Fig. 2. Horizontal velocity profiles in the ice-flow direction of six boreholes between May/June 1998 and August 1999. Horizontal exaggeration ×10.
The profiles at sites MA and LA, located on the drainage axis, contrast sharply with expected profiles (Fig. 2). At site MA, velocities were fairly constant from the surface to ∼50% ice depth and then increased to ∼85% ice depth. Thereafter, velocities decreased sharply and linearly over the remaining 13 m to the bed. At site LA, velocities increased to ∼80%ice depth and then also decreased sharply and linearly over the remaining 19 m to the bed. Basal velocity is similar to surface velocity at site LA, but two times greater than surface velocity at site MA. Thus, the boreholes at sites MA and LA are characterized by local extrusion flow. Local extrusion flow was also recorded on this glacier in the vicinity of site MA between 1995 and 1996 (Reference Harbor, Sharp, Copland, Hubbard, Nienow and MairHarbor and others, 1997). In this earlier study, surface speeds were ∼8.25 ma−1, but maximum speeds of ∼9.75 ma−1 were reached at ∼ 5 0% of ice depth (Reference Harbor, Sharp, Copland, Hubbard, Nienow and MairHarbor and others, 1997, fig. 2 D). In this study, surface speeds were comparable, but maximum speeds of ∼16ma− 1 were reached at ∼85% of ice depth.
Extrusion flow was also implied from long-term englacial tiltmeter measurements in a ∼300m long borehole drilled on the centre line in the ablation area of Unteraargletscher, where annual basal motion was estimated to be ∼120% of annual surface movement (Reference Gudmundsson, Bauder, Luthi, Fischer and FunkGudmundsson and others, 1999). Similarly, extrusion flow was measured in a 126m deep borehole down-glacierfroma riegel on Storglaciaren, where basal motion was ∼500% of surface motion for a 3 week period in July (Reference Hooke, Holmlund and IversonHooke and others, 1987).
We interpret our observed local extrusion flow in terms of enhanced basal motion associated with water flow along the preferential drainage axis. Penetrometer tests at the base of boreholes drilled above the axis suggest that a subglacial sediment layer is either very thin or absent, so basal motion likely comprises sliding rather than sediment deformation. Furthermore, we know from visits in November, January and March that water continues to flow from the glacier throughout the winter, and chemical analysis of the water suggests it flows subglacially. Thus, we envisage the continuous flow of water along the drainage axis throughout the year is sufficient to lubricate the bed here and promote rapid sliding. Numerical modelling experiments for this section of the glacier show that previously observed annual patterns of local extrusion flow can be recreated assuming a composite, time-weighted average of 20 weeks no sliding, 20 weeks moderate sliding and 12 weeks enhanced sliding (A. Reference Hubbard, Blatter, Nienow, Mair and HubbardHubbard and others, 1998). Local extrusion flow has also been modelled for an idealized sinusoidal bed and may be expected to occur both above the crest and above the trough of a sinusoid (Reference GudmundssonGudmundsson,1997). Our observed profiles show some similarity with the modelled patterns above the crest of a sinusoid with a velocity maximum just above the bed (Reference GudmundssonGudmundsson,1997, fig. 2). Further modelling is required to examine whether our observed local extrusion flow is due to the occurrence of a slippery spot, abump or some combination of the two.
Englacial tiltmeters
The dual-axistilt and azimuth data were used to resolve the tilt in the direction of ice flow using the procedure described by Reference Blake, Clarke and GerinBlake and others (1992) and Mair and others (personal communication, 2002). The long-term records of englacial tilt in the ice-flow direction at the six sites are shown in Figure 3. Despite gaps in these records, the data indicate that at all sites, with the possible exception of site MC, the longterm tilt rate is greater at 90% ice depth than at 50% ice depth. It is difficult to identify the long-term tilt rate at 50% ice depth at site MC due to the erratic behaviour during spring and summer 1999. At sites MA and MB, the long-term tilt rates at 100% ice depth are greater than at 90%. And at site MB, tilt rates at 75% ice depth are similar to those at 50%.Therecords can be split into distinct periods during which certain trends can be observed. The records generally show long periods of steady linear tilt rates during the autumn/winter period (August 1998–March 1999). The tilt records during both the 1998 and 1999 spring/summer periods, however, are more erratic. They show: (i) medium-term (days to weeks) trends in tilt rate; (ii) short-term (hours to days) fluctuations in tilt rates superimposed on the medium-term trends; and (iii) short-term jumps in tilt rate that break the medium-term trends. This erratic behaviour occurs at all recorded depths in both spring/summer periods, although it is particularly marked at 50% ice depth at site MC during the 1999 spring/summer. We interpret the tiltmeter records in terms of slow ductile deformation that predominates during the autumn and winter, and ductile deformation interspersed with brittle fracture associated with ice-quake activity during the spring and summer. Brittle fracture was particularly marked during spring events, and is discussed in more detail by Mair and others (personal communication, 2002). It is possible that some of the erratic behaviour during spring and early summer 1998 may have been due to movement of the tiltmeter within the borehole rather than movement of the borehole itself. However, our experience suggests that boreholes tend to close around instruments and cables within a few weeks unless they are kept open by reaming or manual probing. The erratic behaviour during late summer 1998 and spring and summer 1999 must therefore be due to movement of the borehole, not the instrument. We also rule out the possibility of electronic noise to explain the erratic behaviour, since the short-term fluctuations and jumps affected each instrument uniquely. There were instances when one tiltmeter was affected but another in the same borehole was unaffected even though the same data logger controlled the two instruments. Conversely, there were occasions when several instruments responded in similar ways even though they were in separate boreholes controlled by different data loggers. There are four instances where tilt rates seem unusually large. These are at 90% ice depth at site MB in late summer 1998 (∼3° d−1) and spring 1999 i∼025° d−1), and at both 9 0% ice depth (until 5 September) and 5 0% ice depth (until 22 September) at site MC in early autumn 1998 (both ∼0.25° d−1). We are unsure of the reasons for these unusually large tilt rates and discount these periods from our calculations of seasonal deformation profiles presented below.

Fig. 3. Long-term records of englacial tilt in the ice-flow direction at six borehole sites: thick dark lines, 50% ice depth; thin dark lines, 90% ice depth; thick light lines, 100% ice depth; thin light lines, 75% ice depth. A vertical tiltmeter has a tilt of zero; negative tilts mean the meter is dipping down-glacier; positive tilt occurs when the meter is dipping up-glacier.
Subglacial water pressures
Long-term records of subglacial water pressures are shown in Figure 4. Despite some gaps, records show generally high and stable water pressures, around ice overburden, during the autumn/winter. Records at sites MA and LA, on the drainage axis, are very stable over the autumn/winter. Pressures at sites away from the axis are slightly more variable. Pressures at sites MC and UB away from the axis gradually rise during autumn and early winter 1998, reaching a peak on day 340. Pressures then drop dramatically at site MC and more gradually at site UB until day 343, before rising rapidly again to ice overburden by day 350 at site MC, while continuing to fall, though at a slower rate, at site UB. The record at site UB shows a further disturbance between days 375 and 390, during which pressures rise to ice overburden before declining once more.

Fig. 4. Long-term records of subglacial water pressure at seven borehole sites. iob on vertical axes refers to ice overburden pressure. The horizontal line at 100% iob is therefore the flotation level.
During the spring and summer, records are generally more variable than during the autumn/winter. The rapid water-pressure fluctuations that are particularly marked at sites M A on the axis and LB 70 m west of the axis during spring 1998, centred on days 158 and 173, are associated with spring speed-up events. Similarly, the fluctuations in spring 1999 beginning around day 552 are also associated with a spring event. These spring events are discussed in more detail by Mair and others (in press).
We interpret many of the short-term (daily) water-pressure fluctuations, especially during the spring and summer, in terms of melt- and rain-induced variations in surface water inputs, which are the cause of glacier motion events (Mair and others, in press). However, other pressure fluctuations, including those during the autumn/winter but others during the summer (e.g. the rapid drop at site MC and the fast rise at site UA, both centred on day 560, and the sudden drop at site LB, centred on day 570), are caused by boreholes connecting to and disconnecting from a subglacial drainage system and may be an effect of glacier motion events.
Comparison of inclinometer and tiltmeter data
In this subsection we compare the long-term tilt rates measured by the tiltmeters with those determined by repeat inclinometry At each of the six sites, the borehole containing the tiltmeters was not the same as that used for repeat inclinometry. However, the boreholes used for comparison were located within 2 m of each other at the surface, which should produce negligible discrepancies between the two sets of measurements. The time interval over which tilt rates were determined using the inclinometry method varied between 438 and 459 days, but, due to the erratic behaviour of some of the tilt cells during the spring/summer periods, tilt rates were determined from the tiltmeters for the autumn/winter period only. For sites MA, MB, MC and UB, records were 151–218days long. For sites L A and LB, however, records were only 33–36 days long due to missing data. For these sites where erratic behaviour was negligible during the 1999 spring/summer, we also calculated longterm tilt rates from the tiltmeter data over longer time intervals (autumn 1998–autumn 1999), but these were virtually identical (±3%) to those determined for the short autumn/ winter period alone. To be consistent across all sites, we use the autumn/winter data only in our comparison, as it appears that these are generally representative of the overall annual deformation pattern.
The procedure for calculating the tilt rates from the inclinometry data is as follows. First, at the equivalent depth in the inclinometry borehole at which a tiltmeter is located, the x; y; z coordinates of the borehole at the time of initial inclinometry (t = 1) and the time of subsequent re-inclinometry (t = 2) are used to calculate the flow direction. Second, for both t = 1 and t = 2, the x; y; z co-ordinates at the appropriate depth and 1 m above that depth are used to calculate the tilt angle of the borehole resolved in the flow direction. Third, the change in tilt angle in the flow direction is calculated between the two time periods and expressed in units of ° a−1. Finally, these steps are repeated for 3, 5, 7 and 9 m long borehole sections centred on the original 1m long section. This produces five estimates of tilt-angle change which are used to calculate a mean.
Table 2 shows the data used to derive the two sets of tilt-rate estimates that are compared in Figure 5. There is a very good match between the tilt changes derived from the tiltmeters and those calculated from the inclinometry records, with an overall coefficient of variation of 0.94. The mean absolute difference isjust 1.0° a−1.
Table 2. Comparison of tilt rates determined by tiltmeters and inclinometry. Dates are given as days since 1 January 1998


Fig. 5. Comparison of tilt-angle changes measured by the tiltmeters with those determined by repeat inclinometry.
Seasonal surface, internal and basal velocities
In this subsection, we divide the total time between inclinometry measurements (May 1998–August 1999) into five seasonal periods on the basis of the surface-velocity, englacial-tiltmeter and subglacial water-pressure measurements. The rationale behind this is that the hydrological and dynamic regimes of the glacier appear to be similar within these five periods but different between them. Previous modelling of the glacier flow regime at Haut Glacier d’Arolla suggests this is a reasonable assumption (A. Reference Hubbard, Blatter, Nienow, Mair and HubbardHubbard and others, 1998). The five periods are:
Spring events 1998: 4–7 and 21–28 June (days 155–158 and 172–179) = 10 days
Summer 1998*: 30 May–14 August (days 150–226) = 66 days
Autumn 1998/winter1999:14 August–20June (days226– 536) = 310 days
Spring event 1999: 29 June–9 July (days 545–555) = 10 days
Summer 1999*: 20 June–16 August (days 536–593) = 47 days
In the rest of this subsection, we use the surface-velocity and englacial-tiltmeter data to determine patterns of surface, internal and basal motion for the five seasonal periods. For each period, surface velocities were determined from the survey data, internal velocity profiles were determined from the englacial-tiltmeter data, as explained below, and basal velocities were calculated as the residual. Internal velocity profiles were determined for each site as follows.
First, the tiltmeter records over the autumn/winter period were used to construct the entire velocity profile for the year. Regression lines were fitted to the tilt-angle vs time data, and the slopes of the lines were used to calculate the long-term tilt rates. Then several velocity profiles were constructed under the assumption that each tiltmeter was representative of certain depth ranges. For example, a profile was based on the assumption that the tiltmeter at 90% ice depth was representative of the depth range 100–90%, that the meter at 50% ice depth was representative of 90–50% and that there was no tilt from 50% ice depth to the surface. At the other extreme, a profile was based on the assumption that the tiltmeter at 90% ice depth was representative of the depth range 100– 70%, that the meter at 50% ice depth was representative of 70–30% and that there was no tilt from 30%ice depth to the surface. The resulting internal velocity estimates were compared with those measured by repeat inclinometry over the whole measurement period to find the best match. Because of the anomalous inclinometry profiles at sites MA and LA on the drainage axis (above), we could only construct the profiles for the remaining sites MB, MC, LB and UB using this method. The depths over which the tiltmeters were found to be representative are shown in Table 3.
Table 3. Depths (%) over which tiltmeters are representative
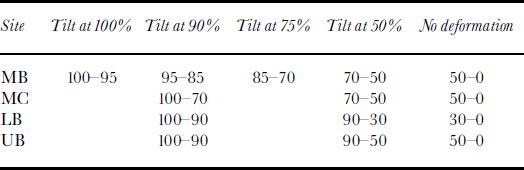
We then assumed that the representative depths shown in Table 3 applied to the other seasonal time periods as well. For each of the seasonal time periods and for each tiltmeter, the tilt value at the beginning of the period was subtracted from the tilt value at the end of the period to give total change in tilt. As mentioned above, the four instances where tilt rates seem unusuallylarge (i.e. site MB at 90% ice depth in late summer 1998 and spring 1999 and site MC at both 90% and 50% ice depth in early autumn 1998) were excluded from the analysis. Furthermore, where a large jump in tilt occurred, presumably due to brittle fracture, the raw data were corrected to remove the jump, as it would be misleading to extrapolate the effects of a local fracture across several tens of metres of ice depth. The changes in tilt were divided by time to yield mean tilt rates. Using these tilt rates and the representative depth ranges given in Table 3, the internal velocity profiles were calculated for sites MB, MC, LB and UB for each time period.
The resultant surface, internal and basal velocities for the four sites are shown in Figure 6. For each of the five time periods discussed above, the average water pressures for all seven sites were also calculated (Table 4).To help identify the general patterns of behaviour, data for the 1998 and 1999 spring events and for the 1998 and 1999 summers were averagedto produce the spring and summer data shown in Figure 6 and Table 4 .The data show the following characteristics.

Fig. 6. Surface, internal and basal velocities during the spring events, the summer period and the autumn/winter period MB, MC, LB and UB. The spring-events period and the summer period are the average of data for 1998 and 1999.
Table 4. Mean water pressures (% ice overburden) during the seasonal periods. Spring and summer data are the average of 1998 and 1999

Spring events
During the spring events, average water pressures are just below or just over ice over burden at the upper and middle sites MA, MB, MC, UA and UB, but well below ice overburden at sites LA and LB, located down-glacier (Table 4). Surface velocities were everywhere 40.06md−1, about twice as high as the summer average (Fig. 6). Basal motion makes up most of the surface motion at site UB and to a lesser extent sites MB and MC, but only a small component of surface motion at site LB, located down-glacier. Thus, the evidence suggests that the spring events are directly forced by high water pressures in the upper tongue, but indirectly forced by pushing from up-glacier in the lower tongue, where ice deformation is unusually high due to a large longitudinal stress gradient.
Summer
During the summer, surface velocities typically drop to less than half their values during the spring events (Fig. 6). Basal motion makes up ∼ 5 0% of surface motion at sites LB and UB, but only 15% of surface motion at site MB. At sites MA, MB and MC in the middle array, average water pressures are substantially lower than they are during the spring events, especially at sites MA and MC, dropping to below ice overburden (Table 4). At sites UA and UB in the upper array, mean water pressures are similar to those recorded during the spring events, although they remain over 90% of ice overburden. At sites LA and LB in the lower array, water pressures remain well below ice overburden, decreasing at site LA but increasing at site LB. Thus, the lower velocities during the summer compared to those during the spring events are due to a reduction in basal motion at sites MB and UB and a decrease in ice deformation at site LB. Basal motion drops to ∼25% of its spring-event value at the upper array (site UB) where water pressures remain high (sites UA and UB). It drops to ∼12% of its spring-event value in the middle array (site MB), where water pressures drop slightly at site MB but drop substantially either side (sites MA and MC). Finally, in the lower array (site LB), basal motion is the same as during the spring events, where water pressures remain well below ice overburden (sites LA and LB). Thus, the evidence suggests that site MB becomes a sticky spot during the summer as water pressures drop either side, even though local water pressures remain high.
Autumn/winter
During the autumn/winter, surface velocities drop to ∼75% of their summer value (∼35% of their spring-event value) (Fig. 6). At site MB, the relative contributions of internal deformation and basal motion to surface movement are similar to those during the summer, with negligible basal motion. Conversely, at sites LB and UB, both the absolute magnitude and the relative contribution of basal motion to surface movement are greater during the autumn/winter than during the summer. At site LB, basal motion is higher than during the spring events. At the middle array, water pressures have risen to greater than ice overburden at sites MA and MC, but have dropped to ∼ 9 0% of ice overburden at site MB (Table 4). At site LA in the lower array, average water pressure increased substantially from its average summer value to near ice overburden. In the upper array, the average water pressure at site UB was much lower than during the summer (∼45% of ice overburden), but there was an event during earlyJanuary during which water pressures rose to over ice overburden for 10 days (Fig. 4). This event did not occur at the other sites. Unfortunately, we do not know what average water pressure was at site UA, but if the behaviour at the other sites on the drainage axis (sites MA and LA) is representative, pressures would also have risen to around ice overburden. Thus, the evidence implies that site MB remained a sticky spot during the autumn/ winter as pressures dropped, even though pressures had risen at sites MA and MC either side. By contrast, sites LB and UB were relatively slippery. We do not know the pattern of water pressure at site LB during the autumn/winter, but the pattern at UB suggests that the slippery spot there may have been due to a short-term (10 day) increase in water pressure to overburden rather than simply a sustained high water pressure.
Conclusions
We have used records of surface motion, englacial tilt and repeat inclinometry to determine patterns of surface, internal and basal motion across the tongue of Haut Glacier d’Arolla over a variety of temporal scales ranging from days to months. We have interpreted the findings with reference to contemporaneous measurements of subglacial water pressures, and in terms of prior knowledge of the subglacial drainage-system structure.
The long-term inclinometry data show unusual internal deformation profiles over a subglacial drainage axis with pronounced extrusion flow. This confirms earlier results reported for this part of the glacier by Reference Harbor, Sharp, Copland, Hubbard, Nienow and MairHarbor and others (1997), but shows even more pronounced extrusion flow that extends further down-glacier than previously known. Our data add to the increasing body of evidence that suggests that extrusion flow may be a common feature of many glaciers where local conditions promote marked reductions in basal drag (Reference Hooke, Holmlund and IversonHooke and others, 1987; Reference Gudmundsson, Bauder, Luthi, Fischer and FunkGudmundsson and others, 1999). Away from the subglacial drainage axis, deformation profiles are more conventional, with basal velocities ∼60–70% of surface velocities. These are comparable to values measured on this part of the glacier in previous years (Reference Harbor, Sharp, Copland, Hubbard, Nienow and MairHarbor and others, 1997) but somewhat lower than values reported from other glaciers (Reference RaymondRaymond, 1971; Reference Hooke, Pohjola, Jansson and KohlerHooke and others, 1992).
As far as we know, this is the first study to compare longterm englacial tiltmeter data with long-term inclinometry data. Tilt rates derived using both techniques correspond closely (r2 = 0.94).
We have developed a technique for using englacial tiltmeter data to reconstruct internal velocity profiles over seasonal intervals. This is useful, as inclinometry cannot accurately be used to derive deformation profiles over time periods less than about 1year on slow-moving glaciers (Reference Copland, Harbor, Minner and SharpCopland and others, 1997b). Our technique allows us to decompose surface velocities into internal deformation and basal motion over time intervals ranging from days to months. Thetechnique assumes that englacial tiltmeter data are representative of certain depth ranges and that these representative depth ranges do not change between seasons. It would be useful to test this assumption in future by deploying more tiltmeters per borehole.
Results indicate that at four locations covering an area ∼280m along glacier and ∼70 m across glacier, patterns of surface velocity were similar between seasons, even though magnitudes were greater during spring events than during summer, and autumn/winter magnitudes were lower still. However, results show that patterns of internal deformation and basal motion differed between seasons. In particular, during spring events, high surface speeds were due to very high basal motion in the upper and middle parts of the study area and high deformation rates in the lower part. During the summer, however, internal deformation and basal motion were approximately equal in the upper and lower parts of the study area, but basal motion was much smaller than internal deformation in the middle part. The differences were even more marked in the autumn/winter, when basal motion was greater than ice deformation in the upper and lower arrays but less than ice deformation in the middle array. The results can be interpreted in terms of seasonally migrating sticky and slippery spots. Patterns ofbasal drag appear to reflect changing water-pressure distributions, particularly the degree to which pressures approach or exceed ice overburden. Our results compare favourably with those from Storglaciaren, where variations in the proportions of internal deformation and basal motion were measured during three summers, but contrast with those from Worthington Glacier, where no such variations were measured over a summer (Reference Hooke, Pohjola, Jansson and KohlerHooke and others, 1992; Reference Harper, Humphrey and PfefferHarper and others, 1998).
It is often assumed that basal motion drops to zero during the winter months. An important conclusion of our work is that while this might be true in certain regions (e.g. site MB), it is not ubiquitous. In fact, basal motion may even increase during winter months compared with summer months in certain areas (e.g. site UB). This increase may be due to short-term increases in water pressure lasting a few days, which may result from hydraulic adjustments as the subglacial drainage system shrinks in response to declining discharges.
Acknowledgements
The work was supported by U.K. Natural Environment Research Council grant GR3/11216. The paper was written while D. Mair was in receipt of a Leverhulme Trust Fellowship. We thank M. J. Sharp and H. Blatter for stimulating discussions during the formulation of this research, and A. Hayes for help with the design and fabrication of the pressure transducers and englacial tiltmeters. Fieldwork was carried out with valiant help from K. Arn, G. Leysinger, R. Middleton, T. Schuler, D. Swift and several others associated with the Arolla Glaciology Project. We thank Grande Dixence SA,Y. Bams,V. Anzevui and P. and B. Bournissen for logistical support in Switzerland. The constructive reviews by G. H. Gudmundsson, M. Luthi, N. Span and A. Vieli helped to improve the original version of the paper.


