


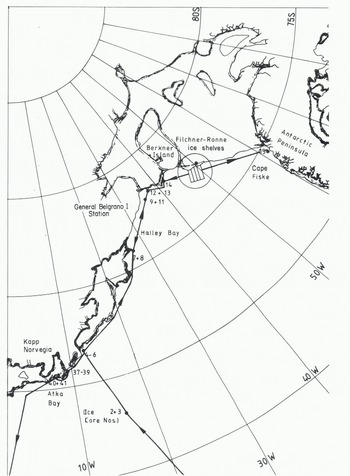
Fig. 1. Route of expedition ship Polarsirkel and location of ice-core collections.
Sea-Ice Conditions
As an aid to forming an overall view of the sea-ice conditions, i.e. the extent of the ice cover and especially of the polynya north of the Filchner ice shelf, an instrument for receiving satellite pictures, Skyceiver IV, was installed on board the expedition ship Polaveivkel. This instrument was adjusted to receive infrared and visual pictures from NOAA 6 and TIROS-N satellites. The area covered by one picture from TIROS-N is 7 000 km from north to south, and 5 000 km from east to west.
The satellite picture from 3 January 1980 (Fig.2.) showed the ice-free zone in front of the Filchner and Ronne ice shelves extending almost up to the base of the Antarctic Peninsula. The picture was received when the expedition ship was sailing close to General Bel grano I station. On the basis of such pictures it was decided to sail as fast as possible along the front of the Filchner and Ronne ice shelves toward the Antarctic Peninsula in order to inspect the whole length of the ice front for a potentially suitable site for the German station. The most westerly position in the southern Weddell Sea was reached on 5 January 1980 without any difficulty. No other ship has sailed this far west before. The overall extent of the polynya did not change very much until the ship left the Filchner and Ronne ice shelves on 10 February 1980 (Fig.3.). The quality of the satellite pictures was good enough to form an overall picture of the sea-ice conditions and to help the ship’s captain in deciding, for example, how far into the polynya he could navigate. The resolution of the pictures was, however, not sufficient to detect small leads or difficult ice areas, which would provide important information for the selection of optimal shipping routes if the ship had to navigate through ice of high concentration.
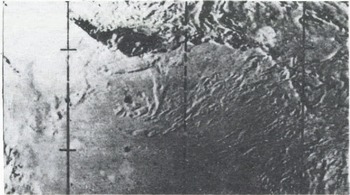
Fig. 2. Satellite picture of ice conditions in the southern Weddell Sea on 3 June 1980.
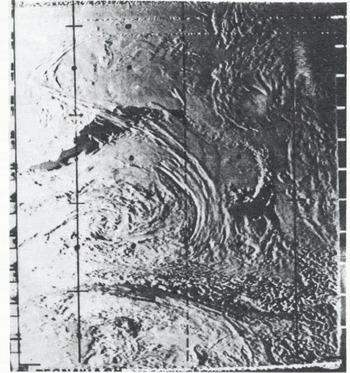
Fig. 3. Satellite picture of ice conditions in southern Weddell Sea on 24 January 1980.
During the first two weeks of the site investigation at Filchner station (77˚00’S, 50°07’W) only a small (about 200 m) strip of broken ice (1.5 m thick) was pushed by the flood stream against the ice shelf (tidal elevation 2.60 m (Gammelsred and Slotsvik 1981). At low tide this ice moved parallel to the ice shelf in a north-westerly direction. On 23 January 1980 a large part of the fast ice east of Filchner station and off Gould Bay broke up (Fig.4.) due to sea waves from northerly directions. These ice floes moved with the current from the Weddell Sea parallel to the remaining edge of the fast ice and to the ice shelf. The maximum width of this belt of drifting ice was 15 to 20 km. Its mean speed over 24 h was about 0.5 km h−1.
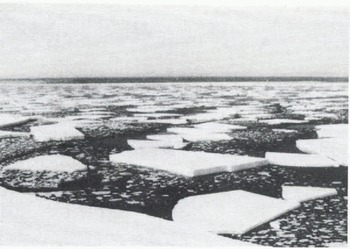
Fig. 4. Polarsirkel escapes from danger due to large ice floes.
By locating several marked ice floes over a time interval of 24 h, a drift profile normal to the ice border was established which shows the effect of the flood stream and the shear stresses between the ice floes themselves and the edge of the fast ice on the drift velocity (Fig.5.). Most of this broken-up and westward-drifting ice was multi-year sea ice of special origin. Its freeboard (height above waterline) was up to 7 m. Assuming a snow density of 0.4 g cm−3 the underwater thickness of the multi-year fast ice would be about 25 m. Presuming a yearly snow accumulation of 30 to 50 cm (this was the thickness range of the yearly stratification measured at the border of the multi-year sea ice) the age of the ice would be 50 to 80 a.
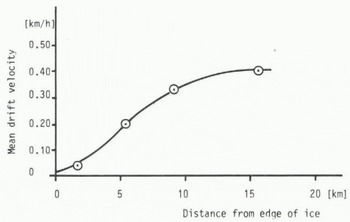
Fig. 5. Velocity profile of ice floes in front of ice shelf (31 January-1 February 1980).
The ice had formed in the lee of Berkner Island in the following manner: sea ice grew in front of the ice shelf and did not break-up during the summer months. Snow then accumulated on the surface of the multi-year sea ice which caused it to sink. The water-soaked snow froze causing the ice cover to grow thicker from above. This process of ice growth is possibly due to the barrier effect of Berkner Island against the flow of the ice shelf.
From the surface of one of the ice floes two ice cores were collected after the snow cover, which was 2.5m thick, had been removed. Below this dry snow cover, a layer of water-soaked snow (slush), which was 2 m thick, was found above the surface of solid ice. (From isostatic balance, the underwater thickness of this floe was estimated at ~10 m.) The examination of the ice cores showed that this multi-year sea ice had a fine-grained crystal structure consistent with a snow origin for the ice. Its salinity content was about 4 ![]() .
.
Physical and Mechanical Properties of Sea Ice in the Weddell Sea
The investigations of the physical and mechanical properties of Antarctic sea ice were concerned with salinity, temperature, crystal structure, flexural strength, uniaxial compressive strength and Young’s modulus. For determining these properties, cores were drilled from level ice cover using the 7.5 cm SIPRE core drill. The sea-ice investigations started during the voyage near the South Sandwich Islands south to the south-west corner of the Weddell Sea (Cape Fiske). The locations at which the cores have been collected both from the ship and by helicopter are shown in Figure 1.
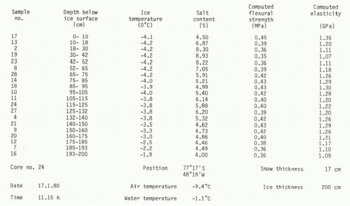
Immediately after the core or part of the core had been removed from the bore hole in the ice, the temperature of the ice was measured by an electric Platinum 100 temperature indicator and recorded. Half the cores were melted on board the ship in small samples of about 10 cm in length in order to measure the salinity of the melt. The other half were packed in plastic bags and stored in a freezer at -30°C. These deep-frozen cores were taken back to Germany for further investigations. The salinity was determined by measuring the electrical conductivity. An example of a temperature and salinity profile is given in Table I and plotted in Figure 6.
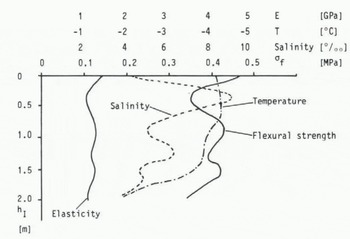
Fig. 6. Temperature, salinity, flexural strength and Young’s modulus versus depth of core no. 24 (17 January 1980).
Table 1. Ice Analysis Record
The flexural strength and the Young’s modulus (strain modulus) are usually established through cantilever or simply supported beam tests. In the case of ice covers thicker than 1.0 m it is, however, much too difficult and time-consuming to perform such tests. Fortunately, Weeks and Assur (1967), have established a relationship between the flexural Strength of, Young’s modulus E, and the brine volume u0, which has been verified by such experiments as those of Reference SchwarzSchwarz (1975). This relationship
and
can be used to calculate both of and E, if the brine volume is known; v 0and E 0 are the flexural strength and elasticity of ice that is structured like sea ice (in this case columnar-grained with horizontal c-axes, but without salinity.
According to Frankenstein and Garner (1969), the brine volume is a function of the salinity and the temperature of the ice:
By using this expression for v0 in Equation (1) and Equation (2), of and E can be calculated.
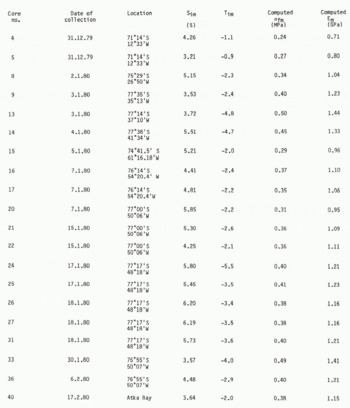
Examples of the computed flexural strength and computed modulus through the depth of an ice sheet are plotted in Figure 6. Flexural strength and modulus mean values over the depths of the sea ice are presented for all investigated ice cores in Table II, in which the geographic position of the collection site is also given. According to the results in Table II, the flexural strength of Antarctic sea ice varies between 0.Z4 and 0.50 MPa, with most of the results within the range 0.35 and 0.45 MPa. The low values belong to the most northern locations, where the air temperature was about 0°C.
Table 2. Ice Salinity, Ice Temperature, Computed Flexural Strength, And Computed Young’S Modulus {Mean Values)
Ice samples were transported in a freezer on board the expedition ship from the Weddell Sea to Germany where the uniaxial compressive strength of the ice was established in the ice laboratory of the Hamburgische Schiffbau-Versuchsanstalt. These tests were carried out according to standardized testing methods (Schwarz and others 1981). The principal means of testing was the 100 kN capacity, closed-loop testing machine which operates in the constant strain-rate mode. The ice cores were cut on a band saw into specimens with a length of 10 cm and a diameter of 7.2 cm. An uniaxial state of stress throughout the specimen was produced by loading the specimen through flexible platens. These platens consist of a plug of elastic material with a low modulus confined radially within a metal ring in order to prevent gross radial deformation. It offers the possibility of uniform normal pressure to the end of a conventional cylindrical test speciment without imposing significant radial or tangential stresses, either positive or negative (Haynes and Mellor 1977).
All cores collected in the Antarctic were taken vertically from the ice floes. This restricted the investigation to the force applied parallel to the direction of growth. From other basic investigations on columnar-grained sea ice it is known, however, that the strength parallel to the direction of growth is about 2 to 3 times as high as the strength in the horizontal direction.
Uchaara: Sea ice in the Weddell Sea
Crystal lographic investigations were carried out on thin sections from various depths. Pictures taken by the use of polarized light showed that the sea ice investigated had a columnar structure with a mean horizontal grain diameter of 1 and 5 cm at depths of 0.2 and 1.5 m, respectively. The c-axes were horizontally oriented but without preferred orientation within this plane.
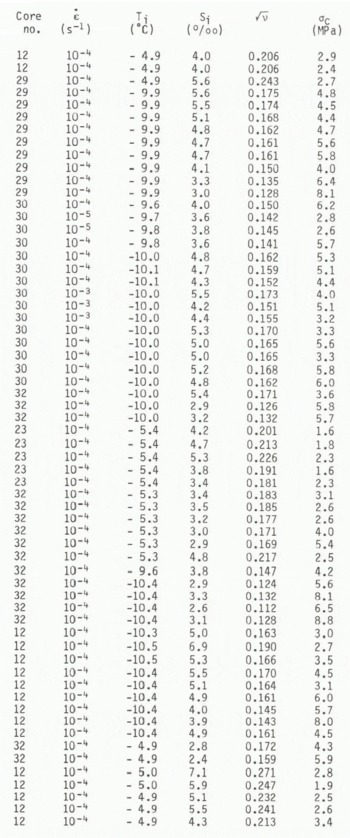
It should be noted that the uniaxial compressive strength is not the ultimate strength possible; it is just one point on the failure envelope of ice which in practical cases fails under multiaxial stress states. The uniaxial compressive strength can, however, be regarded as an index strength which is the most common value by which the mechanical properties of ice are described. The results of all uniaxial compression tests are given in Table III, in which the uniaxial compressive strength, salinity, strain-rate, test temperature in the ice, and the date of sampling are given.
Table 3. Strain-Rate, Temperature, Salinity, Square Root Of Brine Content And Uniaxial Compressive Strength Of Antarctic Sea Ice
In most of the previous investigations into the effect of strain-rate on the uniaxial compressive strength of ice (sea ice and freshwater ice), it was found that the strength increases with the strain-rate in the ductile range of deformation (Schwarz and Weeks 1977). At higher strain-rates the strength drops off again. The maximum is found to be in the range of transition between the ductile and the brittle mode of failure. In order to investigate the compressive strength of Antarctic sea ice at a strain-rate at which the strength is highest, a primary series of uniaxial strength tests was carried out at different strain-rates ranging from 10−5 to10−3 s−1. The results of these investigations are shown in Figure 7, which indicates that sea ice at -10°C has its highest strength at a strain-rate range of 10−4 s−1. Due to this result all the succeeding strength tests were carried out at a strain-rate of. ![]()
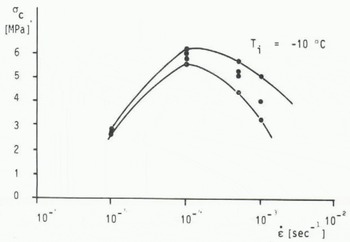
Fig. 7. Uniaxial compressive strength of Antarctic sea ice versus strain-rate.
The results of uniaxial compressive strength tests for sea ice from the Weddel1 Sea are plotted in Figure 8 versus the square root of the brine content. As expected, the compressive strength decreases with increasing brine content. In Figure 8 the results are distinguished between sea ice of about -5 and of about -10°C. The results of both temperature ranges have been used together and also separately for linear regression analyses which resulted in the following relationship between uniaxial compressive strength and the square root of the brine content:
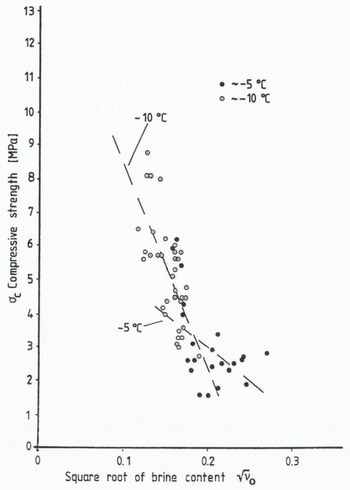
Fig. 8. Uniaxial compressive strength versus square root of brine content.
Results of uniaxial compressive strength tests of sea ice have been published by Reference PeytonPeyton (1966), Frederking and Timco (1980) and Häusler (1982). Comparable results have been obtained by Häusler for laboratory-grown saline ice; Häusler reports a uniaxial compressive strength of about 10 MPa for -10°C and a load direction parallel to the growth direction. Frederking and Timco, and Peyton all report results of this same order for Arctic sea ice. A direct comparison, however, is in most cases difficult because the test conditions, i.e. ice temperature, strain-rate, load direction, load application, and stiffness of the testing machine are not equal.
Conclusions
Sea-ice conditions in the Weddell Sea in the winter of 1979-80 were considered to be mild when compared to records from other years. The large polynya observed in front of the Filchner and Ronne ice shelves caused the thick multi-year sea ice in front of Berkner Island to break up, representing a potential danger to ice-going ships.
The ice properties (strength, Young’s modulus, crystal structure, etc.) of the fast ice in front of the Filchner and Ronne ice shelves were quite similar to those found in fast ice in the Arctic, the significant difference being the presence of a thick layer of snow on the surface of the Antarctic sea ice. This layer of snow is the source of an additional resistive force to be overcome by icebreaking ships due to the increase in friction between ship and ice.


