


Introduction
When ocean waves generated by offshore storms are incident on an ice sheet, the wave energy is partially reflected, with the remaining fraction being transmitted as flexural–gravity waves. these waves are named for the two restoring forces they experience: gravity and those associated with the flexing of the floating ice sheet. they can propagate deep into the ice field. it is currently a topic of some interest as to whether waves can be used to remotely sense sea-ice thickness, particularly in the arctic ocean (e.g. Reference Nagurny, Korostelev and AbazaNagurny and others, 1994). this information is of value to offshore industries operating within these regions, since it can influence the efficiency of their operations. for example, if the sea ice is particularly thick, it can mean a much longer wait until the ice has thawed and a ship is able to get through. the current methods for determining the thickness of sea ice are labour- and equipment-intensive and, while recently developed techniques such as electromagnetic sensing are promising, the use of ice-coupled waves is an exciting alternative.
It is often assumed by modellers that sea ice is just a thin homogeneous veneer on the cold ocean surface, but in reality it contains many heterogeneities, namely leads, pressure ridges and regions with variable physical properties (density, poisson’s ratio, etc.). these inhomogeneities have a significant effect on the propagation of waves and need to be taken into account. models that do this have been used to simulate waves under sheets with simple distributions of ideal inhomogeneities. but to use waves as a remote-sensing agent we require a model capable of simulating their propagation under real ice sheets. output can then be compared to measured waves and the ice thickness inferred. such a model has been developed and is described in this paper.
The model derives from Reference WilliamsWilliams (2005), who employs green’s functions and linear wave theory to find the velocity potential, and hence the reflection and transmission coefficients, for waves travelling under a prescribed ice sheet. the model is described in detail in the next section.
We present results from two groups of simulations: a simple model of a pressure ridge, and an ice sheet constructed from experimental data from a submarine sonar survey. we examine the effects of changing the sampling rate and the choice of interpolation technique on the transmission and reflection coefficients.
Formulation of the Problem
Of interest is the reflection and transmission of ice-coupled waves travelling beneath an ice sheet with a section of arbitrarily varying thickness, as illustrated in figure 1. current theory constrains us to examining sheets with flat undersides so that all thickness variations must be incorporated by mass changes above the ice sheet, and also to cases where the ice sheets on either side of the variable region are of the same thickness. because the mathematics used is reported in detail elsewhere, we include only a brief outline of the theory in this section for completeness. later we describe the methods used to approximate the ice sheet.
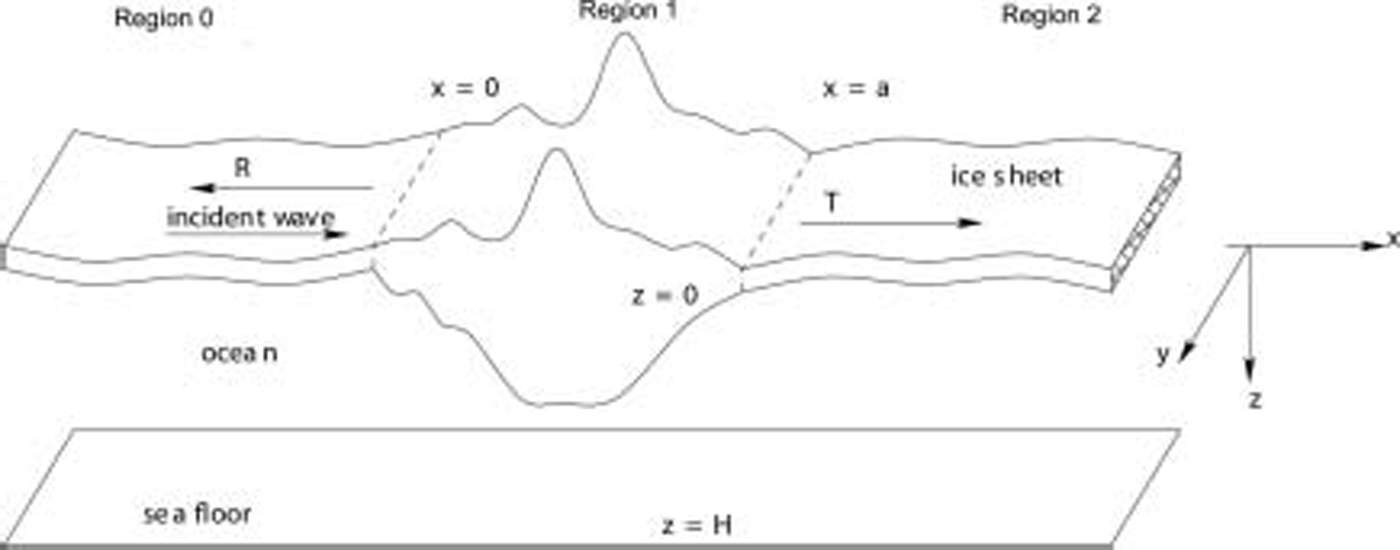
Fig. 1. An infinite ice sheet with a section of arbitrarily varying thickness. Incident ice-coupled sinusoidal waves are partially reflected (R) and partially transmitted (T) by the feature.
Denoting D(x) = Eh3(x)/12(1=v2), where E and v are the effective young’s modulus and poisson’s ratio (set at 6gpa and 0.3, respectively) and h(x) is the ice thickness, the equations that will describe the ice sheet as an euler–bernoulli plate and the underlying inviscid, irrotational fluid foundation may be non-dimensionalized by scaling all lengths by ![]() here
here ![]() is the familiar characteristic length and
is the familiar characteristic length and ![]() is the characteristic time, where ρ
w = 1025 kgm–3 is the water density and g = 9.81 ms–2 is the acceleration due to gravity, and
is the characteristic time, where ρ
w = 1025 kgm–3 is the water density and g = 9.81 ms–2 is the acceleration due to gravity, and ![]() is the non-dimensionalized form of the radian frequency
is the non-dimensionalized form of the radian frequency ![]() of the incident wave. it is also useful to define
of the incident wave. it is also useful to define ![]() and
and ![]() in which m
0 = ρh, where ρ = 922.5 kgm–3 is the density of the sea ice, and m
0 is the mass per unit length of the ice in the constant thickness region. then, because the solution is linear and can be expressed in terms of a separable velocity potential of the form
in which m
0 = ρh, where ρ = 922.5 kgm–3 is the density of the sea ice, and m
0 is the mass per unit length of the ice in the constant thickness region. then, because the solution is linear and can be expressed in terms of a separable velocity potential of the form ![]() the non-dimensionalized problem is
the non-dimensionalized problem is
In equations ![]() where m(x) is the non-dimensionalized mass per unit length within the variable-thickness region. we label the lefthand region in figure 1, in which the thickness is constant, as region 0, the righthand region as region 2 and the variable-thickness region as region 1. because the thickness must be the same in regions 0 and 2, the operator L is the same in each of these regions, i.e.
where m(x) is the non-dimensionalized mass per unit length within the variable-thickness region. we label the lefthand region in figure 1, in which the thickness is constant, as region 0, the righthand region as region 2 and the variable-thickness region as region 1. because the thickness must be the same in regions 0 and 2, the operator L is the same in each of these regions, i.e. ![]() in region 1, L becomes
in region 1, L becomes ![]() in which the functions dj are d1(x) = D1(x) = D0,
in which the functions dj are d1(x) = D1(x) = D0, ![]() and d4(x) = m1(x) – m0, and the operators L
1
j are
and d4(x) = m1(x) – m0, and the operators L
1
j are ![]() and L14 = =μ.
and L14 = =μ.
The dispersion relation
By substituting wave potentials (x, z) = eikx cosh k(z=H) into the governing equations by way of equation (1), we obtain the dispersion relation that k must satisfy, i.e.
In equation (2), k is the non-dimensional wavenumber (k/L is the physical wavenumber), D = 1 in regions 0 and 2, D = 0 for waves in open water, and α is given by
The roots of the dispersion relation represent the allowed modes in the system. for waves beneath ice, there is a real root k 0 corresponding to a propagating mode, a complex conjugate pair of roots k –2 and k –1 corresponding to damped propagating modes, and a countably infinite set of imaginary roots kn (n = 1, 2, . . .) corresponding to evanescent modes. since the dispersion relation is an even function, the negatives of all of these are also roots. when open water is present, there are no complex roots but there is still a real root k 0 and infinitely many imaginary roots kn (n = 1, 2, . . .).
A Green’s function
The solution to equations (1) can be found by first determining the green’s function for finite water depth H that solves
It has been found empirically that setting H = 5L is enough to eliminate the effect of that quantity on the scattering, i.e. that the water then behaves as though it were deep.
Reference Evans and PorterEvans and porter (2003) use an inverse fourier transform to solve for the green’s function; for a comprehensive treatment of this subject the interested reader is also directed to Reference WilliamsWilliams (2005). there, an expression is given for Gzthat, together with derivatives with respect to , is all we need:
In equation (5), An = res(1/f0,кn), f 0 being the dispersion relation for region 0. the кn obey with square roots taken in the upper half-plane.
The general integral equation
By referring to green’s theorem and by using equations (1) and (4a), Reference WilliamsWilliams (2005) writes a general integral equation as
In which ![]() boundary conditions are now applied and the green’s function substituted in, to obtain eventually
boundary conditions are now applied and the green’s function substituted in, to obtain eventually
In which Xc is the set of all points involving discontinuities in D(x) and D'(x), and p0(x) = D(x)z(x,0), p1(x)=D(x)zx (x,0) = D0(x)z(x,0). if we are far enough from the origin, the damped and evanescent modes are negligible and the potential has the asymptotic form
Which can be compared to the solution to obtain expressions for R and T.
Reconstructing the Ice Sheet
To evaluate the integrals in equation (7), an expression for the ice thickness is required. in this section, the method used to represent the ice sheet is described. typically we will have an ice sheet for which the thickness is known as a function of the space variable at any desired resolution, so we can construct a vector of function values at regular intervals. the area between a pair of adjacent points is termed a ‘section’. for a real ice sheet, the size of the section is determined by the resolution of the ice surface data or by the amount of averaging that has been done. across a single section the ice thickness can be interpolated by a low-order polynomial, and herein we use constants, lines and cubics. in the limit as the number of sections increases to infinity, the interpolated ice sheet will become exact. within each section, numerical quadrature is used to evaluate the integrals appearing in equation (7), and to do this each section is divided into a number of panels. as the number of panels increases, the estimates for integrals converge to exact values.
Reconstructing the thickness of the ice sheet using piecewise constants and lines is a trivial process. interpolation using cubics is implemented using the algorithm described in press and others (1986). this algorithm describes how a cubic spline may be constructed so that the spline and its first derivative are continuous everywhere, including at the end points.
The model requires expressions for the flexural rigidity and its first two derivatives. if those derivatives are zero, which they are when constant interpolation is used for the thickness because E is constant, fewer integrals need to be evaluated using quadrature but there are boundary terms that must be found at the edges of every section. when the ice surface and its slope are both continuous, there are no boundary terms, but more integrals to evaluate. we anticipate that using linear and cubic interpolation will require more panels because functions will vary more over a single section. when constants are used, more time will be spent evaluating the boundary terms at the discontinuities between each section.
Real and artificial ice sheets
A number of submarine voyages have been conducted, during which upward-pointing sonar was used to map the underside of the ice. experiments have also been conducted using lidar from aircraft to map the topside of the ice surface. in both cases, the data are presented as elevations along line segments, which represent an average value for the surface in the vicinity of the point (a consequence of the beam width being non-zero). accordingly, information about how the ice sheet varies between points is lost and assumptions must be made to reconstruct the ice sheet from the data.
Examples of data from submarine experiments are available from the internet, typically with points spaced every metre (http://nsidc.org/data/g01360.html). it may be that details of the ice sheets occurring at this scale are unimportant in terms of wave transmission, and to enable this idea to be explored the model has the facility to average adjacent points. this means the number of points is reduced (so the model runs faster) and the separation of points is increased. however, larger sections can mean more panels are required for the quadrature to converge.
We now proceed to create artificial ice sheets with particular features to test the model. the merit in this approach is that the sheet can be resampled at any desired resolution.
A Simple Pressure Ridge
Leads form in an ice sheet when forces (due to currents and wind) on the sheet are large enough to cause cracks to grow. once formed, the leads start to refreeze and become covered by a thin sheet of ice. the forces that cause lead formation are not constant, so sometimes leads close, causing the thin refrozen ice to be broken up and piled up to form pressure ridges. these ridges have sails and keels, with the latter containing roughly 90% of the mass because of the relative densities of water and ice. initially consisting of loose blocks, ridges refreeze and are smoothed by currents and wind to become rounded, consolidated features.
Pressure ridges affect the propagation of waves in several ways: by increasing the mass loading, increasing the flexural rigidity and by presenting an obstacle to the flow under the ice sheet. in the model created here, the first two of these effects can be accounted for by inverting the keel (personal communication from r. Reference Porter and PorterPorter, 2004), but the last cannot yet be accommodated.
Here we establish protocols for using the model that will later aid the simulation of real ice sheets. we investigate the effects on wave scattering of changing the order of the polynomial used to reconstruct the surface, and the ridge model is varied to examine the effect of neglecting the sails and keels. the effect of ice thickness is also examined. finally, the mass loading term is neglected to determine which restoring force (gravity or the flexing of the ice sheet) dominates the scattering of waves under a pressure ridge.
figure 2 shows a simple model of a ridge and the inverted keel analogue we use as an approximation. while we have used a symmetric ridge, experiments (well summarized by Reference Wadhams and LeppärantaWadhams, 1994) and simulations (Reference HopkinsHopkins, 1998) show that ridges are often asymmetric, but the simple model is sufficient for our purposes. the largest keel draft observed to date is 47 m, but keels this large are not common, typically being 5–10m (Reference Hibler, Weeks and MockHibler and others, 1972). the highest sail observed was 13m high (Reference Wadhams and LeppärantaWadhams, 1994), but sails are more commonly 1–2m high. the keel-draught to sail-height ratio is commonly 3–4 : 1 (Reference Wadhams and LeppärantaWadhams, 1994) and the average measured keel and sail slopes are 33˚ and 24˚ respectively (Reference Wadhams and LeppärantaWadhams, 1994). the ridge we examine here has a keel depth of h k = 9m and width b k = 36 m, and a sail with height of h s = 3m and width b s = 12 m, which roughly conforms to the statistics. the ice sheets are taken to be 2 m thick away from the ridge.
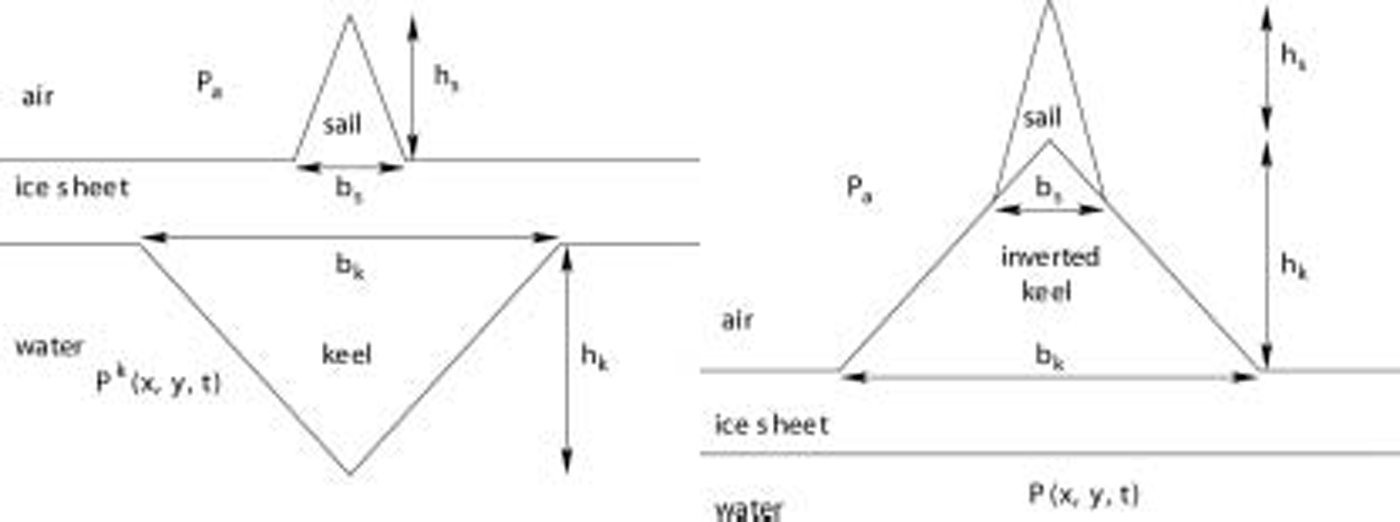
Fig. 2. A schematic showing on the left a simple model of a ridge that consists of a sail and a keel, and on the right the inverted keel we use here. Pk (x,y,t) and P(x,y,t) are respectively the pressures within the water column when a keel is present and when it has been inverted. P a is the atmospheric pressure.
Justification for inverting keels
In figure 2, a ridge with a triangular keel is shown. for the sail–keel pair and for the keel inverted, the pressure along the underside of the sheet can be split into several parts
In which ys and ![]() are the y coordinates at the underside of the ice sheet for the keel and the inverted keel respectively, P
e is the pressure at the mean underside when no waves are present and appears in both expressions, and P
w and
are the y coordinates at the underside of the ice sheet for the keel and the inverted keel respectively, P
e is the pressure at the mean underside when no waves are present and appears in both expressions, and P
w and ![]() are the contributions due to the presence of waves under the two sheets. the pressure P
h is a hydrostatic pressure resulting from the underside of the keel being deeper than the underside of the ice sheet. in the equilibrium case with no waves present, we assume the two pressures
are the contributions due to the presence of waves under the two sheets. the pressure P
h is a hydrostatic pressure resulting from the underside of the keel being deeper than the underside of the ice sheet. in the equilibrium case with no waves present, we assume the two pressures ![]() exactly balance the atmospheric pressure and the weight of the ice sheet.
exactly balance the atmospheric pressure and the weight of the ice sheet.
With the assumption that ![]() for identical incoming waves, the sole influence of failing to include P
h results in a steady deformation of the plate. we assume that a thin plate experiencing a steady deformation will behave in the same way as an undeformed thin plate. the assumption that
for identical incoming waves, the sole influence of failing to include P
h results in a steady deformation of the plate. we assume that a thin plate experiencing a steady deformation will behave in the same way as an undeformed thin plate. the assumption that ![]() is difficult to justify, but provided keel slopes are not too steep it should be acceptable.
is difficult to justify, but provided keel slopes are not too steep it should be acceptable.
Further support for this assumption is provided by Reference Porter and PorterPorter and porter (2004), who use the mild-slope approximation to examine wave scattering under ice sheets with non-uniform undersides in water of finite depth. they found that the governing equations were dependent only on the distance from the underside to the sea floor, suggesting a feature could be accounted for by placing it on the sea floor and flipping the keel; an easier problem to solve than including submergence. here we have infinite depth, so anything at the sea floor is negligible.
Inverting keels and neglecting sails
In figure 3, the magnitude of the reflection coefficient is plotted against wave period for the ridge, both with and without the sail, and also using the no-mass-loading approximation. for this ridge at higher periods, neglecting the sail is a very good approximation and it is the longer periods that are of most interest here. when mass loading is omitted, the scattering coefficients are not significantly different at the large scale but, as can be seen in figure 3 from the dashed curve, the details have changed. when the mass loading is neglected, there is no distinct minimum. when the keel is neglected, the scattering is changed markedly, suggesting it is a poor approximation. we also ran tests in which the sail was increased in mass to unphysical sizes (as much as a quarter of the mass of the ridge in the sail), and the scattering coefficients remained largely unchanged, but these results are not presented here, for the sake of brevity. essentially, an ice sheet with a ‘stiff’ section behaves the same as one with a ‘very stiff’ section.
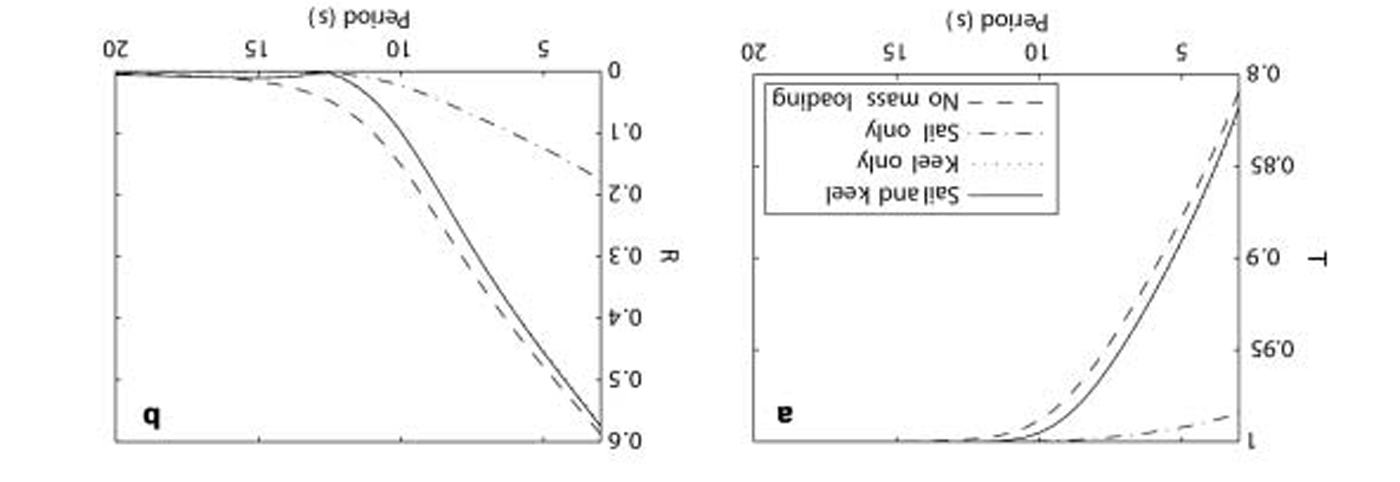
Fig. 3. The consequence of neglecting the mass loading and the presence of the sail on the transmission (a), and reflection coefficients for a ridge with an inverted keel (b). Here the ice sheet is interpolated using a piecewise linear function, and the keel is 30 m wide and 3 m high. The period where reflection is zero is a result of destructive interference and does not occur when mass loading is neglected. Neglecting of the sail is consistently a very good approximation, while neglecting the mass is a good approximation for periods higher than about 15 s. Neglecting the keel is a very poor choice.
Techniques for reconstructing the ice surface
Here we examine the scattering and rates of convergence arising due to a ridge with an inverted keel as shown in figure 2, using different interpolation methods for reconstructing the thickness of the ice sheet. we find that the order of the polynomial used to interpolate the ice sheets has significant effects on the behaviour of the model.
First we note that the ridge in figure 2 is reproduced precisely when the ice sheet is interpolated using piecewise linear functions, provided that the number of sections is chosen well. so, for linear interpolation, the only factors affecting convergence are the number of panels used in the quadrature scheme and the number of evanescent modes retained. as such, it is an appropriate standard against which convergence can be measured when other interpolation methods are used.
For a given number of sections we define a convergence parameter comparing two solutions by
In which R 4000(тi) is the reflection coefficient at period тi , found using 4000 panels with linear interpolation, N is the total number of periods used, and R(тi,p) is the reflection coefficient calculated using p panels. in figure 4a, F(p) is plotted against the number of panels used. in producing this plot, the period тi takes integer values from 1 to 25. the number of modes used does not affect run times to the same extent as the number of panels, and here we use 100, which proves to be sufficient to ensure very good results.
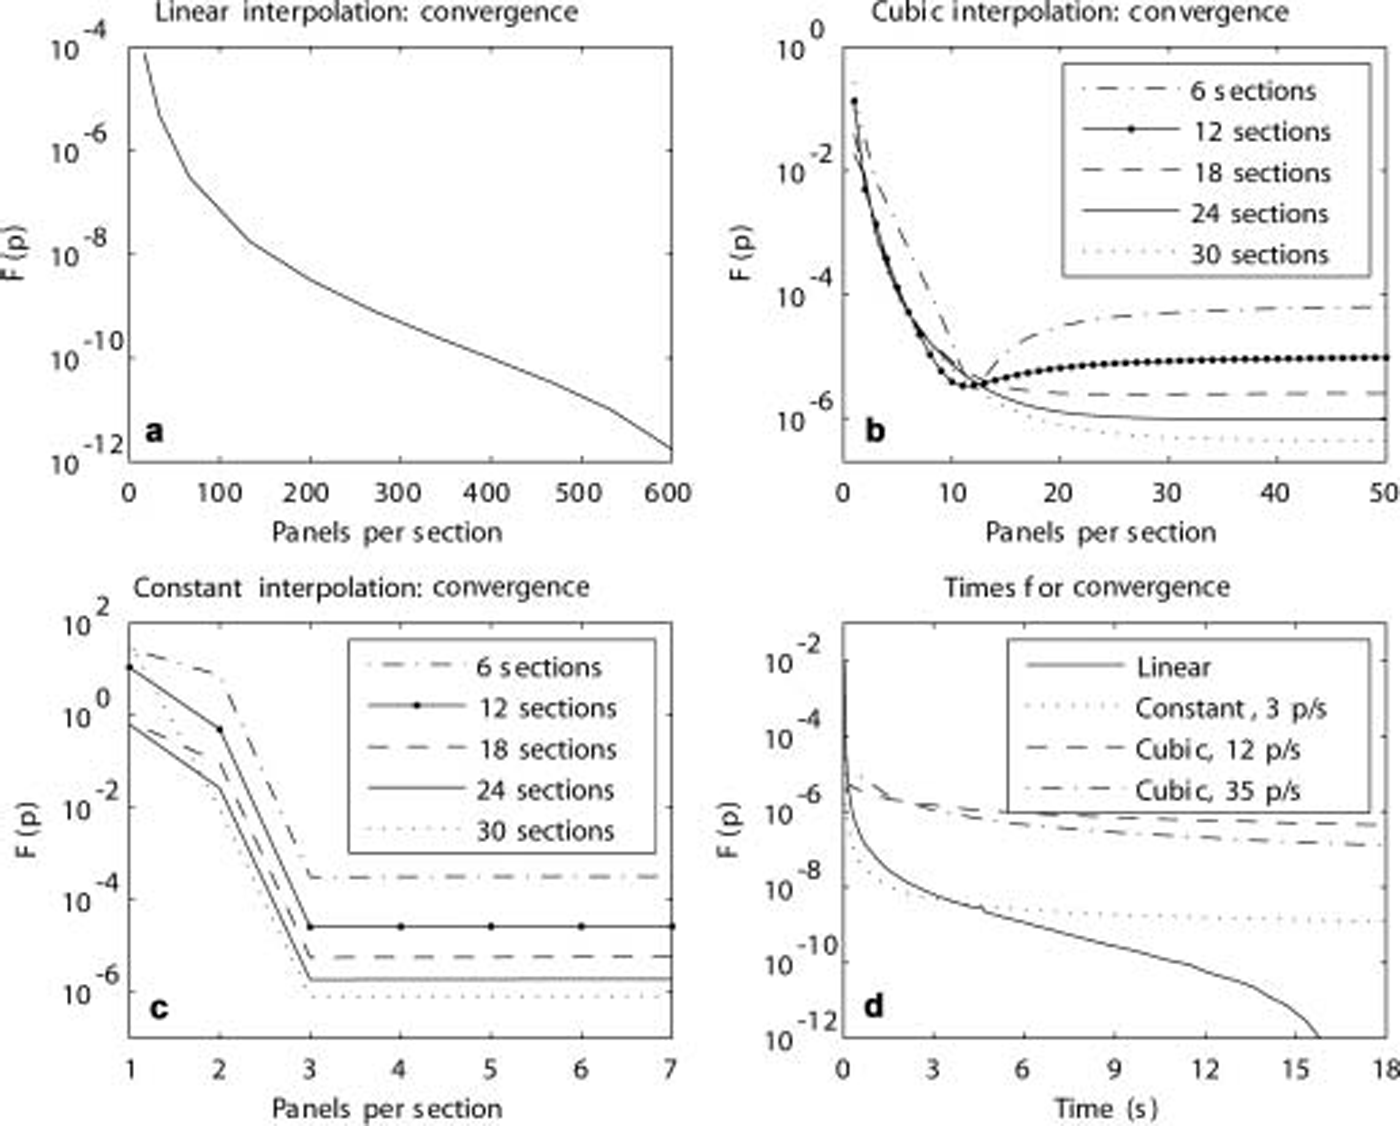
Fig. 4. (a–d) Convergence for the simple flipped ridge shown in Figure 2 using different polynomials for interpolating the ice thickness. In all cases F(p) is a sum-of-squares estimate for the error, defined by Equation (10). In the legend in (d), p/s signifies panels per section. In (a) the linear method converges well. In (b) and (c) results are poor for low resolutions, then reach a plateau where the solutions start to converge to those for the approximate ice surfaces. Interestingly, the code is quicker when using constants at lower accuracies, but very high accuracies can only be achieved by using the linear model.
Not surprisingly, figure 4a shows a reduction in error as the number of panels increases. for low numbers of panels, error reduces rapidly, a result of more converged results at high periods. for low p, the reflection coefficient is reasonably good at high periods, but it is poor at low periods and near the perfect transmission period. because the reflection coefficient is much larger at low periods, it can be argued that using F(p) as an indicator of convergence places too much importance on low periods, which are of less interest as they are less common in real ice sheets. nonetheless, F(p) is still an indicator of the error and is sufficient for our purposes. we determined that 1600 panels were enough to obtain a sufficiently converged simulation, while not requiring the overly long run times of higher resolutions.
figure 4b shows what happens when the ice surface is interpolated using a cubic spline. for low numbers of panels, the result appears poor for each simulation, irrespective of the number of sections, but they are actually quite good, the curves only just being distinguishable on a plot. when cubic interpolation is used, the models do not converge as the number of panels is increased to the solutions generated when linear interpolation is used. although the model is converging, the ice sheet is different, so the solution changes but not by much. in summary, while all of the results are good, for higher numbers of sections the agreement with the converged linear model is potentially very good. however, higher numbers of panels are required to realize this potential.
When piecewise constants are used, the results are slightly different, as can be seen in figure 4c. in each case, the solution does not continue to converge at any useful rate once there are three panels per section. to obtain increasingly converged solutions when using piecewise constants, the number of sections should be increased while keeping three panels per section. this is a good rule for low numbers of sections for this ridge, but it has not been tested more generally.
Different interpolation methods also affect run times. for increasing numbers of sections, using three panels per section, the run times for the constant model are collected and plotted in figure 4d against values of F for each simulation. the rules for choosing p for a cubic spline are not so clear-cut, and, somewhat arbitrarily, we use 35 panels per section and find the times required for completion of the simulations. it can be seen that there is a limit to the accuracy that can be achieved when constant and cubic interpolation is used to approximate ice thickness. more panels per section with the cubic spline produce only slight improvements, at least for this ridge. the improvements from using more panels with constant interpolation are even worse. so if neither the cubic nor constant interpolation options offer sufficient convergence, only linear interpolation remains. but it must be remembered that the convergence to the point where F(p) is <10–6 is very precise, and further enhancements are of little value. (plots of R for simulations using the high-resolution linear model and for the most accurate cubic and constant simulations are indistinguishable at normal scales.)
Earlier it was noted that results using cubic interpolation did not converge as the number of panels was increased for low numbers of sections because, while the quadrature had converged, the ice thickness was restricted to an approximate form. the failure to converge beyond a limiting accuracy in figure 4 is not the same since high numbers of sections were used. it is quite likely that simplistic rules of the type ‘x panels per section looks enough’ are adequate for low numbers of sections but provide poor solutions when higher numbers are used. it may also be that the concavity of the ice thickness, which is not present when linear and constant interpolation is used, is making a contribution.
A Real Ice Sheet
In this section, we examine the propagation of waves under an ice sheet that is constructed to be as near as possible to a real one. real ice sheets are not homogeneous but are peppered with imperfections such as leads, cracks and pressure ridges. in addition, the properties of the ice itself can vary, but it is thought that this is not the most significant variation in the ice and so it is neglected. we use a profile collected using upward-looking submarine sonar.
It is assumed that the submergence of the ice sheet is negligible and that the contribution by sails on the top surface is insignificant. we invert the profile (personal communication from r. Reference Porter and PorterPorter, 2004), so the keels appear on top of the sheet, a necessary step because of the modelling requirement that the underside of the ice is flat.
In real ice sheets pressure ridges can occur with almost any orientation. yet, ordinary upward-looking submarine sonar (as opposed to sidescan) does not provide information about orientations and so these data are unavailable. our model can account for orientations but it cannot be used when different features have different orientations. this is because different orientations imply that separate features can intersect, a three-dimensional phenomenon that cannot be simulated in our two-dimensional model.
For the simulations described here, we have used piecewise constants to interpolate the ice thickness. this choice was made because it enables discontinuities in the surface to be modelled without requiring large numbers of panels, and so can be run without requiring excessive run-times. note that the piecewise representation of the ice thickness will converge to the exact thickness when an infinite number of sections are used. here there is a limit to the number of sections, as they cannot be resampled at a higher rate whenever desired because we are limited to the 1 m resolution of the original data. it may be that even a 1 m resolution is high and that lower resolutions can sufficiently represent the scattering properties under the ice sheet. we use equation (10) to quantify the error but with the exact reference value found using no averaging and using 100 modes. it was found that less than four-point averaging of the ice surface data restricted the error to <10–4, with most of the error contributed by the low periods. similarly, using more than four evanescent modes restricted the error to <10–4, irrespective of thickness, but differences were most significant at middle periods. here we use three-point averaging and ten evanescent modes, which results in an error of 5.8×10⁻⁵. increasing the number of panels used in each section from three to ten (causing run-times to increase considerably) results in the error being reduced by 3.5×10⁻⁹, so gains in accuracy are negligible.
The topmost plot of figure 5 shows the ice surface used. the lower two plots show the reflection coefficient for different periods, with a curve for each of three thicknesses, 1, 2 and 3 m. most notable in the top plot of figure 5 is the lack of easily discernible regular features. there are, however, two clear keels and a feature that may be a refrozen lead between 10 and 20 m. in the lower two plots the reflection coefficient is plotted against period, split into two plots to help resolve small-scale features, with the high-period plot having a logscale.
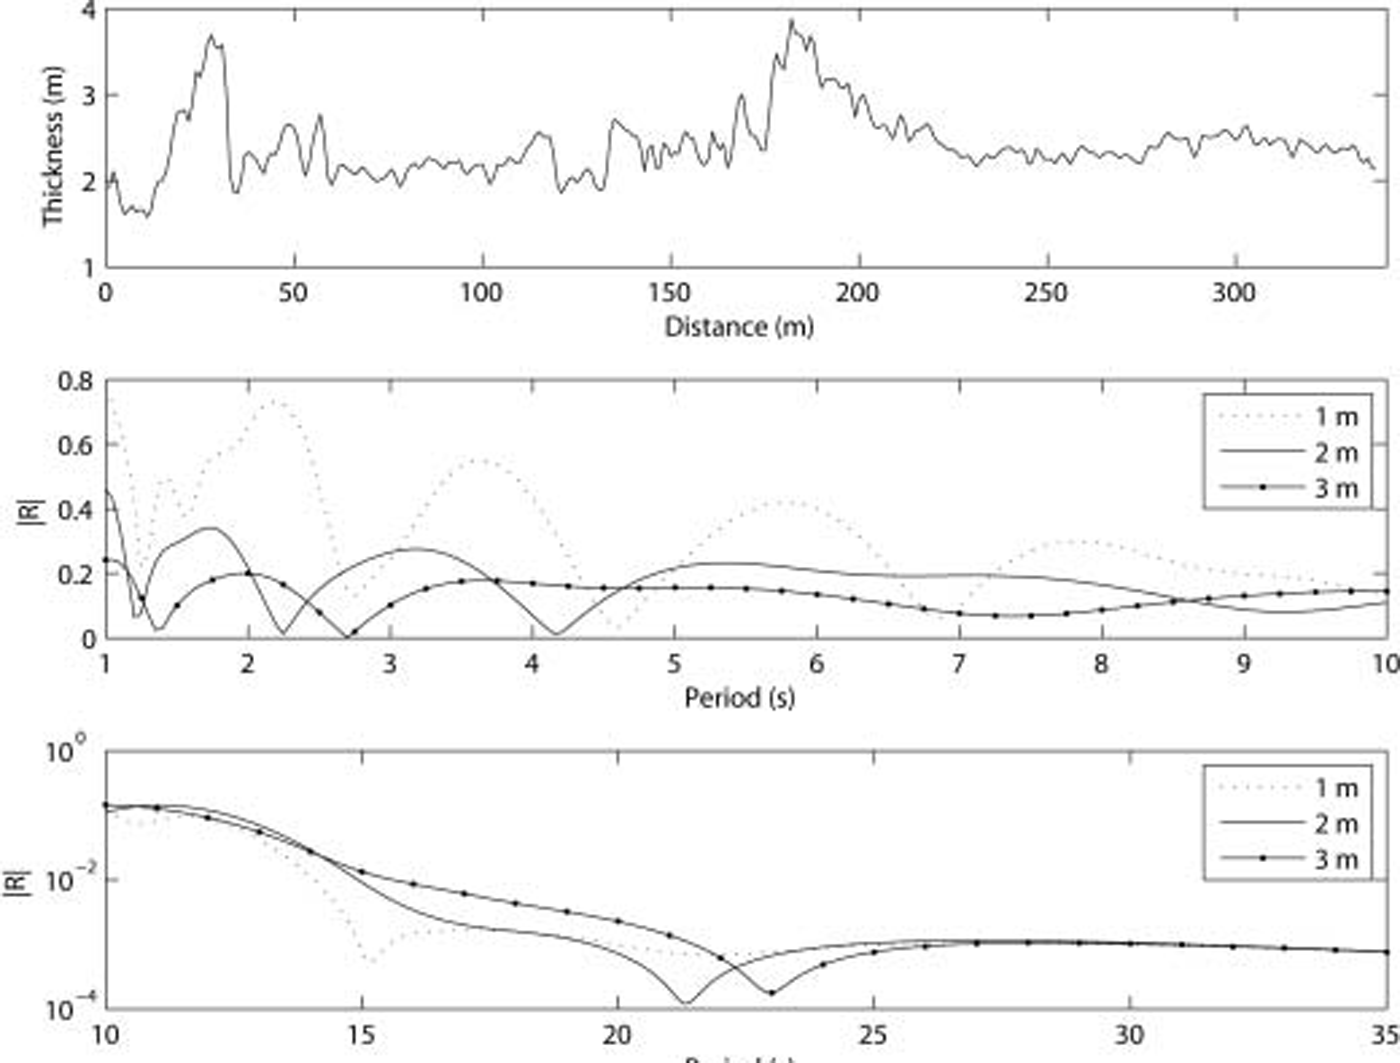
Fig. 5. A short length from a profile of the underside of an ice sheet in the Arctic Ocean collected using upward-pointing sonar (top). The thicknesses shown here are as measured; to obtain the 3 and 1 m profiles 1 m is added to or subtracted from all thicknesses. The lower two plots show the reflection coefficient for waves of different periods under this ice sheet. The model incorporates a semi-infinite sheet with a constant thickness at either end of the length shown.
The essential features are high reflection for low periods and low reflection for high periods. this behaviour is superimposed with the existence of minima where reflection reduces to near zero. beyond 35 s and up to 100 s there are no further minima. the minima are a result of destructive (or near-destructive) interference, but it is not clear to us what features in the surface cause the numbers, distribution and values of the minima. notably, the thickness of the ice significantly affects the values and locations of the minima. the presence of these minima is most heartening, however, as they demonstrate that the scattering potential of a variable-thickness ice sheet has features that are strongly dependent on the mean thickness. the goal of our research is to examine the viability of using the propagation of ice-coupled waves to detect the mean thickness of ice, and the results presented here support the conclusion that this may indeed be feasible. note, however, that the small differences in |R| at high periods (>25 s) seen in figure 5 would be impossible to observe in the field: the difference in the amplitudes of waves with different periods would be <0.001%.
The pattern of maxima and minima is superficially similar to those observed when electromagnetic waves propagate through layered media (Reference De Sterke and McPhedranDe sterke and mcphedran, 1993). in their work, where different layers have a random component to the refractive indices, they observe features that correspond to broad and narrow maxima in the reflection coefficient. using a simple model, Reference De Sterke and McPhedranDe sterke and mcphedran (1993) explain these broad and narrow maxima as being a result of interference occurring at small (their layers are all the same thickness) and large scales respectively. they find that narrow maxima are less likely as the random component of the refractive index is increased in magnitude, a possible explanation for why we have failed to find any in the results presented here.
Conclusions
We have described a two-dimensional model that can simulate the propagation of ice-coupled waves under an ice sheet with a section of variable thickness. the model rests on the assumption that linear wave theory applies and that the thin-plate equation describes the behaviour of the ice sheet. the thickness of the ice sheet is interpolated using low-order piecewise polynomials and we found that results are similar irrespective of the order chosen, with only minor differences in the model depending on which option is selected. when piecewise constants are employed, there are no gradient or concavity terms but there are boundary terms for each discontinuity. when a cubic spline is used, there are no boundary terms but the gradient and concavity terms are present. when piecewise constants are used, the model requires fewer panels for the numerical quadrature scheme to converge, with the result that simulations finish more quickly, an important property that makes this the preferred option.
To examine the behaviour of the model, we ran simulations of a triangular pressure ridge: pressure ridges consist of sails above the water and keels below, and to account for the mass loading and flexural rigidity the keel is inverted. we found that the contribution due to the presence of the sail is negligible, at least for the ridge considered herein. when mass loading is neglected, the effect on the magnitude of the reflection coefficient is small but details are affected, in particular zeroes no longer occur. in our opinion, the zeroes are important and so mass should be accounted for.
Further improvements to the model that we have planned involve examining the consequence of including the gradient and concavity terms in the ice thickness, establishing whether it is justifiable to neglect the submergence of keels, and allowing for wave spectra to be analyzed. establishing that the model approximates reality well is of importance and we have plans to compare the model results to experimental data from the field.
Acknowledgements
This work was supported by a marsden grant from the royal society of new zealand. the idea for inverting keels arose during valuable conversations with r. porter of the university of bristol, uk. we are indebted to t. williams for making his model available for us to use.


