


1. Introduction
Cosmic ray (CR) protons and nuclei bombard the Earth at a wide range of energies. The highest energy CR are thought to originate outside of the Milky Way, and given the extreme distances traveled will have a high probability to scatter on the ubiquitous Big Bang relic radiation dubbed the Cosmic Microwave Background (CMB). This proton–photon scattering process is predicted to produce a flux of neutrinos at the EeV (1018 eV) scale.
The Antarctic Impulsive Transient Antenna (ANITA) experiment searches for neutrinos at the EeV scale using an array of radio antennas attached to a helium balloon that flies over Antarctica at 37 km altitude. The incoming EeV scale neutrinos produce a characteristic radio signal via the Askaryan effect. If ANITA were to find such neutrinos, the experiment should only observe them at shallow angles, such that the neutrino does not intersect much of the Earth or ice. This is due to the fact that neutrinos, although weakly-interacting, suffer severe attenuation through the Earth at these energies.
This makes the recent observation by the ANITA experiment of two steeply pointed up-going events with energies near the EeV (1018 eV) scale very mysterious (Gorham, Reference Gorham2016, Reference Gorham2018). For reference, see Fig. 1 for the location of the two observed ANITA events. While neutrino interactions at high energies are uncertain (Kusenko and Weiler, Reference Kusenko and Weiler2002), the observed events would require neutrino fluxes well in excess of upper limits from Pierre Auger Observatory (Aab and others, Reference Aab2015) and IceCube (Aartsen, Reference Aartsen2016; Romero-Wolf, Reference Romero-Wolf2019). A number of new physics explanations for the anomaly have been proposed (Cherry and Shoemaker, Reference Cherry and Shoemaker2019; Anchordoqui and others, Reference Anchordoqui, Barger, Learned, Marfatia and Weiler2018; Huang, Reference Huang2018; Dudas and others, Reference Dudas, Gherghetta, Kaneta, Mambrini and Olive2018; Collins and others, Reference Collins, Bhupal Dev and Sui2019; Chauhan and Mohanty, Reference Chauhan and Mohanty2019; Anchordoqui and Antoniadis, Reference Anchordoqui and Antoniadis2019; Heurtier and others, Reference Heurtier, Mambrini and Pierre2019; Hooper and others, Reference Hooper, Wegsman, Deaconu and Vieregg2019; Cline and others, Reference Cline, Gross and Xue2019).
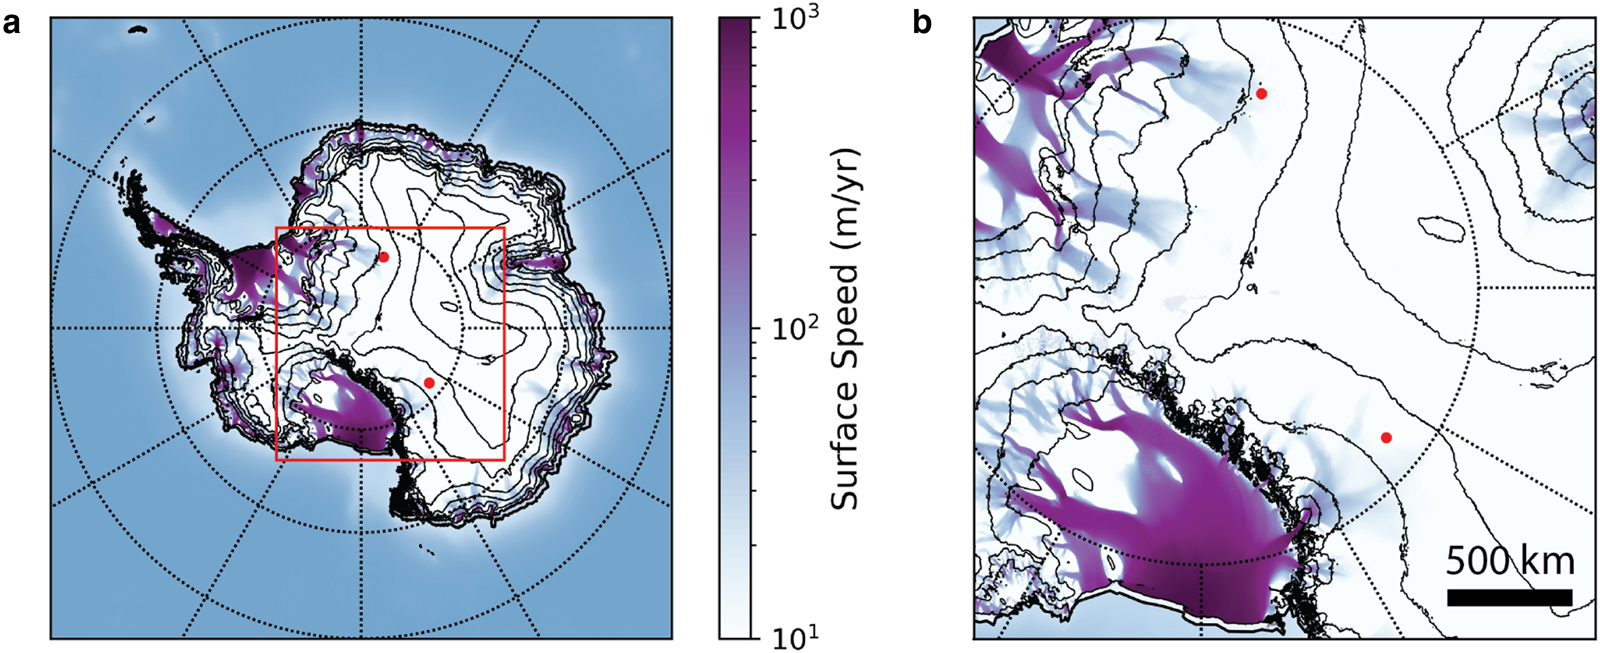
Fig. 1. A map (Panel A) and zoom-in (Panel B) of Antarctica displaying the two anomalous upward-pointing events (red dots) observed by the ANITA experiment, overlaid with surface ice speed (purple/blue heat map) and 500 m surface elevation contours. Event 3985267 (upper red dot) was originally reported in Gorham (Reference Gorham2016), while event 15717147 (lower red dot) was reported in Gorham (Reference Gorham2018). The surface ice speed data come from Mouginot and others (Reference Mouginot, Rignot and Scheuchl2019) and the surface elevation data come from Morlighem (Reference Morlighem2019). Both ANITA events lie in low surface ice-speed and high-elevation (3000–3500 m) regions.
In addition to neutrino searches, ANITA is also sensitive to CR, finding ~30 such events (Gorham, Reference Gorham2016, Reference Gorham2018; Hoover, Reference Hoover2010). When a CR hits the atmosphere, they produce extensive air showers (EAS) consisting of energetic charged particles which create a characteristic radio signal. Most of the CR events appearing to originate from the Earth display a characteristic phase reversal consistent with the interpretation that the signal originated from a down-going CR-initiated EAS reflected by the Antarctic surface. However, the two anomalous up-going EASs reported by ANITA (Gorham, Reference Gorham2016, Reference Gorham2018) lack phase inversion, and they appear to be inconsistent with such surface reflections. Thus, the phase reversal from ice reflection is the critical observational discriminant between neutrino and CR events.
In this paper, we consider the possibility that the mysterious events are explained by the radio signals originating from down-going CR-initiated EAS reflected by subsurface features in the Antarctic ice which allow for reflections without a phase inversion. Phase inversion occurs when the radio waves traveling in a medium with a low index of refraction (air) reflect from an interface with a medium that has a high index of refraction (ice). Note that higher density ice has a higher index of refraction due to the fact that higher density ice has a lowered speed of electromagnetic wave propagation. Note further that the continuity of electric and magnetic fields across the interface implies that the phase inversion occurs for low-to-high index reflection, but not for high-to-low index reflection. Thus, if the reflection occurs from an interface of a high-density layer on top and a low-density layer on the bottom, there is no phase inversion. We will identify the properties of the Antarctic ice that are required for the radio signal from an ordinary CR air shower to undergo a reflection without a phase inversion, and we will also identify the features known to exist in Antarctic ice that can be responsible for such reflections capable to explain the ANITA events.
2. General features of subsurface reflectors
ANITA reports 33 events with phases consistent with the expectations from CR-induced EAS events (Gorham, Reference Gorham2016, Reference Gorham2018; Hoover, Reference Hoover2010; Allison and others, Reference Allison2018). We compute the number of events above detection threshold E thr in an observing time, T, reflecting from either surface of subsurface features with area coverage, A eff, as

where we take the CR flux to be a power-law, Φ(E) ≃ Φ0(E/E 0)−γ with γ ≃ 2.7 (Blasi, Reference Blasi2013). This allows us to estimate the total number of ordinary EAS events from the surface reflection (with phase inversion):

where we define αCR ≡ Φ0/(γ − 1) E 0 ~ (E thr/E 0)1−γ, R surf. is the surface reflection coefficient, and A eff is the effective area surveyed by ANITA in flight time T.
Similarly, we can estimate the anomalous uninverted radio events from subsurface reflection of CR-induced events. Recall that such events would be labeled by ANITA as ‘up-going’ based on their lack of phase reversal. The subsurface reflections may occur only for incidence angles small enough, so that the power transmitted into the ice at the air–ice interface is significant. For the firn index of refraction, the power transmitted downward exceeds 80% if the incidence angle is less than 70°. We note that the incident angles of the anomalous ANITA events are well below this upper bound and, in fact, these angles are smaller than the average incidence angle of the CR events (Schoorlemmer, Reference Schoorlemmer2016). Therefore, one can estimate the rate of anomalous events as

where R sub. is the subsurface reflection coefficient, and δA eff is the area of the reflecting subsurface. A priori, there is no reason to assume that δA eff is small. In general, δA eff could exceed A eff, especially if several layers at different depths are contributing to the subsurface reflections. However, to explain the ANITA events, only a small fraction of ice needs to host the reflecting features. The estimates in Eqs. (2) and (3) imply that the subsurface features should occupy an area
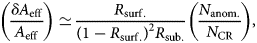
where in order to account for ANITA's observations one needs, N CR = 33 and N anom. = 2. We plot the requisite area estimate from Eq. (4) in Fig. 2 as a function of the subsurface index of refraction assuming that the top layer has n = 1.3 (Kravchenko and others, Reference Kravchenko, Besson and Meyers2004). See the Appendix for a more detailed discussion of the assumptions going into this calculation.
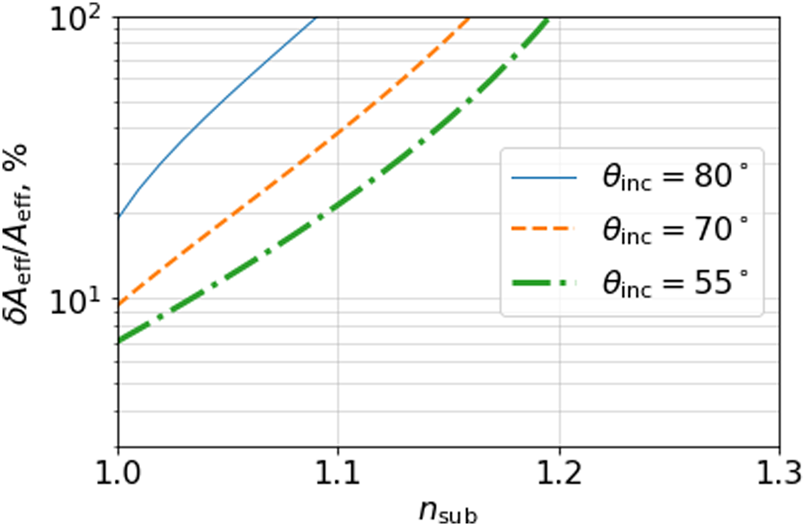
Fig. 2. For a two-layer model, we plot the required area coverage of a subsurface reflector as a function of the subsurface index of refraction, n sub. Three incidence angles (incidence angle is defined as θ inc = 180 − θ z, where θ z is the zenith angle) are shown: incident angles of 55° (roughly corresponding to the anomalous event (Gorham, Reference Gorham2018)), 70° (roughly the average angle for ANITA CRs) and 80° (which is on the high end of incident angles for the ANITA CR events). Here it is assumed that the surface has n = 1.3.
In summary, a relevant candidate subsurface feature needs to satisfy the following requirements:
1. In accordance with the estimate in Fig. 2, ${\gtrsim} 7\percnt$
 of the area should host a reflector at some depth.
2. There should not be significant attenuation for the EAS radio pulse above the reflecting feature, since this would render the signal undetectable. Roughly, if the detected anomalous event was attenuated by $\lesssim 0.2$
, the resulting field amplitude would drop below the trigger threshold (Romero-Wolf, Reference Romero-Wolf2019). Since the attenuation length for radio waves in ice is 1.2–1.5 km (with some temperature dependence (Matsuoka and others, Reference Matsuoka, MacGregor and Pattyn2012)) for the frequencies probed by ANITA, this requirement is satisfied by any features not obstructed by an overlying layer of liquid water (the attenuation length in liquid water is much shorter (Ray, Reference Ray1972)).3. The reflection must occur without a phase inversion. A subsurface interface with a higher index of refraction above and a lower index of refraction below can reflect a signal without a phase inversion. Likewise, multiple layers of variable index of refraction can reflect a signal without a phase shift (Tikhonravov and others, Reference Tikhonravov, Baumeister and Popov1997).
4. Given the wavelengths ANITA is sensitive to, the subsurface layer above the reflecting interface needs to be sufficiently thick, although the layer below the interface can be quite thin (Cavitte and others, Reference Cavitte2016). Similarly, the features should be > 100 m in diameter in order to be of the first Fresnel zone radius. Lastly, these surfaces likely need to be tilted with respect to the surface, such that double reflections (coincident surface and subsurface reflections) are rare. Note that the relative tilt can produce total internal reflection and suppress the signal. Given random orientations, one can expect this to occur roughly half the time.


Given these requirements, we now proceed to investigate which glaciological candidates may have the correct distribution and reflective properties.
3. Subsurface Antarctic candidates
Subsurface features that may have the right properties to account for the anomalous ANITA events include several possibilities:
(a) Double layers: The work of Arcone and others (Reference Arcone, Spikes and Hamilton2005) finds direct evidence for reflective surfaces without phase inversions. In particular, they find evidence for ‘thin double layers of ice over hoar’ which have reflection without inversion, and conclude that they are ‘extensive’ throughout West Antarctica. They model the observed reflections as high-permittivity ice sitting above low-permittivity hoar. The modeling done indicates that hoar thickness fluctuation is a major driver of the phase of the wavelet. These results were obtained with 400 MHz short pulse radar (ANITA is in the 200–800 MHz range).
(b) Firn density inversions: Ligtenberg and others (Reference Ligtenberg, Helsen and van den Broeke2011) and Kuipers Munneke and others (Reference Kuipers Munneke, Ligtenberg, van den Broeke and Vaughan2014) estimate snow and firn density (in the top 100 m of depth) in Antarctica for the period 1979–2017 at a horizontal resolution of (27 × 27) km2 and a temporal resolution of 10–15 days, using a firn model that includes not only compaction, but also firn hydrology including melt, percolation and refreezing. The model has not been evaluated at the two locations of the observed ANITA events. Although there are minor variations in density due of dependence of densification on temperature following the annual cycle, these variations are quite small, and are not large enough to explain the ANITA observations. However, there are additional firn features not accounted for in this model.
For example, ice core samples show substantial density and permittivity variations. We show as an example in the left panel of Fig. 3 a density profile from the East Antarctic Plateau (Laepple and others, Reference Laepple2016). These density variations are quite substantial and may constitute a plausible candidate for the ANITA events, and they are rather common in the 500 m area sampled in Laepple and others (Reference Laepple2016).
It is well-known that the constructive interference effects from scattering on a medium consisting of multiple thin layers can produce a large reflection coefficient at some wavelengths (Vinogradov and Zeldovich, Reference Vinogradov and Zeldovich1977) (see also Pirozhkov and Ragozin (Reference Pirozhkov and Ragozin2015); Stearns (Reference Stearns1989) for generalizations). The ice core sample displayed in Fig. 3 has just this structure, consisting of a number of thin layers with small index of refraction differences. Motivated by this, we display two calculations of the reflection coefficients in Fig. 3. In one case (the red curve), we compute reflection from a medium consisting of regularly spaced layers of 10 cm thickness. This results in a sharp resonance feature, as expected (Vinogradov and Zeldovich, Reference Vinogradov and Zeldovich1977). In contrast, the blue curve assumes layers whose thickness is randomly chosen between 3 and 15 cm. In both instances, the layers have alternating refraction indices, chosen between n 1 = 1.3 and n 2 = 1.6 for a 60° incidence angle. We have explicitly computed the phase change in reflections from regular and random layers, and found that the phase shifts are close to zero for the range of wavelengths with maximal reflectivity, in agreement with the results of Tikhonravov and others (Reference Tikhonravov, Baumeister and Popov1997) for regular layers. We note that reflections from multiple layers will induce a time delay, impacting the measured time profile of the pulse. This makes a multi-layer reflection interpretation of the event reported in Gorham (Reference Gorham2018) unlikely, though it may be a candidate explanation for the event in Gorham (Reference Gorham2016). We stress that the specific ice core sample in the left panel of Fig. 3 and the modeled reflection coefficient in the right panel of Fig. 3 are to be understood merely as a proof-of-principle.
(c) Wind/ablation crusts and Sastrugi: These are abundant in megadune regions, and may create low-density regions with large grains above higher density snow. Sastrugi are essentially wind eroded snow, which make irregular ridges on the surface (Scambos and others, Reference Scambos2012). Given that these regions have a variety of slopes as well, they naturally help explain the lack of double-reflections (simultaneous surface and subsurface reflections). By some estimates, as much as 11$\percnt$
of the East Antarctic Ice Sheet is covered by the so-called ‘wind glaze’ (Scambos and others, Reference Scambos2012), forming a surface with a polished appearance with nearly zero accumulation due to persistent winds. This could produce both the needed reflection phase and range of angles. Since these wind crusts are denser than typical snow, they would naturally have larger indices of refraction than typical surface snow.(d) Ice fabric layers: Ice-sheet fabrics are formed as a result of rheology and stress, leading to macroscopic ice crystal alignment. Some fabrics appear to have the right dielectric properties to produce a reflection without phase inversion even without the index of refraction contrasts (Matsuoka and others, Reference Matsuoka2003). In this case, it is the contrasts in crystal orientation fabric that source strong reflections (Matsuoka and others, Reference Matsuoka2003). The spatial distribution of ice-sheet fabric is not very well known since ice cores are restricted in number and distribution across Antarctica (Wang and others, Reference Wang2018). There is some indication that ice fabric layers are more widespread than originally believed (Wang and others, Reference Wang2018; Siegert and Fujita, Reference Siegert and Fujita2001; Siegert and Kwok, Reference Siegert and Kwok2000), which makes it plausible that the distribution is sufficiently common to produce the observed reflections.
(e) Subglacial lakes: Most lakes appear to be hydrostatically sealed, and therefore lack an air–water interface which would otherwise provide a useful reflecting surface without phase inversion. The bottom of the lake could in principle work, but only rather shallow and low conductivity subglacial lake regions (Schroeder and others, Reference Schroeder, Blankenship, Raney and Grima2015) would be able to produce a reflection without significant attenuation in water. Exploiting the time delay and amplitude attenuation in water, radio echo surveys provided the first direct evidence for that subglacial lakes were at least several meters deep (Gorman and Siegert, Reference Gorman and Siegert1999). Recent model estimates suggest that $\lpar 0.6\pm 0.2\rpar \percnt$
of the Antarctic ice/bed interface is covered by subglacial lakes (Goeller and others, Reference Goeller, Steinhage, Thoma and Grosfeld2016). Given that subglacial lakes lack a water–air boundary, and that they cover ${\lt} 1\percnt$ of the Antarctic area, we do not consider these especially promising candidates for ANITA. We note however the possibility that impurities in the accreted ice above a lake could in principle produce a higher index of refraction layer above a lower index layer, though is likely uncommon. We note that the ice above Lake Vostok has been found to contain ice fabric contrasts, which could source strong reflections (MacGregor and others, Reference MacGregor, Matsuoka and Studinger2009).(f) Snow-covered crevasses/hollow caves/ice bridges: An ice-to-air boundary would have the correct properties for reflection without phase inversion. However, fumarolic and volcanic ice caves do not seem to be sufficiently common for the ANITA events. Crevasses are common in regions of fast flow, but are not common in the middle of the ice sheet where the ANITA events are observed. Note however that drained subglacial lakes (e.g. dolines) are more widespread than previously, and thereby present an additional mechanism for the generation of air cavities within the ice (Lenaerts and others, Reference Lenaerts2017).
(g) Englacial layers of dielectric and/or density contrasts: At depths beyond the firn (though still ${\lesssim} 1$
km), dielectric contrasts in the ice may be sufficiently common to explain the events (Peters and others, Reference Peters, Blankenship and Morse2005; Barnes and others, Reference Barnes, Wolff and Mulvaney2006). Moreover, in principle, density contrasts in deep englacial layers qualitatively similar to what is displayed in Fig. 3 may also source strong reflection coefficients. Recently, radar has been used to detect layers of sediment within the ice (Winter and others, Reference Winter, Woodward, Ross, Dunning, Hein, Westoby, Culberg, Marrero, Schroeder, Sugden and Siegert2019), which could also form a strong englacial dielectric.


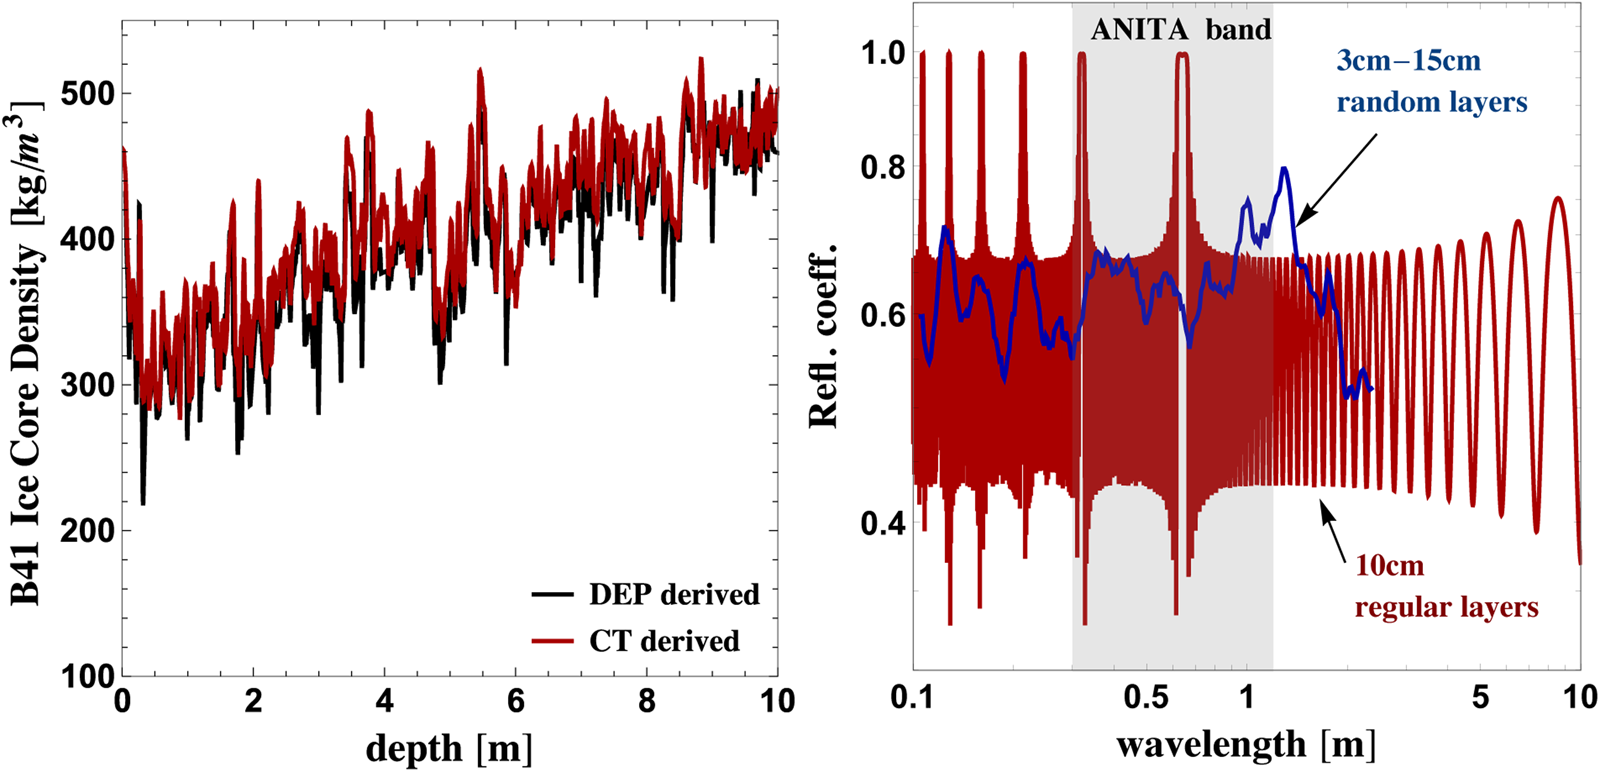
Fig. 3. Left panel: An example Ice Core sample from the East Antarctic Plateau (Laepple and others, Reference Laepple2016). Here the black curve shows the density from a dielectric profiling (DEP) technique, while the red shows the result from high-resolution X-ray computer tomography (CT). Right panel: Power reflection coefficients (in power) for scattering from a multilayered medium as a function of wavelength. The red curve is calculated assuming regularly spaced layers of 10 cm thickness, whereas the blue curve assumes layers whose thickness is randomly chosen between 3 and 15 cm.
4. Future probes
We summarize the status of potential candidates in Table I. Future probes of subsurface reflections can be designed to definitively test the origin of ANITA events and to learn about the properties of Antarctic ice. One can identify the subsurface structures causing reflections by following up with a radar observation at the sites of anomalous events. Although this capability does not yet exist, it may be possible to design a future ANITA-like neutrino experiment using two spatially separated detectors for simultaneous observations of the same reflection, which could provide additional information about the subsurface layers. We leave a dedicated analysis of these possibilities for future work.
Table 1. Summary table of candidates and their ability to satisfy the requirements of the ANITA observations
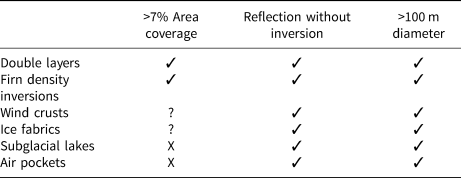
If subsurface features are ultimately responsible for the ANITA events, the distribution and extent of such features will be important for ANITA going forward. Moreover, a dedicated effort to determine if the ANITA events originate from a subsurface reflector may be relevant for glaciology by providing additional information such as the extent, spatial distribution and reflective properties of these features.
In addition, it is possible that ANITA's ultra-high-energy CR waveforms may contain signs (or telling absences) of sub-surface reflections, which may produce multiple or spatially overlapping pulses. Such overlapping pulses can be expected to occur when both surface and sub-surface reflection occurs from the same originating event. Although the two up-going ANITA events do not show evidence of pulse overlap, future data may help elucidate the viability of this hypothesis if overlapping pulses are observed.
Moreover, there are additional relevant data sets that can be exploited in order to provide a comprehensive understanding of surface and sub-surface reflection characteristics. For example, digital echo models (with near total continental coverage) could be utilized for a surface roughness analysis for possible phase inversion (Howat and others, Reference Howat, Porter, Smith, Noh and Morin2019). Second, The Center for Remote Sensing of Ice Sheets (CReSIS) has used ultra-wideband microwave radar to map near-surface internal layers in polar firn, which may contain information on near surface (<1 m depths) reflections (Panzer and others, Reference Panzer2013). Further, the High-Altitude Calibration (HiCal) instrument collected data which specifically targeted surface reflection characteristics (Gorham, Reference Gorham2019).
Additional candidates may come from subsurface features originating from pond refreezing although these may only be limited to ice shelves (Hubbard, Reference Hubbard2016).
5. Conclusions
This paper has examined the possibility of the anomalous up-going ANITA events as originating from ordinary CR-initiated air showers. For this to be consistent with the phase information ANITA observes, they must reflect from a subsurface feature without phase inversion. We have investigated a number of glaciological candidates in order to determine which of these may have properties consistent with ANITA's observations. We have found that subsurface double layers and firn density inversions are a plausible explanation of the anomalous events. In order to conclusively test if surface/subsurface glaciological candidates are responsible for the ANITA events, more information is needed on candidate location, fraction of occurrence in the area sampled by ANITA and a more detailed analysis of the ANITA acceptance. We note that, while firn density contrasts appear to be a plausible candidate, one or more of the other glaciological features discussed here may play a sub-dominant role in sourcing strong un-inverted reflections.
Our results have broad implications for future neutrino and CR experiments. Given the possibility of reflections without a phase inversion, future experiments should not use the phase inversion in radio signals as a sole criterion for discriminating between down-going and up-going events, unless the properties of the subsurface reflection are well understood.
Acknowledgments
We thank the useful feedback from our anonymous reviewers and our Scientific Editor Olaf Eisen. We are very grateful to Thomas Laepple for providing the B41 ice core data from Ref. (Laepple and others, Reference Laepple2016). Furthermore, we acknowledge helpful discussions with Kumiko Azuma, Dmitry Chirkin, Francis Halzen, Stefan Ligtenberg, Henning Loewe and David Saltzberg. The work of I.M.S. is supported by the US Department of Energy under the award number DE- SC0020250. The work of A.K. was supported by the US Department of Energy Grant No. DE-SC0009937, and by the World Premier International Research Center Initiative (WPI), MEXT, Japan. Part of this work was carried out at the Jet Propulsion Laboratory, California Institute of Technology, under a contract with the National Aeronautics and Space Administration. P.K.M. is supported by the Netherlands Earth System Science Centre (NESSC).
Appendix: Acceptance of reflected cosmic rays
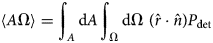
The number of events detected due to an isotropic flux ϕ(E), integrated over a band of energies E, flowing through a reference area A and a range of directions given by solid angle Ω, depends on the observation time t and detection efficiency P det, which, in general, are dependent on all the variables of integration.

Evaluating this integral for an experiment accurately is an involved calculation requiring Monte Carlo simulations and detailed instrument response model. For the purposes of this study, we seek only to bound the behavior of subsurface reflection cosmic ray events in relation to the surface reflection events. For a radio detector, the air shower geometry can be described by taking a point on the surface of the Earth (A) and a direction within solid angle Ω. Since the cosmic ray flux is predominantly isotropic, the range of angles is uniform in the sky. The cosmic ray air shower produces an electric field ${\cal E}$ with amplitude proportional to its energy E. The electric field is reflected off the ice and induces a voltage V at the antenna terminals. A simple model of the detection probability P det is that the voltage V exceeds a threshold value V thr so that P det ∝ Θ(V − V thr), where Θ is the Heaviside step function. The voltage is related to the electric field ${\cal E}$
 via $V=h{\cal E}$
 where h is the effective length of the antenna, which is direction and frequency dependent.
The zeroth-order approximation is to take a characteristic value of the effective length h ≃ h 0 for the range of frequencies and directions relevant to ANITA. In this case, we can translate $P_{{\rm det}}\simeq \Theta \lpar {\cal E}-{\cal E}_{{\rm thr}}\rpar$ and ${\cal E}_{{\rm thr}}=V_{{\rm thr}}/h_0$
 .
.
The electric field is related to the energy of the cosmic ray air shower via ${\cal E}\simeq {\cal E}_0 \alpha \lpar E/E_0 \rpar \lpar d_0/d\rpar$ where E 0 is a reference energy, d is the distance to shower maximum along the reflection path, d 0 is a reference distance, and ${\cal E}_0$
 is a proportionality constant. We have omitted the relation of the magnetic field (mostly vertical in Antarctica) to the direction of the shower and assume an average value here. The value α here is meant to capture the effects of reflections and transmission through ice for the various cases under consideration. To zeroth order, we omit the dependence on cosmic ray direction and approximate the distance to the cosmic ray shower maximum as d ≃ d 0 so that ${\cal E}\simeq {\cal E}_0 \alpha \lpar E/E_0\rpar$
 . With this approximation, we can assume a threshold energy $E_{{\rm thr}}=E_0\lpar {\cal E}_{{\rm thr}}/{\cal E}_0\rpar /\alpha$
 .
.
The cosmic ray flux, over a limited energy band, can be approximated by a power law ϕ(E) ≃ ϕ 0(E/E 0)−γ. With our zeroth-order approximations on the direction of cosmic rays

where the acceptance 〈AΩ〉 is the combination of points on the surface and cosmic ray arrival directions that would trigger the detector given by
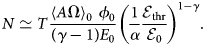
This value is generally energy dependent but in our zeroth-order approximation, we are evaluating 〈AΩ〉0 at a characteristic energy E 0. With our approximations, we arrive at

or, in terms of the electric field threshold,
Now take N CR for the surface-reflected cosmic ray events and N anom for the anomalous events. Since the hypothesis is that the difference is due to surface reflections and subsurface reflections, we can estimate αCR ≃ r refl where r refl is the electric field reflection coefficient of the surface of the ice. For the subsurface events $\alpha _{\rm anom}=\lpar 1-r_{\rm refl}^2\rpar r_{\rm sub}$ where r sub is the electric field reflection coefficient for the subsurface interface and the factor of $\lpar 1-r_{\rm refl}^2\rpar$
 is due to the electric field being transmitted in and out of the ice–air interface.
Assuming that the typical direction of surface and subsurface reflected events is comparable (to zeroth order), then we arrive at the ratio

Assuming a spectral index γ ≃ 3 and using the power reflection coefficients $R_{\rm refl} = r^2_{\rm refl}$ and $R_{\rm sub} = r^2_{\rm sub}$
 , we arrive at the result


 Open access