


Introduction
Mountain glaciers have declined worldwide as a result of recent global climate change (Reference OerlemansOerlemans, 1994; Reference Haeberli, Cihlar and BarryHaeberli and others, 2000; Reference McCarthy, Canziani, Leary, Dokken and WhiteMcCarthy and others, 2001). Reduction in mountain glacial coverage has also been reported from central Asian mountains (Reference Liu and HanLiu and Han, 1992; Reference AgetaAgeta 1995; Reference Kotlyakov, Osipova, Popovnin and TsvetkovKotlyakov and others, 1996). The changing positions of glacial termini had been documented for the 20th century in the former USSR (Reference Petrov and SchetinnikovPetrov and Schetinnikov, 1974), and rapid retreat rates of these glaciers have accelerated since about 1975 in the central Asian mountains (Reference NaramaNarama, 2002). In the Ak-Shiirak range in the northeast of the Kyrgyz Republic, aerial photographs and Advanced Spaceborne Thermal Emission and Reflection Radiometer (ASTER) images show that the glacier coverage decreased from 1977 to 2001 (Reference Khromova, Dyurgerov and BarryKhromova and others, 2003). Mountain glaciers in semiarid regions such as central Asia are the principal reservoirs of water. However, glacier monitoring studies have not yet been conducted for a considerable part of central Asia.
Recent glacier monitoring uses satellite images as part of a project of the international Global Land Ice Measurements from Space (GLIMS). For example, changes of glacier coverage are reported in the European Alps, using satellite images taken at different times (Reference Kääb, Paul, Maisch, Hoelzle and HaeberliKääb and others, 2002; Reference PaulPaul, 2002; Reference Paul, Kääb, Maisch, Kellenberger and HaeberliPaul and others, 2002, Reference Paul, Kääb, Maisch, Kellenberger and Haeberli2004b). Satellite imagery is also used for inventories of glaciers in Scandinavia and the Andes (Reference Sidjak and WheateSidjak and Wheate, 1999; Reference Andreassen, Elvehøy and KjøllmoenAndreassen and others, 2002; Reference Casassa, Smith, Rivera, Araos, Schnirch and SchneiderCasassa and others, 2002; Reference GeorgesGeorges, 2004). Such satellite image-based studies have permitted widespread, quantitative monitoring of glacier coverage and loss inventories. Many satellite photographs taken over the former USSR by Corona, the US reconnaissance satellite that operated from 1960 to 1972, are ideal for use in glacier studies throughout a large part of central Asia. In this study, the objective is to investigate recent amounts of glacier shrinkage in the Terskey-Alatoo range of the Kyrgyz Republic using Corona and Landsat satellite images.
Research Area
The research area is in the western part of the Terskey-Alatoo range. It is located along the south shore of Issyk-Kul lake, in the Kyrgyz Republic (Fig. 1). The Terskey-Alatoo range, with elevations up to about 4500−5000 m a.s.l., belongs to the Syr Darya drainage system. Glacier termini in the Terskey-Alatoo range are at elevations of 350−3800 m. Elevations in this part of the northern Tien Shan are low, the accumulation areas of glaciers are small and most glaciers have area extents of <5 km2.
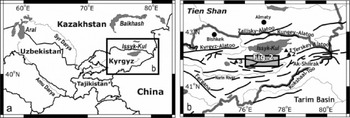
Fig. 1. (a) Research area in the western part of the Terskey-Alatoo range, Kyrgyz Republic. The range is located on the south shore of Issyk-Kul lake (1608 m a.s.l.), in the headwaters of the Syr Darya river. (b) Mountain ranges of the northern and central Tien Shan. The dark inset shows the research area of Figure 2. ∼1–3 show locations of local meteorological stations: ▲ 1 : Kyzyl-Su (1740 m a.s.l.); ▲ 2 : Chon-Kyzyl-Su (2555 m a.s.l.); ▲ 3 : Kara-Kudjur (2800 m a.s.l.). Thick lines indicate mountain ranges, and gray line is the border of Kyrgyz/Kazakhstan and China.
Precipitation in central Asia is triggered by the interaction between the atmospheric circulation from the Siberian high and westerly disturbances, together with the local influence of mountain landforms (Reference Aizen, Aizen and MelackAizen and others, 1995). Glaciers in the northern Tien Shan accumulate mainly in spring, when the peak annual precipitation occurs. The precipitation is different in the eastern and western parts of the Terskey-Alatoo range. In the western part, the Kara-Kudzhur meteorological station at 2800 m a.s.l. has an annual precipitation of 366 mm, whereas the Chon-Kyzyl-Su meteorological station at 2555 m a.s.l. in the eastern part has an annual precipitation of 598 mm (location in Fig. 1; Reference Dyurgerov, Liu and XieDyurgerov and others, 1995). Forests are present in the eastern part, whereas the gentle mountain slopes of the western part are characterized by grasslands.
Methods
Image dataset
For assessing present glacial coverage, a Landsat 7 Enhanced Thematic Mapper Plus (ETM+) image taken on 3 October 2002 over the western part of the Terskey-Alatoo range was used (path 149, row 031; central point: 41˚45’40"N, 76˚53’31"E). Landsat is effective for comparing glacier areas in the same scene and on the same day, because it covers the large area of 180 × 180 km2.
Corona satellite photographs were used to assess the former glacier coverage. Many Corona images in the former USSR territory were taken during the period 1960−72 and are useful for assessing environmental changes in this area. Stereo matching is possible because many exposures were taken as stereo images (fore- and aft-looking cameras). The field of view (5.54 × 75.69 cm2) was 14 × 188 km2. Three satellite photographs (Nos. DS1115-2169DA007, DS1115-2169DA008 and DS1115-2169DA009; mission No. 1115) taken at a scale of 1 :247 500 on 23 September 1971 were used in this study. These KH-4B images have a resolution of 1.8 m.
The digital elevation model (DEM) of the Shuttle Radar Topography Mission-3 (SRTM-3) was used for making orthoimages of Corona. SRTM DEMs have gaps in the original data (Reference KääbKääb, 2005); researchers have used SRTM DEMs interpolated with ASTER DEMs (Reference KääbKääb, 2005); they have also used SRTM DEMs to compensate for cloudy areas in ASTER DEMs (Bolch, 2004). Data gaps in the SRTM DEMs in our research area were interpolated by the ASTER DEM taken on 5 September 2001 (central point: N41.928623, E76.705742).
Corona film images are elongated, and image distortion is substantial at the margins. Orthorectified images of Corona could be generated using global positioning system (GPS) data obtained in the field (Reference Altmaier and KanyAltmaier and Kany, 2002), and an original algorithm for the mathematical model (Reference Sohn, Kim and YomSohn and others, 2004; Reference Sugimura, Tanaka, Yamamoto and IsobeSugimura and others, 2004). In this study, Corona images were digitally scanned at 2000 dpi and orthorectified using a bundle adjustment and a camera model with the SRTM-3 DEM and 1:25000 topographic maps to locate ground-control points (GCPs). The software for the image analysis was ERDAS IMAGINE 8.6 (Leica Geosystems Geospatial Imaging, LLC).
Field survey and the classification of glaciers and snow
The areas of glacier coverage are extracted using the ratio image of Landsat bands (Reference Sidjak and WheateSidjak and Wheate, 1999; Reference PaulPaul, 2002; Reference Paul, Kääb, Maisch, Kellenberger and HaeberliPaul and others, 2002), because the reflectivity of ice differs from that of snow (Reference Clark and RenczClark, 1999). Glacier areas derived from the ratio image of bands 3/5 were analyzed automatically as data of a vector type. Glaciers were removed from the analysis if they were <0.05 km2 on 1971 Corona images. The extent of glacier ice and glacier in shadow were identified from 1971 Corona, 1999 (9 September) and 2002 Landsat 7 ETM+ images. The 1:25000 topographic map and the watershed areas, calculated using the flood-routing algorithm of Reference Nogami, Kumamoto, Nakayama, Tanaka and OtoguroNogami and others (1998) with the DEM, were used to delineate the boundaries between glacier areas around mountain ridges.
Most small glaciers are debris-free in this area, but some glacier termini had thin debris covers. Such parts could not be identified from images that depict the bands 3/5 ratio. We checked the existence of debris-covered glaciers in the field. These debris-covered glacier termini were identified using three-dimensional (3-D) images from Landsat 7 ETM+ and slope angle classification from the SRTM DEMs. To confirm this result, some terminus positions were surveyed by GPS (GPS Map 76S from Garmin) in summer 2003, and the positions of the glacier termini were documented on the northern slope of the Terskey-Alatoo range. Positions of the glacier termini in 1971 were confirmed using photographic interpretation of the Corona images. Glacier areas larger than 0.05 km2 were calculated by ArcView 8 (ESRI, Inc.) software.
Results
Field observations of glacier fronts
Field observations of glacier fronts were conducted over the range’s north face; glacier fronts included clean (debris-free) and debris-covered types. The largest valley glacier had a terminus elevation of 3350 m, lower than the 3600–3800 m of small-scale alpine glaciers. Most glaciers observed on the north face had clean fronts; some debris was observed on the steep back walls of large valleys, but the debris layer was fairly thin. The largest glacier in the study area was Chon-Karagoman glacier (Inventory 14-1-4, No. 58) on the south face, with an area of 9.4 km2.
To examine differences in the terminus positions of debris-covered and clean glaciers, GPS measurement was employed to determine the positions of some glacier fronts (Fig. 2). Figure 3 shows the Konur-Olen glacier terminus area on the north face of the Terskey-Alatoo range. The glacier terminus position determined using the Landsat ETM+ ratio image of bands 3/5 differs from the GPS-determined position, because the ratio image is not able to extract a glacier area from a debris-covered glacier (Fig. 3b); GPS and terminus positions coincide in clean-type glacier fronts. Reference Paul, Huggel and KääbPaul and others (2004a) extracted glacier area using a combination of many elements such as the slope and vegetation. This study applied Landsat 3-D and slope images to extract the range of debris on glaciers. We can confirm the terminus outline of debris-covered glaciers from 3-D images. The debris-covered glacier termini could also be identified by using the break point of the terminus slope of the glacier shown by classified slope data of the SRTM DEM images. These glacier terminus positions coincided with GPS-determined positions. The debris-covered area of Konur-Olen glacier is 0.12 km2 and its length is 350 m.
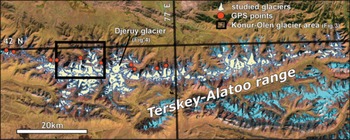
Fig. 2. Distribution of the glaciers in the western Terskey-Alatoo range. The area covered is shown in Figure 1b. A total of 269 glaciers were surveyed in this study. Red circles show GPS points at glacier termini in the field research. The image is from Landsat bands 3, 4, 5 (blue, green, red, respectively).
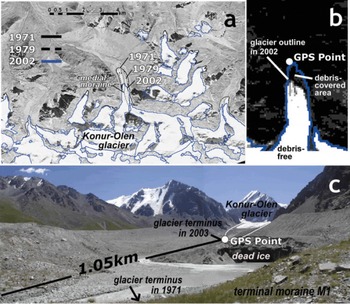
Fig. 3. Images of Konur-Olen glacier terminus area. (a) Corona image shows that the glacier lost 0.22 km2 between 1971 and 1979, and 0.44 km2 between 1979 and 2002. The glacier terminus line in 1979 was determined from aerial photographs. (b) Debris-free area of the glacier determined using the Landsat ETM+ ratio image of bands 3/5. Blue line shows glacier outline including debris-covered area. The debris-covered area is 0.12 km2 and length is 350 m. (c) Photo of the glacier front shows dead ice remains inside the terminal moraine M 1. This photo was taken from M1 during summer 2003.
Handling of Corona data and image results
Corona orthoimages were constructed using 1 : 25 000 topographic maps and the SRTM DEM interpolated using the ASTER DEM. This study used more than 60 GCPs on each image and on the topographic maps to perform orthorectification; the root-mean-square errors (rmse) for orientation from the GCPs were within 30.0 m. The results were better than those provided by the ASTER DEM, and the rectified Corona image agreed with the 1 : 25 000 topographic maps. The orthorectification of the Landsat image used 46 GCPs from the 1:25000 topographic maps. The rmse was 25.7 m.
Figure 3a illustrates comparative Landsat and Corona and aerial-photo images, showing the Konur-Olen glacier front on the north face of the Terskey-Alatoo range. Konur-Olen glacier (Inventory 14-2-5, No. 22) had an area of 5.0 km2, and the terminus elevation was 3350 m. The aerial photo taken in 1979 was orthorectified by the same method as the Corona image. The images indicate a trend of decreasing glacier area in 1971, 1979 and 2002; the glacier lost an area of 0.66 km2 between 1971 and 2002. The glacier retreated 1.05 km from the terminus position in 1971 over 30years (1971–2002); the glacier’s recession was largest in this area (Fig. 3c). The elevation data from the topographic map and SRTM DEM show Konur-Olen glacier lost about 90 m of ice thickness around the present glacier terminus. There is a terminal moraine M1, covered with little vegetation at the glacier front at 3250 m a.s.l. This position coincides with the glacier terminus in 1971 on the Corona image. Dead ice was observed inside the terminal moraine M1, showing that the glacier had retreated rapidly since 1971. The rapid recession is also shown by sparse vegetation cover and fresh stones on the riverbed between the moraine M1 and the glacier terminus. Although a clear medial moraine indicated that Konur-Olen glacier consisted of two large glaciers in 1971, at the time of this study there were two separate glaciers. These rapid recessions were confirmed by field observations on some larger glacier fronts (Fig. 4).
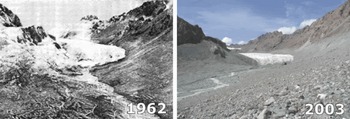
Fig. 4. Change of terminus of Djeruy glacier (Inventory 14-2-5, No. 37) in the Temir-Kanat area. Location of this glacier is shown in Figure 2. This glacier retreated about 450m between 1971 and 2002. Source of 1962 photo and glacier information is Kyrgyz Academy of Science (1973, 1976).
Glacier changes in the Terskey-Alatoo range
Because the Terskey-Alatoo range, which is 300 km long, runs in an east–west direction, present glacier coverage is very similar on the north and south sides of the mountain ridgeline (Fig. 2). Two glacier types are present: valley glaciers that coalesce with one another, and small-scale alpine glaciers located near the equilibrium line. A total of 157 glaciers were present on the north side and 112 on the south side. Although 67 of the measured glaciers were larger than 1 km2, most were smaller than 1 km2. Glacier coverage in 1971 as determined from Corona images was 151 km2 on the north side and 94 km2 on the south side. The total area of present glacial coverage extracted from the Landsat image was 226 km2, with 140 km2 on the north side and 86 km2 on the south side. The loss over the 30 years from 1971 to 2002 is therefore about 10.7 km2 on the north side and 7.7 km2 on the south side, giving a total loss of 18.4 km2, or 8% of the original coverage in 1971. The shrinkage in the south is larger than in the north.
Trend of glacier shrinkage
Figure 5 shows the relation between shrinkage and glacier area for the 30 year interval. A few glaciers stagnated, but most shrank. For the glaciers that were originally larger than 1 km2, the change in glacier area did not exceed 20%; however, the shrinkage of glaciers smaller than 1 km2 was up to 40%. This result shows that the small-scale glaciers were sensitive to local climate change. Large glaciers are therefore shrinking more slowly than small glaciers. No glaciers shrank more than 1 km2 in the past 30 years. For the 30 year interval, the largest amount of retreat of a glacier terminus in the study area is 1.05 km (Fig. 3). Larger glaciers have larger recession distances in field observations (Fig. 4), because such glaciers are the valley type with lower terminus elevations. Nevertheless, the overall shrinkage for coverage loss for large glaciers is relatively small.
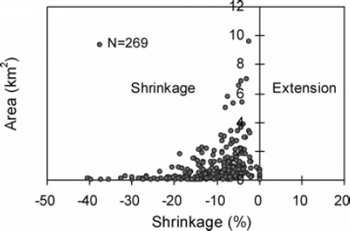
Fig. 5. Relation of shrinkage and glacier area. Most glaciers shrank between 1971 and 2002.
Figure 6 shows the distribution of glacier sizes. The total coverage by glaciers in the small size ranges of 0.1–1 km2 is significant. Although the glaciers of area <1 km2 represent only 28% of the total coverage, they represent 38% of the total 18.4 km2 area of glacier coverage lost in the last 30 years. Therefore, small-scale glaciers contribute disproportionately to coverage loss. This relation has also been noted in the European Alps (Reference Kääb, Paul, Maisch, Hoelzle and HaeberliKääb and others, 2002; Reference PaulPaul, 2002).
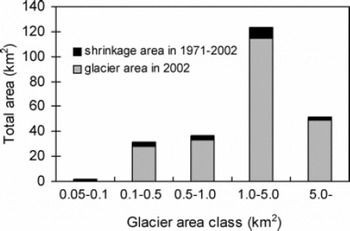
Fig. 6. Glacier area lost, by glacier size.
Discussion
Relationship between glacier change and climate change
Most glaciers in the study area exhibited shrinkage. Climate data from local meteorological stations support these results. Figures 7 and 8 show monthly precipitation and monthly mean temperature data collected by the Kyzyl-Su and Chon-Kyzyl-Su meteorological stations (Fig. 1b) from 1960 to 2000; these stations are located near the middle of the Terskey-Alatoo range. Kyzyl-Su meteorological station has an elevation of 1740m and is located in the village of Kyzyl-Su on the south shore of Issyk-Kul lake; this station has collected data from 1951 to the present. The Chon-Kyzyl-Su meteorological station is located at an elevation of 2555 m in a valley bottom within a mountainous area; this station is 20km upstream from the village of Kyzyl-Su, where the Chon-Kyzyl-Su river flows. This station collected data from 1948 to 1991; observations ended when the USSR dissolved.
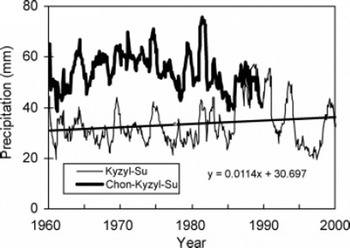
Fig. 7. Twelve-month running mean of monthly precipitation at Kyzyl-Su (1740 m a.s.l.) and Chon-Kyzyl-Su (2555 m a.s.l.) meteorological stations, 1960–2000. Observation at the Chon-Kyzyl-Su station ended in 1991. For Kyzyl-Su, the trend from 1960 to 2000 is also depicted.
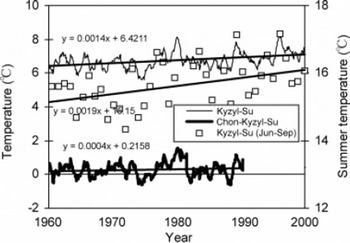
Fig. 8. Twelve-month running mean of monthly temperature at Kyzyl-Su and Chon-Kyzyl-Su meteorological stations, 1960–2000, and summer average temperature (June–September) for Kyzyl-Su station. Observation at Chon-Kyzyl-Su ended in 1991. The longterm trends are also shown.
Fluctuations in precipitation recorded at these two meteorological stations indicate similar year-to-year variations (Fig. 7). However, monthly precipitation was 20mm higher at the Chon-Kyzyl-Su meteorological station, owing to its higher elevation and mountainous location. From 1960 to 1990, annual precipitation at the Chon-Kyzyl-Su station averaged 580mm, while at Kyzyl-Su it was 340 mm. Spectral analysis by the maximum entropy method of Kyzyl-Su data for 1951–2001 revealed precipitation fluctuation cycles of 19.4 and 6.8 years (figures not shown). A rapid increase in precipitation was observed in the latter half of the 1980s; however, precipitation decreased from the latter half of the 1970s until the mid-1980s, and through the 1990s. Glacier shrinkage is associated with this decreasing precipitation trend, which is considered to correspond to the 19.4 year cycle. Temperature has risen continuously since the 1960s (Fig. 8). This figure also indicates the repeated fluctuations of the 8.7 year cycle. Increases in summer (June–September) temperatures are particularly apparent and lead to a higher ablation rate on the glacier. These climatic conditions are conductive to the negative mass balance which caused the glacier shrinkage in the study area. Because summer temperatures rose throughout the period 1960–90, it is important to note that glacier shrinkage was especially enhanced in the 1990s, under the decreased precipitation conditions.
Glacier change in the northern Tien Shan
This subsection compares results from the Terskey-Alatoo range with results from other central Asian mountains. In the Ak-Shiirak range (Fig. 1b), south of the Terskey-Alatoo range, with an annual precipitation of 191 mm in 1951–82, glacier coverage declined by about 35.2 km2 (9%) between 1977 and 2003 (Table 1); these results were determined from ASTER images and aerial photographs (Aizen and others, 2006). Although the Ak-Shiirak range has a drier environment, it has the same shrinkage as the western Terskey-Alatoo range. These results indicate that glaciers in the Issyk-Kul lake region shrank significantly over about 30years, coinciding with rapid recessions of observed glacier termini after 1975 in the central Asian mountains (Reference NaramaNarama, 2002). It is possible that the higher summer temperatures affected the mass balance of glaciers in the region. Although Ak-Shiirak glaciers are in a larger size classification than the glaciers in the Terskey-Alatoo range, they have the same shrinkage. Even small glaciers (<1 km2) in the study area had pronounced shrinkage. Small glaciers are more sensitive to local climate changes, and together can make a significant difference to the area of total glacier shrinkage. Thus, it is noteworthy that loss in glacier coverage is greatest in areas with numerous small glaciers, such as the Kungey-Alatoo and Kyrgyz-Alatoo ranges near the Terskey-Alatoo range (Fig. 1b).
Table 1. Changes of glacier coverage in inland Asia (Kyrgyz and China). The location of the Ak-shiirak range is shown in Figure 1b
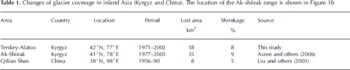
Between 1956 and 1990, glacial coverage in the western part of the Qilian Shan (which are located on the Tibetan Plateau and have an annual precipitation of 150–400 mm) declined by 5%; these results were determined from Landsat 5 Thematic Mapper images and topographic maps based on aerial photographs (Reference Liu, Sun, Shen and LiLiu and others, 2003; Table 1). Many small glaciers are located in this area. However, because the area is a very dry environment, the glacier shrinkage is smaller than that of central Asian glaciers. These results show that glacier coverage has decreased throughout semi-dry areas of inland Asia. Glacier monitoring should be carried out throughout inland Asia because data in this area are presently inadequate.
Conclusions
By comparing Corona images from 1971 and a Landsat satellite image from 2002 we found significant amounts of glacier reduction in central Asia. The total glacier coverage in the western Terskey-Alatoo range decreased by 18.4 km2, which is an 8% decrease over the 30year interval. The shrinkage of small-scale glaciers was even higher, a finding that suggests a future decline in water supply, because this area has many small-scale alpine glaciers. There is an obvious link between recent climate change and glacier shrinkage, and this should be assessed in other areas using satellite images. The high resolution of Corona images of the former USSR and the fact that they extend back to the 1960s make them an ideal resource for researching changes in glacier coverage.
Acknowledgements
We thank C. Ormukov of the Kyrgyz Academy of Science and T. Kajiura of Rissho University for accommodation during the field survey; H. Matsuyama, T. Sugimura, T. Yamanokuchi, A. Yamamoto, A. Kääb, T. Bolch, D. Shangguan, H. Ushiki and K. Hirose for scientific advice; and V. Aizen and H. Surazakov for the use of data from the Ak-Shiirak range. We also thank H.H. Brecher and two anonymous reviewers for valuable comments on the manuscript. This study is the result of joint research (No. J-0410) with the Japanese Earth Remote Sensing Data Center (ERSDAC), which supplied ASTER images. This work was supported by the Ministry of Education, Culture, Sports, Science and Technology, Grant-in-Aid for JSPS Fellow (grant No. 16-5608), by the United Nations University for Akino Fellowship, and the Fukutake Science and Culture Foundation.


