


Introduction
Since the 1980s, numerical flow models have proven to be valuable tools for analyzing glacier response and dynamics, deriving past climate variability and predicting future glacier behaviour (e.g. Reference KrussKruss, 1984; Reference OerlemansOerlemans and others, 1998). Unfortunately, the source information required for these models (glacier geometry, mass balance, velocity, historical front observations, etc.) is lacking in many glacier areas. To overcome this lack of data, attempts have recently been made to generalize existing ideas on glacier behaviour (e.g. Reference OerlemansOerlemans, 1994; Reference BahrBahr, 1997; Reference OerlemansOerlemans and others, 1998; Reference Dyurgerov and BahrDyurgerov and Bahr, 1999). Preliminary results of such efforts are rather ambiguous and show the need for further expansion of the current record of detailed individual glacier studies, especially for remote and inaccessible areas.
In this paper, we investigate the dynamic response of Sofiyskiy glacier, located in the Russian Altai mountains (Fig. 1) in central Asia, with a one-dimensional flowline model. Hardly any century-scale information on climate or glacier variations is available for the Altai mountains. Also, little is known about the dynamics of the so-called continental summer-accumulation-type glaciers in central Asia, i.e. glaciers where the accumulation and ablation season coincide in summer, as winters are generally too cold and too dry to add significant mass-balance variability. Nevertheless, these glaciers are reported to be more vulnerable to the current global warming trend than better-known (maritime) winter-accumulation-type glaciers (Reference Fujita and AgetaFujita and Ageta, 2000; Reference N., Ageta, Nakawo, Waddington, Raymond and ConwayNaito and others, 2001). Furthermore, many central Asian glaciers experience rapid shrinking, and the current trend suggests this wastage will accelerate (Reference DyurgerovDyurgerov, 2002).
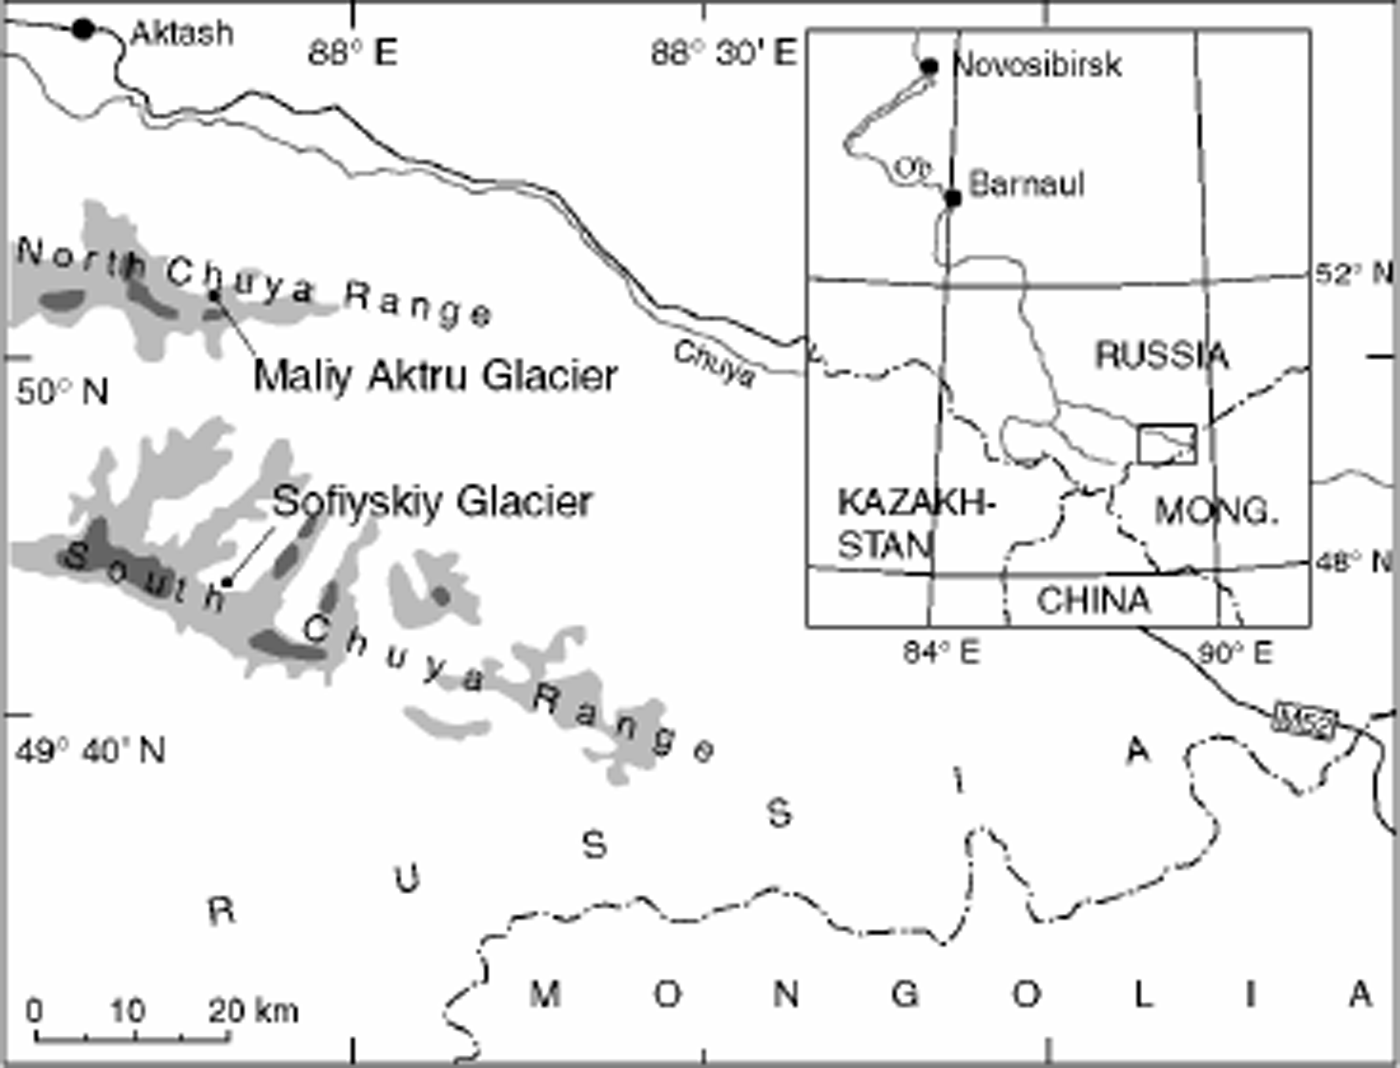
Fig. 1. Location map of the Altai mountains and the study area (Sofiyskiy glacier). Light-grey and dark-grey areas indicate zones above 3000 and 3500 m a.s.l., respectively. Also shown are Chuya river (grey line) and the M52 track (black line).
Available Field Data
Sofiyskiy glacier (Fig. 2) consists of a main (A) and two side basins (B, C). At present, B and C are no longer connected to A (site observations, 1997–2000). In 2000, the glacier was 7 km long. Direct measurements of the glacier’s front position go back to 1898, and the oldest of three dated end-moraines was found to have formed in 680 ± 60 BC. A large number of recent surface velocity and ice-thickness measurements are also available. From the latter, the bedrock topography along the central flowline was derived. The broad accumulation area and the flat valley floor beneath the icefall stimulate a high sensitivity to climate variation, which should make Sofiyskiy glacier a reasonable climate indicator.

Fig. 2. Contour map of Sofiyskiyglacier based on a 1952 topographic map. At present, basins B and Care no longer connected with the main ice flow. “Camp” indicates the position of the glacier camp.
The record of mass-balance measurements at Sofiyskiy glacier is short, from 1998 to 2000. Therefore, we conduct parallel experiments with two sets of mass-balance reference profiles (Fig. 3): one based on the short Sofiyskiy glacier record, and the other based on the long-term mass-balance observations (1962–99; Reference Hoelzle and HaeberliHoelzle and Haeberli, 1999; contributors: V. Kotlyakov and M. Kunakhovitch) at Maliy Aktru glacier, situated 30 km to the north (Fig. 1). In our simulations, both profiles are assumed to be representative of present conditions. In the following, they are referred to as Sofand MAK, respectively. For a more detailed description of Sofiyskiy glacier and the field data discussed here, we refer to Reference PattynPattyn and others (2003).

Fig. 3. Mass-balance reference profiles of Sofiyskiy glacier (solid line, Sof) and Maliy Aktru glacier(dashed line, MAK) (Reference PattynPattyn and others, 2003).
Glacier Model
The glacier model is similar to that used in Reference JόhannessonHuybrechts and others (1989) and describes the flow of ice along a central flowline. This flowline runs from the head of the glacier for 17 km downstream into the Akkol valley. A grid spacing of 100 m was employed. Because of their small size and the lack of reliable information on their geometry, separate modelling of side basins B and C was not considered.
Although the model is basically one-dimensional, the two-dimensional geometry of the glacier is implicitly taken into account by a varying width factor b for each gridpoint, which depends on the local ice thickness H at the central flowline. Assuming a parabolic-shaped valley, this dependency is (Reference Huybrechts, de Nooze, Decleir and OerlemansHuybrechts and others, 1989)
with b ref and H ref reference values corresponding to present conditions. Down the glacier front, values of b ref were generated with a constant ice thickness H ref of 100 m.
The dynamic behaviour of the glacier is described in terms of changes in ice thickness at the central flowline. Assuming a constant ice density, the continuity equation reads:
with M the local specific mass balance. M is calculated from altitude-independent mass-balance variations relative to the mass-balance reference profile. The depth-averaged ice velocity at the central flowline U is the sum of the internal deformation velocity Ud and the sliding velocity Us. The following equations are used to calculate U (Reference GreuellGreuell, 1992; Reference PatersonPaterson, 1994):
Here, A and As are deformation and sliding parameter, respectively. τd is driving stress and h is surface elevation. Based on values suggested by Reference PatersonPaterson (1994, p. 9), the ice density p was taken as 870 kg m–3. The shape factor s is a measure for lateral friction and was calculated from values suggested by Reference NyeNye (1965).
Note that the contribution of basal water pressure to sliding is not explicitly taken into account. Instead, a bulk effect is included in the sliding parameter As. The flow parameters A and As are not known accurately and depend on bed conditions, debris content and crystal structure of the basal ice layers. Their values were obtained from tuning of the modelled surface elevation and velocities to observed values under steady-state assumptions and are similar for the Sof and MAK profiles:
These values are within the range of flow parameters used in similar studies (e.g. references in Reference PatersonPaterson (1994) and Reference OerlemansOerlemans and others (1998)). Since much of the upper part of the glacier seems to be either frozen to the bedrock or underlain by low porous material (Reference PattynPattyn and others, 2003), no-slip conditions were adopted upstream of km 3.3.
The flow model uses a semi-explicit scheme for time integration, allowing a larger time-step than conventional explicit schemes. A stable and accurate solution was found for a time-step of 0.01 years. The performance of the model was checked against the European Ice-Sheet Modelling Initiative (Eismint) benchmarks and reference experiments given in Reference Huybrechts and PayneHuybrechts and others (1996).
Response Characteristics
To obtain a general insight into the dynamic behaviour of Sofiyskiy glacier, two sets of basic sensitivity experiments are carried out. First, the length response time τ of the glacier is determined (cf. Reference Huybrechts and PayneHuybrechts and others, 1989). This parameter characterizes the glacier’s steady-state sensitivity to sudden mass-balance changes. Length changes and response times were calculated for various mass-balance changes (Fig. 4). The presence of the icefall between km 4.5 and 5.5 of the long profile causes a fast glacier retreat starting from 5.5 km for large negative mass-balance changes.

Fig. 4. Reaction of the glacier front position to a stepwise change in surface mass balance of given magnitude (in m w.e. a–1) for Sof (a) and MAK (b) profile. The corresponding response time τ is given in years.
In reality, a glacier is always in a transient state, responding to past climate changes. Therefore, the reaction time of a glacier is probably a more realistic description of glacier dynamics. This parameter is defined as the time lag between a sinusoidal climate forcing and the pseudo-sinusoidal front variation response of a glacier, and is calculated in a second set of experiments (cf. Reference KrussKruss, 1984).
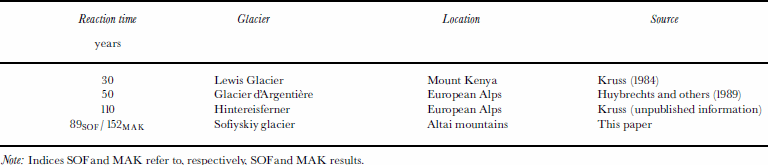
In Tables 1 and 2, the results of both sets of experiments are compared to results found for other glaciers. Both tables show that Sofiyskiy glacier responds relatively slowly to climate variation. This is reasonable, given the low mass turn-over of the glacier owing to the region’s continentality. There are, however, similarities with relatively slow-responding glaciers of the European Alps like Hintereisferner and Paster-zenkees.
Table 1. Comparison with length response times found for other glaciers

Table 2. Comparison with reaction times found for other glaciers for a sinusoidal mass-balance forcing with a period of 1000 years.
Simulation of Historical Front Variations
Simulation of the historical front variations of Sofiyskiy glacier was achieved via dynamic calibration (Reference OerlemansOerlemans, 1997b) (Fig. 5). This technique consists of minimizing the difference between modelled and observed historical front variations by experimentally determining a stepped mass-balance variation forcing, thus allowing a rough reconstruction of the recent mass-balance history. The two mass-balance reference profiles correspond, by definition, to a mass-balance variation dM = 0.
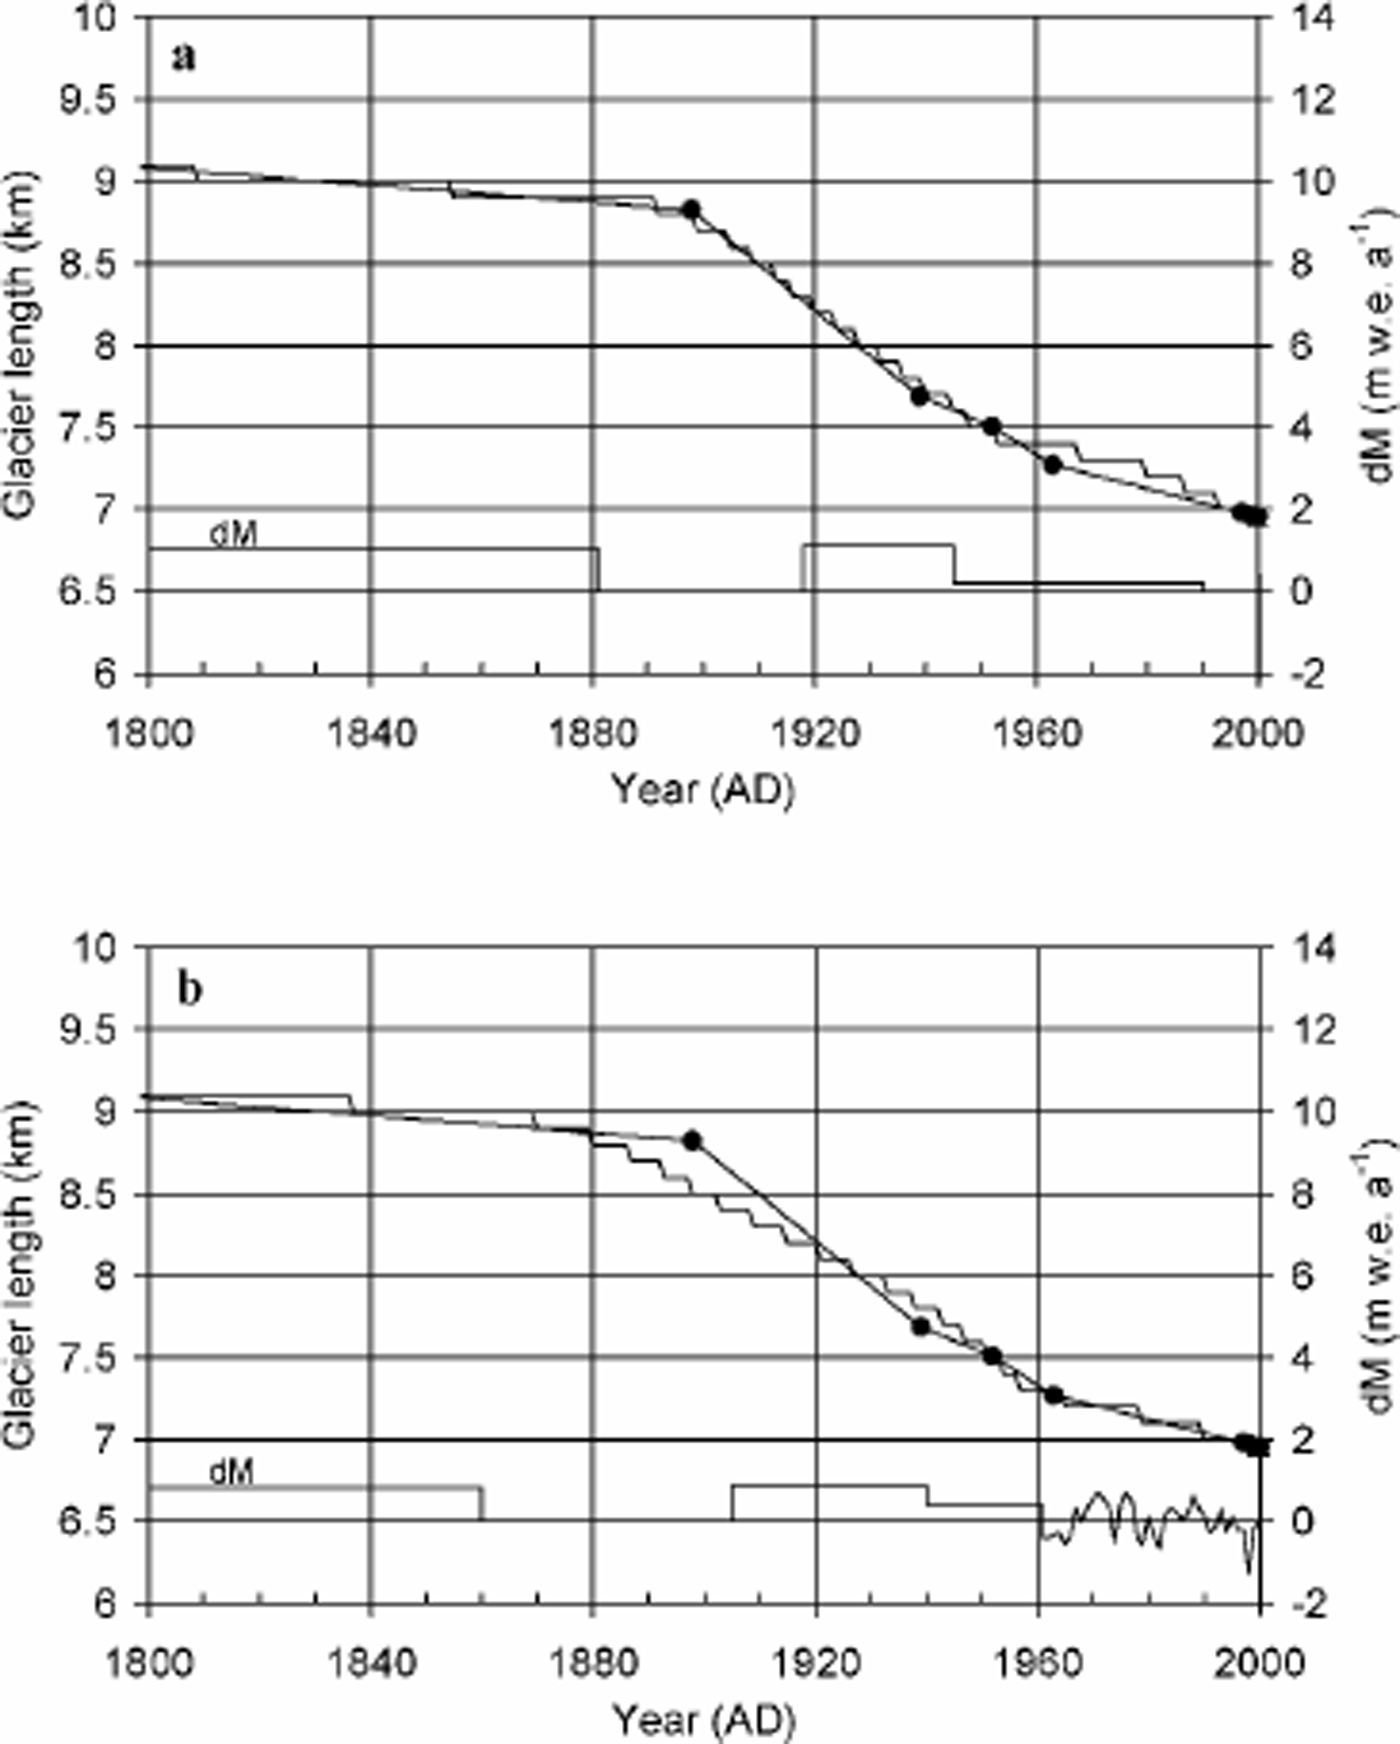
Fig. 5. Result of the dynamic calibration for Sof (a) and MAK (b) profiles. The observed glacier stands are marked by black dots. The lower solid line is the reconstructed balance history.
The first four glacier stands of Sofiyskiy glacier (680 BC, AD 1240, AD 1630, AD 1898) are separated by time intervals largely exceeding the glacier reaction and response time. Hence, these front positions can be simulated using various kinds of mass-balance forcing. Since we are interested in more recent (historical) glacier variations, we consider the first two millennia of the simulation period as a so-called tuning period, starting from a presumed steady-state condition in 680 BC. Starting conditions are defined as dM = 1.53mw.e. a–1 and dM = 1.15 mw.e. a–1 for the Sof and MAK profiles, respectively.
By gradual lowering of the surface mass balance towards the 19th century, a successful simulation of the first four glacier stands was performed. It appeared that a steep fall to present conditions (dM = 0) was required in AD 1881 and 1860, for the Sof and MAK profiles, respectively, to initiate the rapid 1898–2000 retreat. To prevent too fast a glacier retreat towards the middle of the 20th century, an equally large rise in surface mass balance was adopted in AD 1918 and 1905, for the Sof and MAK profiles, respectively. Another fall in surface mass balance halfway through the 20th century completes the front record simulation. For the MAK profile forcing, derived mass-balance variations were used between 1962 and 1999. The mean rms difference between modelled and observed front variations for the 1898–2000 period is 80 and 104m for the Sof and MAK profiles, respectively.
Note: Indices Sofand MAK refer to, respectively, Sofand MAK results.
Note: Indices Sof and MAK refer to, respectively, Sofand M A K results.
The two versions of Sofiyskiy glacier’s reconstructed mass-balance history are consistent with the findings of Reference MikhalenkoMikhalenko (1997). By analyzing meteorologically reconstructed mass-balance records of eight continental and three maritime Eurasian glaciers, he also found a pronounced decline in mean mass balance starting in 1880 (vs 1881 for the Sof profile and 1860 for the MAK profile), associated with the end of the Little Ice Age. Between 1820 and 1880, he found no significant change in mass-balance conditions, so it can be assumed that most glaciers were approaching a steady state towards 1880, which is what our simulations show for Sofiyskiy glacier.
In Figure 6, modelled and observed AD 2000 glacier stands are compared in terms of ice thickness and surface velocity at the central flowline. The mean rms error for ice thickness and velocity is 36 m and 46 m a–1, respectively. It appears that the model’s underestimation of the ice thickness in the accumulation area gives rise to smaller surface velocities than observed. Lower modelled velocities might also point to an underestimation or unsuitable parameterization of basal sliding. Another possible source of the disagreement is the lack of sufficient and reliable data on ice thickness and surface topography in the accumulation area. Nevertheless, this disagreement will probably have only a minor effect on the results of the historical front simulations, as the variations in front position are mostly governed by changes in the ablation area.
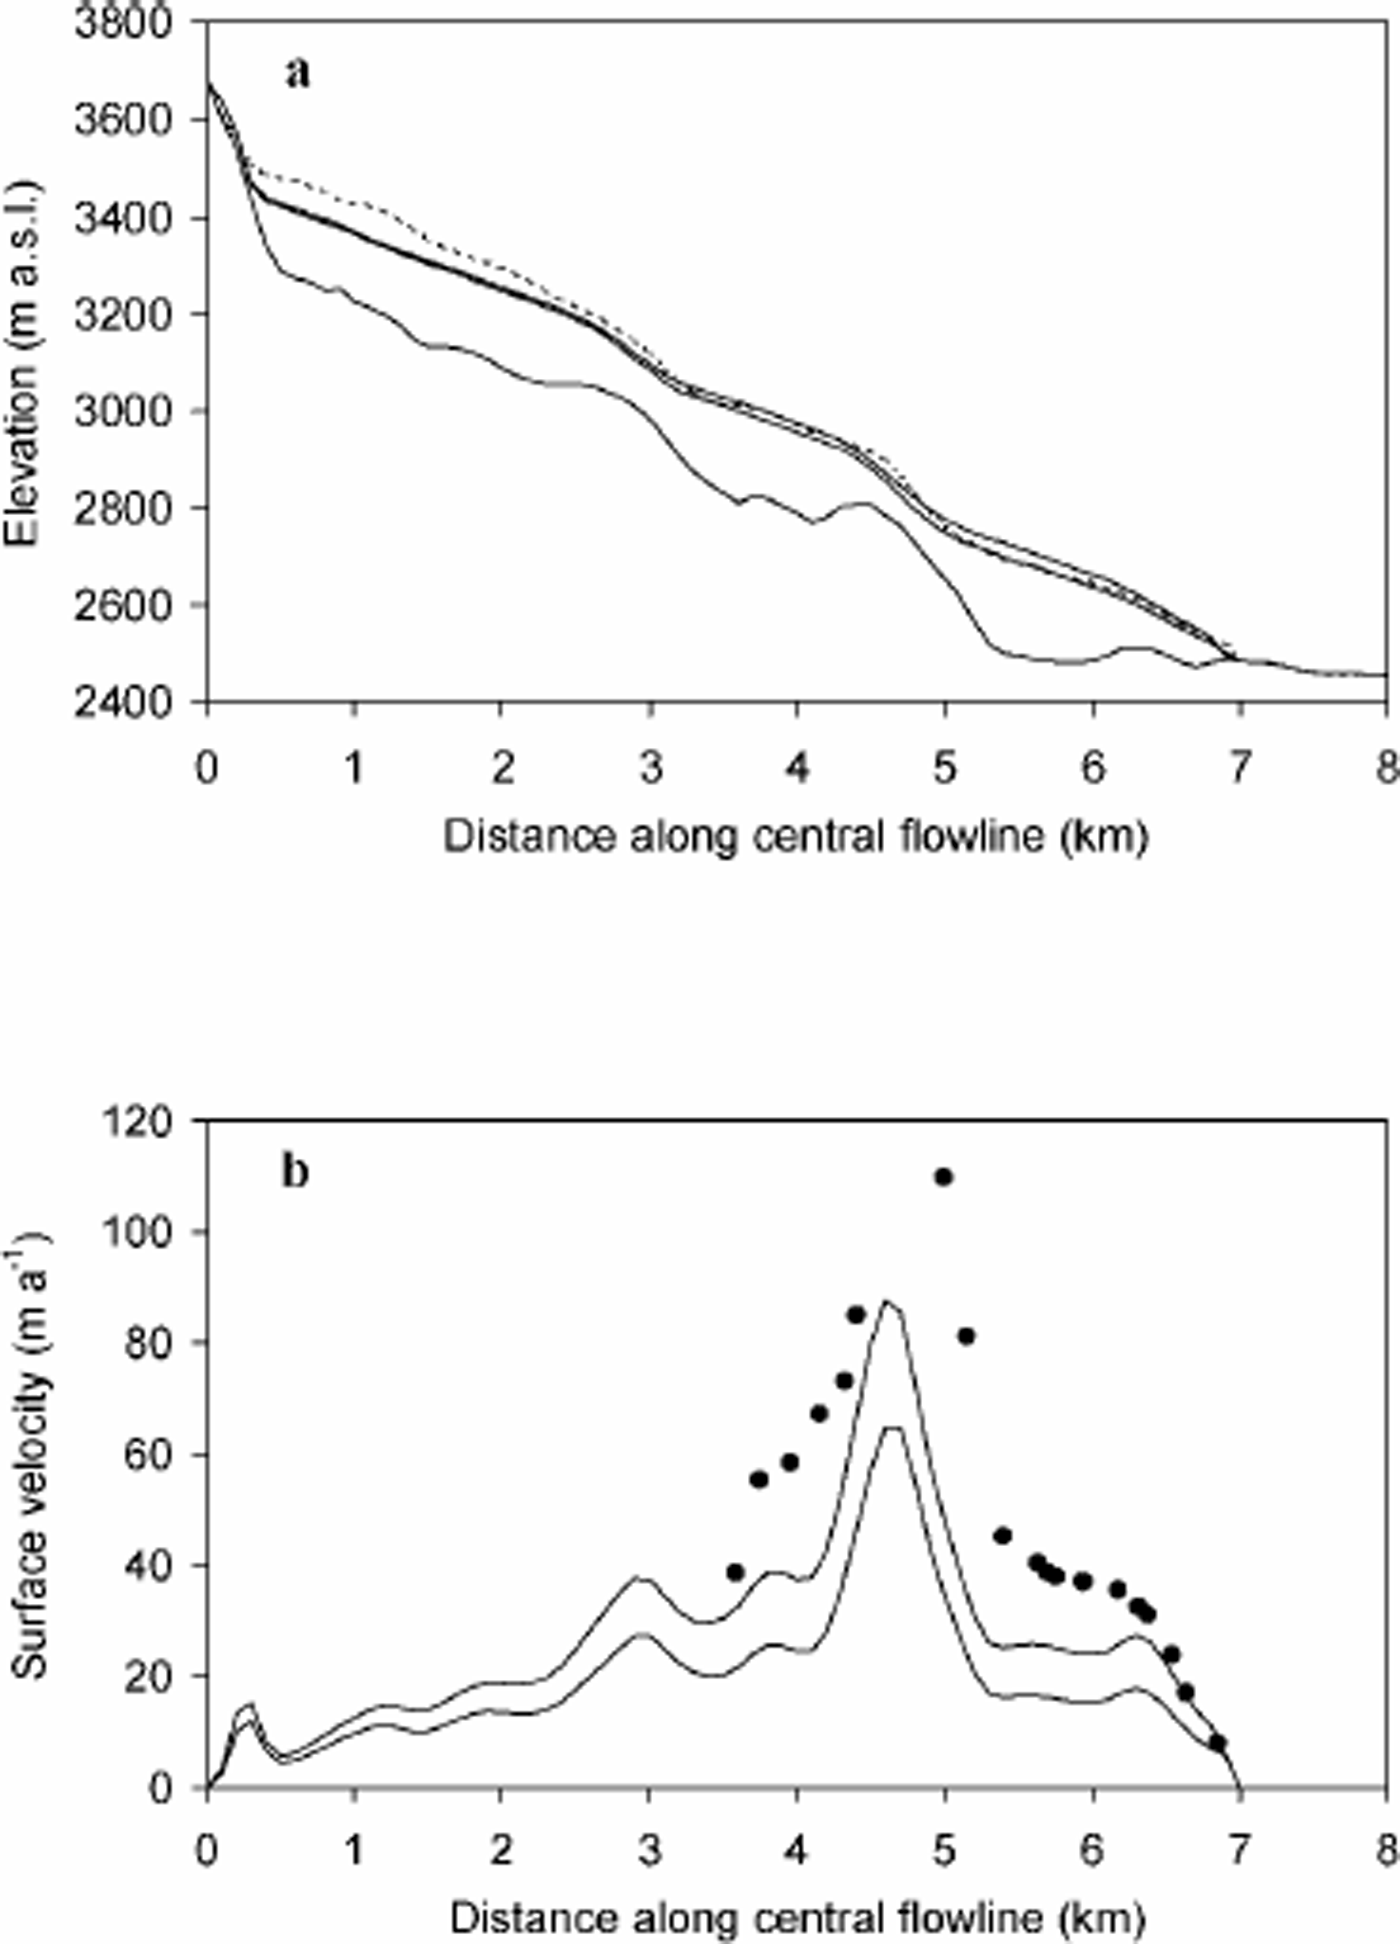
Fig. 6. Comparison between observed (dashed line/black dots) and modelled (solid lines) glacier elevation (a) and mass- surface velocities (b) for AD 2000. The upper (lower) solid line corresponds to Sof (MAK) results.
A comparison between the 1952–2000 observed and modelled evolution of the glacier front is given in Figure 7. The shape of the volume-loss curve along the central flow-line is similar for both, positioning the maximum volume loss at 7.0 km. Moreover, the total modelled volume loss between km 6.5 and 7.6 deviates 518% from the observed volume loss, which confirms the reliability of the simulation.
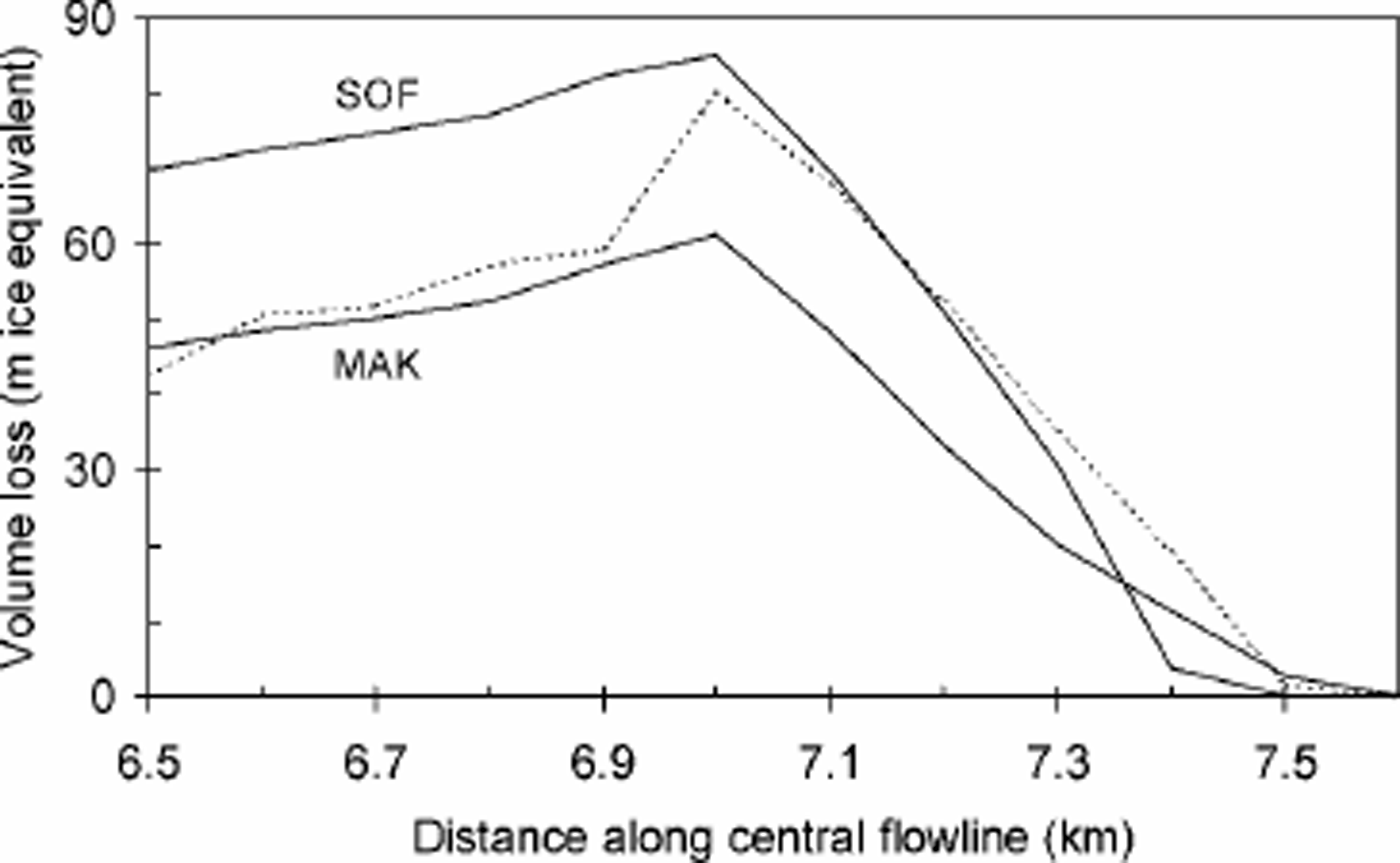
Fig. 7. Comparison between observed (dashed line) modelled (solid lines) volume loss in the glacier front zone, 1952–2000. Results are shown for forcings with the Sof and MAK profiles.
Climate Sensitivity
The climate sensitivity of a glacier is usually expressed in a dependency of the glacier’s surface mass balance upon climate conditions such as annual air temperature and precipitation. Unfortunately, only one set of local meteorological data is available, i.e. the 1972–94 record of monthly air temperature and precipitation for Aktru station, located at the foot of Maliy Aktru glacier (2150 ma.s.l.) (personal communication from Yu. K. Narozhniy, 1999). We found a reasonable agreement between Aktru summer air temperature and Maliy Aktru glacier’s mean annual surface mass-balance variation relative to the MAK profile (R = –0.61; Fig. 8). The two curves in Figure 8 complement each other, with mass-balance highs almost always coinciding with summer temperature lows and vice versa. However, a clear link with annual temperature (R = –0.16), annual precipitation (R = 0.48) or summer precipitation (R = 0.27) is lacking.
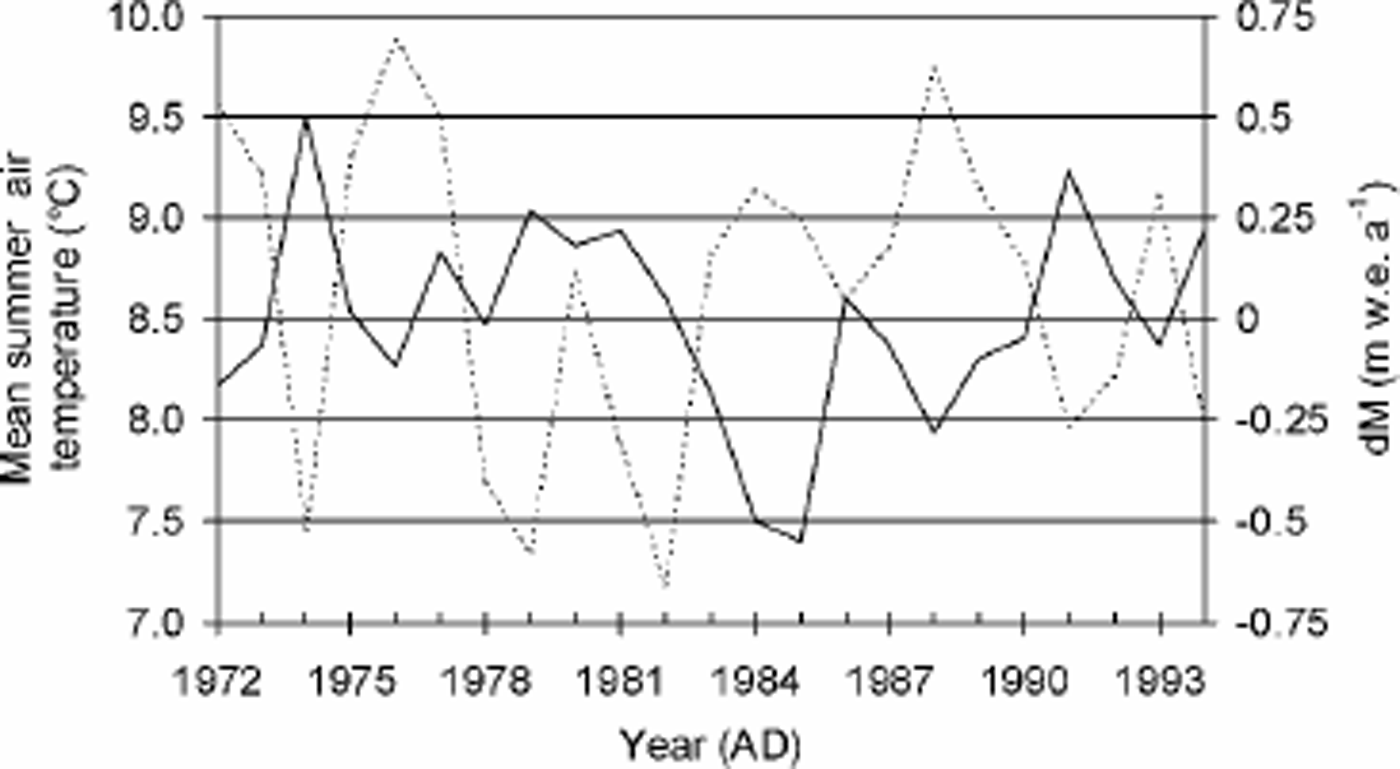
Fig. 8. Mean summer air temperature at Aktru station (solid and line) and average annual mass-balance variation relative to the reference profile for Maliy Aktru glacier (dashed line) for the 1972–94 period.
The nearest station with long-term observations is Barnaul, with a homogenized and nearly complete monthly air-temperature record extending from 1851 until 1991 (Reference Peterson and VosePeterson and Vose, 1997) and a monthly precipitation record from 1838 until 1989 with a few gaps (Reference VoseVose and others, 1992). This station, however, is positioned in the foothills of the Altai mountains at only 180 m a.s.l., and 450 km to the northwest of Sofiyskiy glacier (Fig. 1). Despite the large distance and the difference in altitude between the two locations, the reconstructed Sof and MAK surface mass-balance declines at the end of the 20th century match the sharp Barnaul summer air-temperature increase and (summer) precipitation low (Fig. 9).
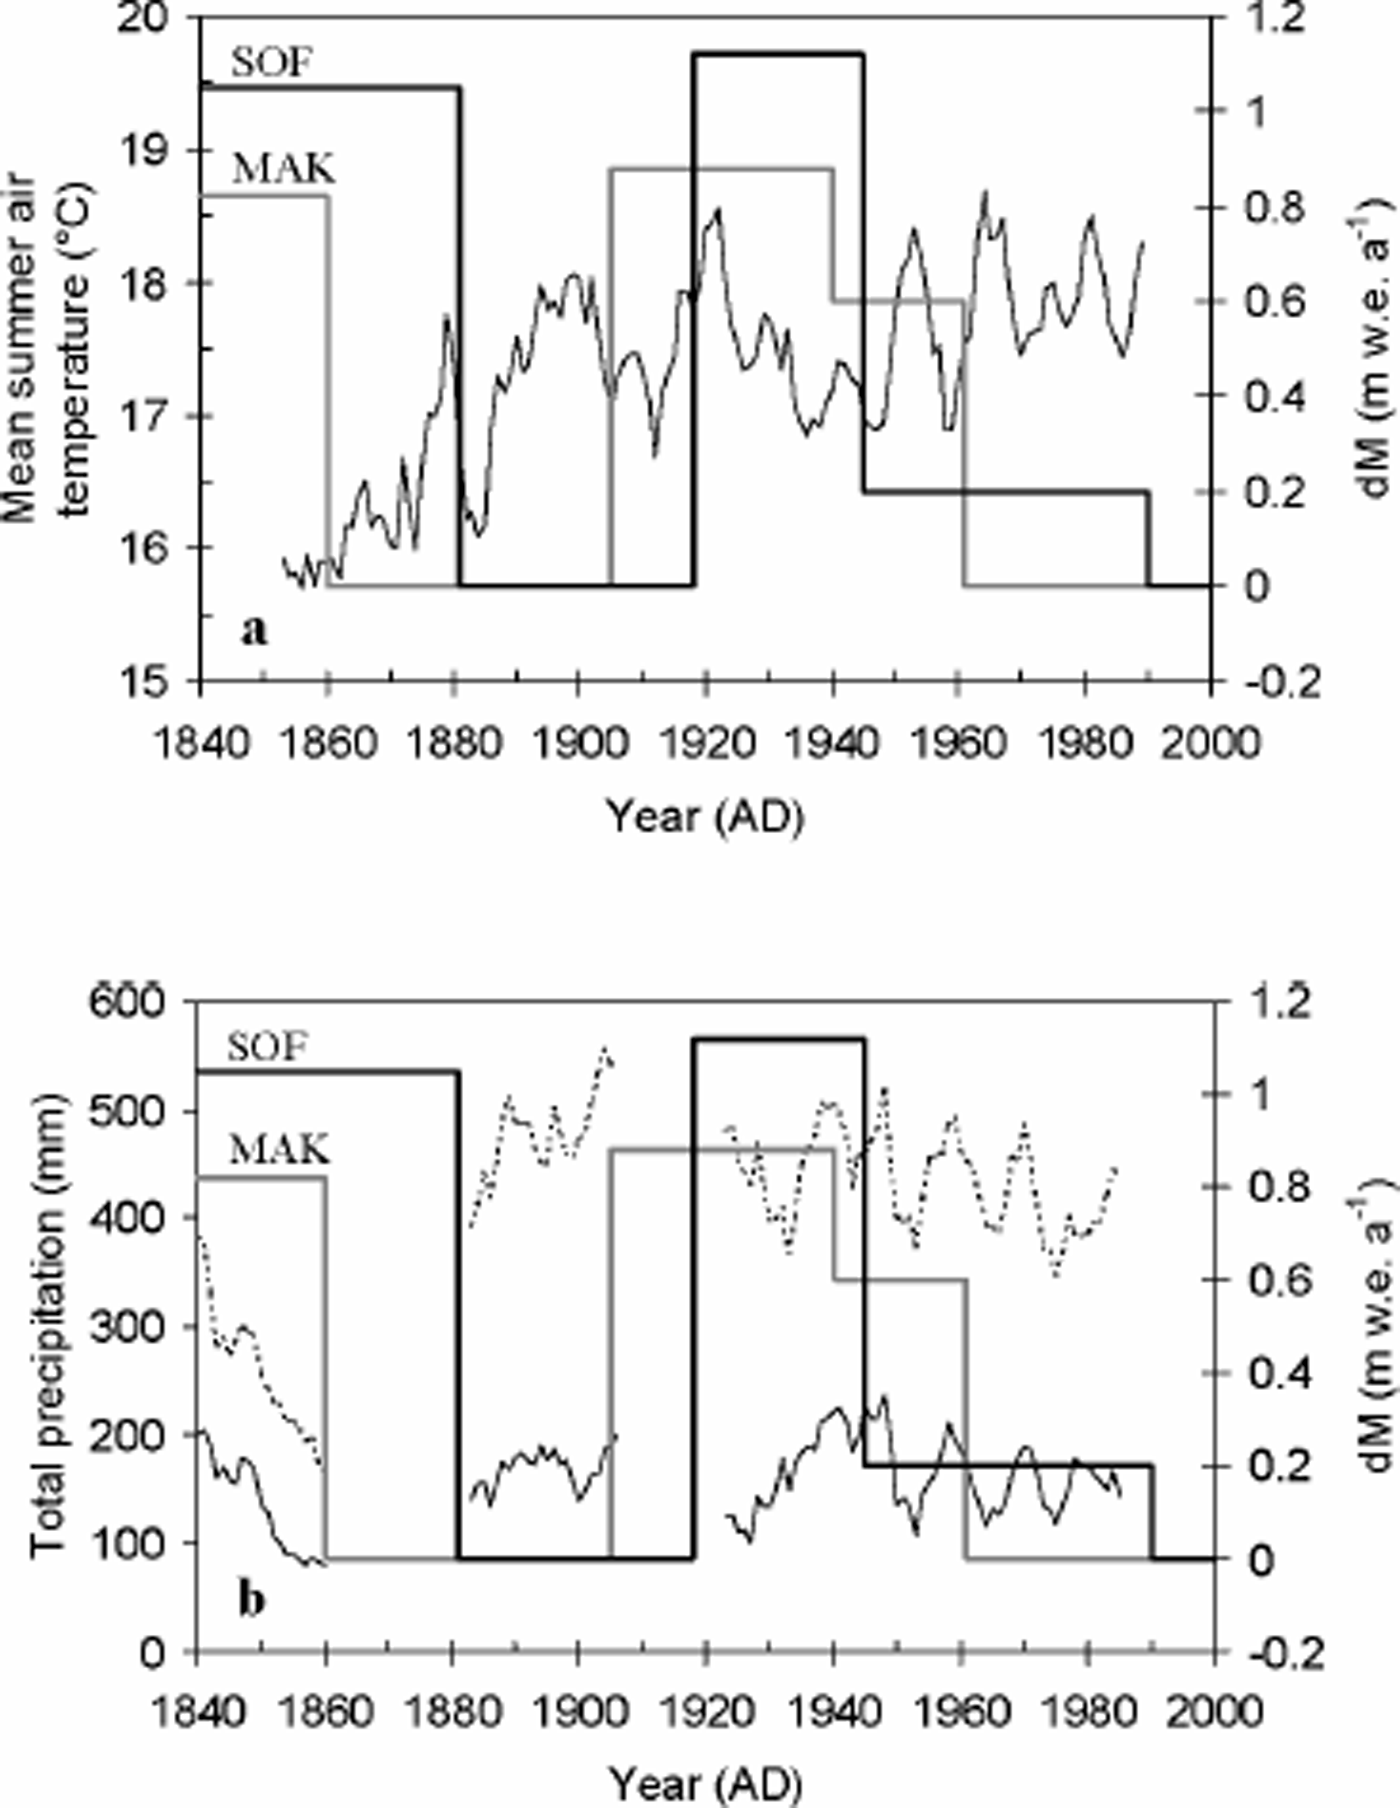
Fig. 9. Comparison between the 5 year running means of Barnaul summer air-temperature (a) and precipitation (b) record and the reconstructed Sof (thick black line) and MAK (thick grey line) mass-balance histories. For the latter, annual mass-balance variations between 1962 and 1999 are shown and are replaced by their mean value of 0 m w.e.a–1.The dashed line represents annual precipitation.
Compared to summer air-temperature series, long-term winter temperature series of Barnaul and other central Asian stations are usually characterized by a much higher variability, which strongly biases the annual temperature record. It is therefore difficult to relate mass-balance variations to annual temperature or precipitation. However, the foregoing analysis suggests that the most important climatic factor driving central Asian glacier behaviour is summer air temperature. This has also been stressed by Reference Fujita and AgetaFujita and Ageta (2000) and Reference N., Ageta, Nakawo, Waddington, Raymond and ConwayNaito and others (2001). Therefore, we have chosen to investigate the future behaviour of Sofiyskiy glacier in relation to summer temperature changes. For this purpose, a static mass-balance sensitivity dM/dTsum was derived from Figure 8 by a simple linear regression. This leads to a mass-balance sensitivity of 0.488 mw.e. a–1K–1. For comparison, a summer temperature sensitivity range of 0.75–1.0mw.e. a–1 K–1 can be derived for the Himalayan Glacier AX010 from results obtained by Reference Kayastha, Ohata and AgetaKayastha and others (1999).
Although our efforts did not allow for the determination of a conventional static sensitivity to annual air temperature, we can draw one important conclusion from a comparison with the sensitivity values for 12 other (mainly European and winter-accumulation-type) glaciers and small ice caps (Reference OerlemansOerlemans and others, 1998): Sofiyskiy glacier’s mass balance appears to be less sensitive to temperature variations than that of almost any other glacier in the sample.
Future Behaviour
The above-mentioned dynamic calibration yields a good approximation for the current state of balance of Sofiyskiy glacier with respect to climate forcing. It thus allows for a reliable projection of the future behaviour of the glacier under different global-warming scenarios. Starting from the modelled AD 2000 state and surface mass-balance conditions of dM = 0, we projected the effects on glacier volume and front position of surface mass-balance declines of dM = 0, 0.4, 0.8, 1.2, 1.6 and 2.0 mw.e. a–1 towards AD 2100 (linear decrease). Even for the “no-change” scenario (dM = 0), the projected retreat and volume loss is dramatic (Fig.10).
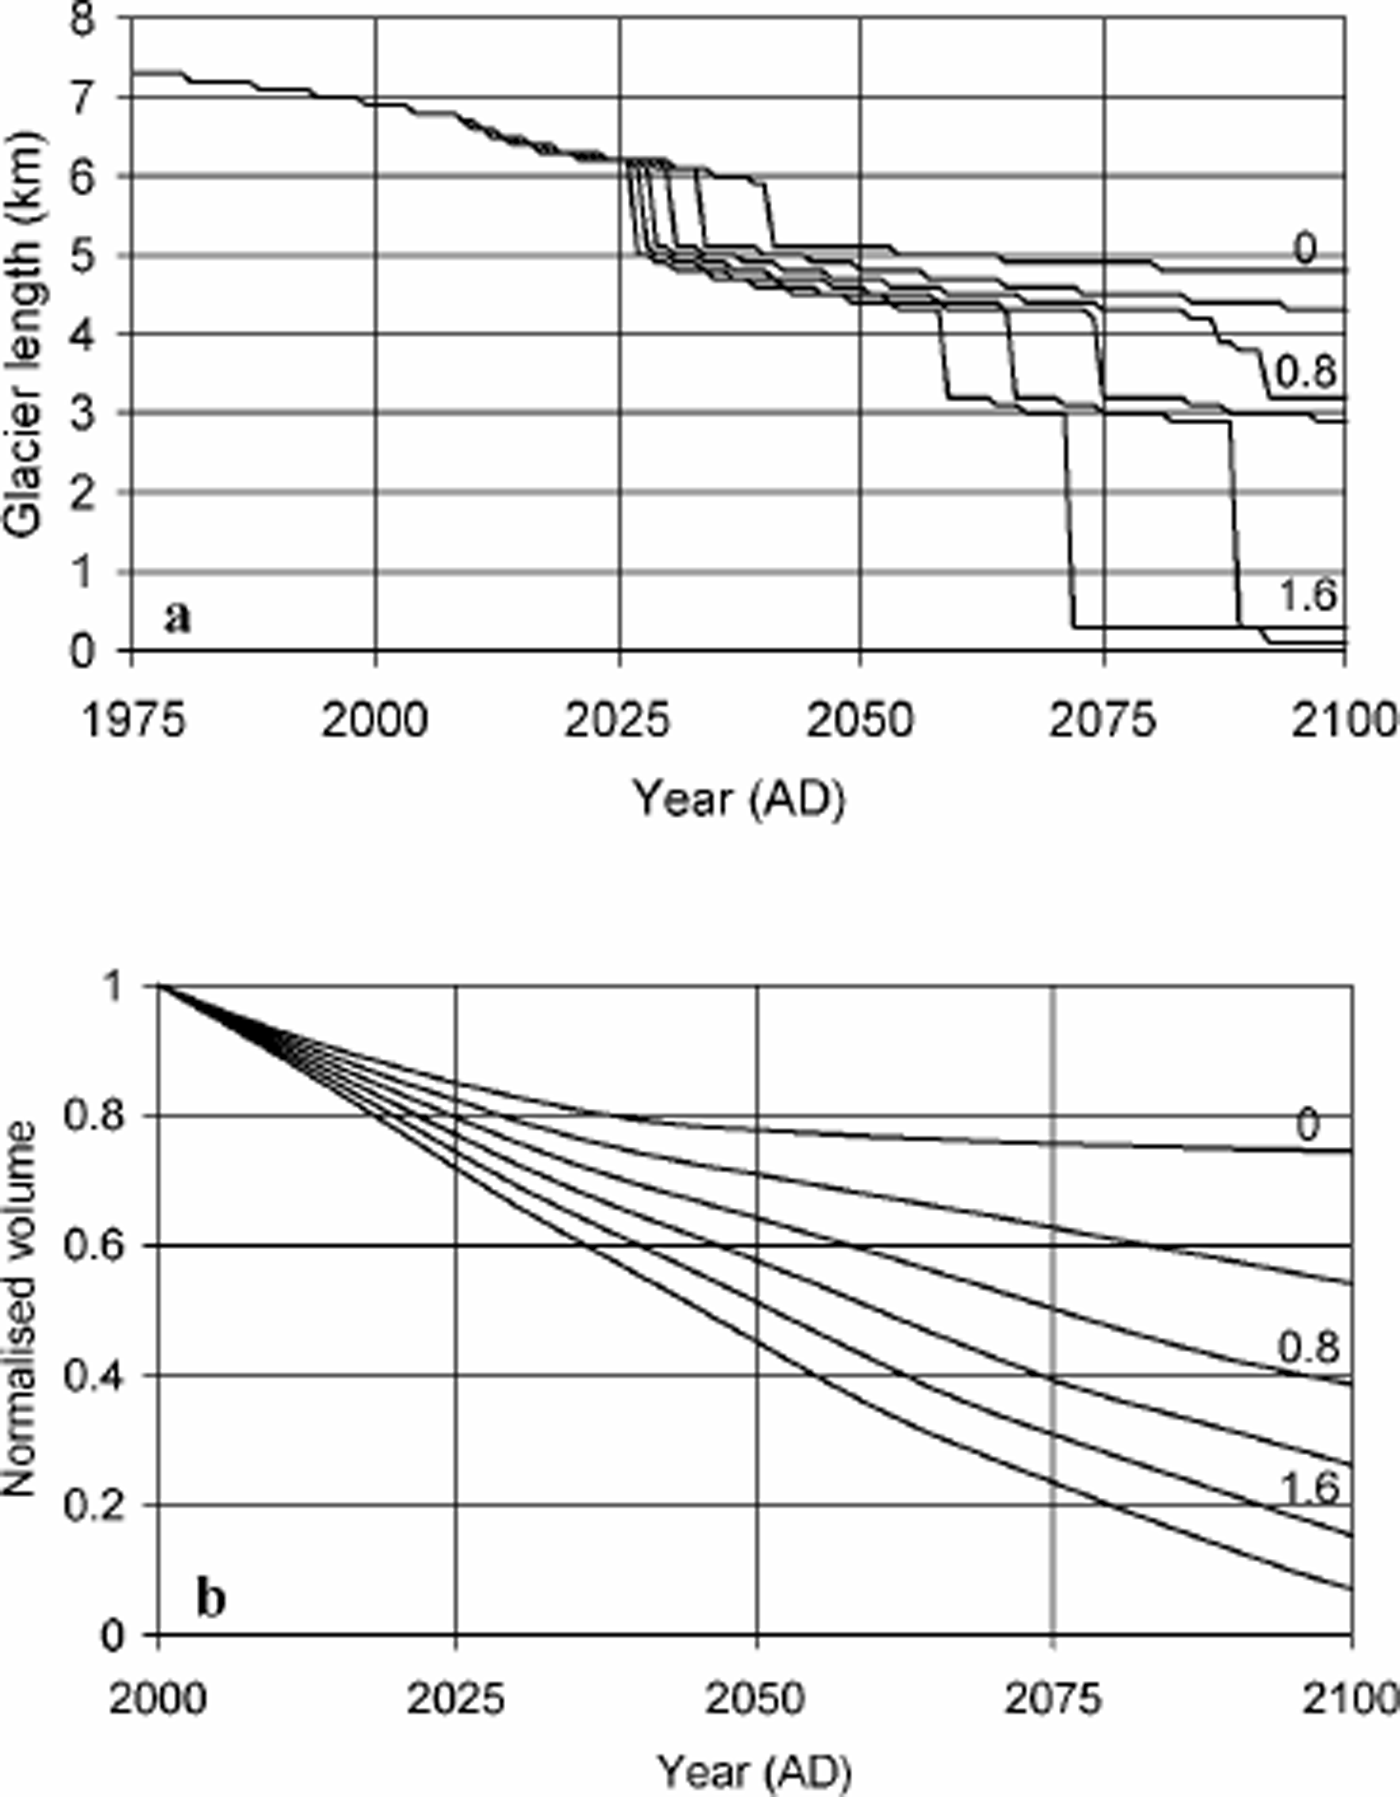
Fig. 10. Projected retreat (a) and volume loss (b) of Sofiyskiy glacier under six future climate scenarios (see text) for Sof. Labels indicate the magnitude of the corresponding total mass-balance drop. Volume is normalized with the 2000 volume. With MAK forcing, retreat and volume loss are slightly larger.
By relating the imposed future mass-balance scenarios via the derived static sensitivity to temperature changes, it was possible to assess the dynamic sensitivity DT of Sofiyskiy glacier for both mass-balance reference profiles (Table 3). This dynamic sensitivity, introduced by Johannesson (1997), is a measure of the time-dependent response of a glacier to climatic forcing. Contrary to its static variant, the dynamic sensitivity takes into account the effect of changing glacier geometry. It is calculated by comparing the volume for two different glacier
Table 3. Dynamic sensitivities under five future climate scenarios for the 2000–50 and 2000–2100 periods (see text)
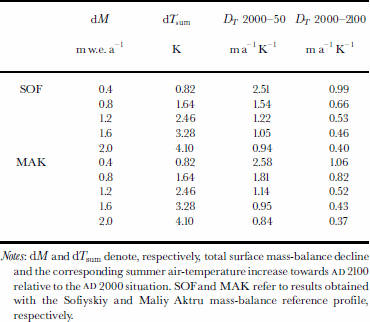
Notes: dM and dTsum denote, respectively, total surface mass-balance decline and the corresponding summer air-temperature increase towards AD 2100 relative to the AD 2000situation. Sofand MAK refer to results obtained with the Sofiyskiy and Maliy Aktru mass-balance reference profile, respectively.
Here, T is the mean warming rate over (t - t0), the time period considered. V and A are glacier volume and area. It appears that a higher warming rate results in a lower dynamic sensitivity. This is due to both low static sensitivity and the slower reaction of ice bodies when their surface area diminishes. The latter also gives rise to lower sensitivity values for the 2000–2100 period. For the 2000–50 period, dynamic sensitivity is distinctly higher than static sensitivity. This is because of the flat glacier bed and because Sofiyskiy glacier is far from a balance state in AD 2000. From Figure 10 and Table 3 it is clear that, if summer air temperature rises by > 5 ° C during this century, Sofiyskiy glacier will vanish completely around AD 2100. Even if present climate conditions prevail until AD 2100, the glacier will lose > 25 % of its present volume.
A comparison with model results obtained by Reference OerlemansOerlemans and others (1998) for 12 Alpine glaciers under a 0.02 K a–1 warming scenario shows that Sofiyskiy glacier loses its mass faster than the scaled average of the Reference OerlemansOerlemans sample. Oerlemans and others (1998) also calculated dynamic sensitivities for the 1990–2050 and the 1990–2100 periods for the 0.02 K a–1 warming scenario. Interpolating between the Sofiyskiy glacier results, the corresponding Sofiyskiy glacier dynamic sensitivity exceeds nearly all values in the Oerlemans sample, especially for the 2000–50 period.
Conclusions
For the first time, an ice-flow model is used to simulate the front variations of a summer-accumulation-type glacier, Sofiyskiy glacier. The observed historical front variations were successfully simulated by dynamic calibration. This resulted in the reconstruction of the recent mass-balance history of the glacier, marked by a distinct decline in surface mass balance in the second half of the 19th century, which initiated the continuous AD 1898–2000 retreat. At the beginning of the 20th century we found an equally large mass-balance increase, followed by a steady decline towards present conditions. This evolution is matched by results obtained from Reference MikhalenkoMikhalenko (1997) and the Barnaul long-term (summer) precipitation and air-temperature record.
Contrary to winter-accumulation-type glaciers, the behaviour of Sofiyskiy glacier is primarily determined by variability in summer conditions. We find that Sofiyskiy glacier responds relatively slowly to climate change, partly because of its low mass turnover due to the region’s continentality Nevertheless, future projections suggest that, during the next century, Sofiyskiy glacier will shrink faster than most other glaciers. If present climate conditions continue, we expect a volume loss of 25% and a retreat of 4 2 km by AD 2100. If summer air temperature rises by > 5°C during this century, Sofiyskiy glacier will vanish completely around AD 2100.
Acknowledgements
This paper forms a contribution to the research project “Glacier Fluctuations and Climatic Change in South Siberia” (Federal Office for Scientific, Technical and Cultural Affairs), contract IN/RU/006 (1998–2000), and the research project “Climatic Change in the Altai Mountains” (Scientific Research Fund, Belgium (FWO)), contract G.0120.97 (1998– 2000). The authors are indebted to A. Mistrukov, A. Agatova and I. Novikov from the United Institute of Geology, Geophysics and Mineralogy, Siberian Branch of the Russian Academy of Sciences, Novosibirsk, Russia, as well as W. van Huele for support with the fieldwork on which this paper is based. We also wish to thank C. S. Hvidberg and two anonymous reviewers for several useful comments and suggestions.


