


Introduction
An accurate base map is the foundation upon which geoscience and geophysical studies are based. A photomosaic map of the Antarctic continent from satellite imagery is the objective of a joint project between the National Oceanic and Atmospheric Administration (NOAA) and the United States Geological Survey (USGS). The resulting mosaic will be a state-of-the-art representation of the entire continent at a particular point in time, including many interior areas not before imaged.
1. Satellite and Sensor
The NOAA-6 satellite is in a near-polar (inclination of roughly 99°), sun-synchronous orbit. Equatorial crossings take place at 0730 and 1930 h local time. The 102 min period provides 14.2 orbits d−1 at an average altitude of 833 km. The advanced very high resolution radiometer (AVHRR) is the NOAA-6 sensor used for the Antarctic mosaic project. The AVHRR provides data in four spectral channels (1.1 km resolution at subpoint) using real-time high resolution picture transmission (HRPT) or onboard recording (local area coverage: LAC). Imagery for the mosaic will be selected from channel 2 (0.725 to 1.10 μm) data as this near-infrared band provides sharp land/water boundaries. Further information on the NOAA-6 satellite and sensors onboard is provided in a report by Reference HusseyHussey (1979).
The AVHRR achieves lateral coverage through horizon-to-horizon scanning perpendicular to the flight line. This allows for coverage over the entire Antarctic continent. Although the unrectified image appears foreshortened toward the horizons, the rectified images in the mosaic will be corrected for the errors caused by Earth curvature
2. Operational Plan
The flow chart outlining the operational plan for acquisition and processing of the satellite data is shown in Figure 1. Digital data are acquired from the HRPT station at McMurdo station or from the recorded LAC data. Images are to be processed to final rectified image format for mosaic compilation by the USGS.

Fig.1. Flow chart for acquisition and processing of satellite data.
The raw HRPT satellite data from McMurdo are recorded on high density tapes by station operators. These tapes, while providing good storage capacity for many satellite passes, are not computer compatible tapes (CCTs). The data are converted to 246 bits mm−1 (6250 bits per inch (BPI)) CCTs by Scripps Institution of Oceanography, La Jolla, California, at their remote sensing computer facility.
These data are previewed in image format via tape dump software to determine which passes are useful prior to further processing.
LAC data are scheduled by the National Earth Satellite Service (NESS) for use by the Navy/NOAA Joint Ice Center. The onboard recorder can store up to 11 min of pass data, or approximately 4 000 k of data measured along the satellite track. The imagery is examined for cloud-free scenes, and if the scene is usable, a 63 bits mm−1 (1600 bits per inch (BPI)) CCT is ordered from the Environmental Data and Information Service (EDIS).
The processing procedure is similar for both LAC and McMurdo HRPT data once the data are placed on CCTs. The data are rectified by computer software to produce a final image. The desired areas and gray shades required are selected and then entered into the rectification software via punch cards. The result of this process is the generation of a reformatted, or scratch tape. This new tape is compatible with a Digital Muirhead Display (DMD) device and computer. The DMD system converts the digital data to an analog signal which modulates a light beam used to expose a photographic negative. The resulting negative is used to produce the photographic image of the reformatted data. This procedure is used to generate each image of the raw data and mosaic.
The image rectification is based on an algorithm described by Reference Legeckis and PritchardLegeckis and Pritchard (1976). The data are collected as discrete samples by the combined effect of the scan rate of the radiometer and the forward motion of the satellite in its orbital plane. Since the scan rate is constant, equal increments of the scan angle subtend unequal distances along the Earth. In effect, the panoramic distortions appear as a contraction of the Earth's features at increasing distance from nadir.
To remove distortions due to curvature of the Earth from the imagery, the algorithm redistributes the samples along each scan line so that each new sample represents an equal distance on the image. This interpolation scheme assumes that the Earth is a sphere and that each scan line is part of a cylinder intersecting the Earth. Therefore, a correction for the curvature of the Earth can be applied independently for each scan line.
Geometric distortions in the image can also be attributed to secondary effects such as the Earth's rotation, spacecraft attitude errors, or altitude changes. Because effects due to the rotation of the Earth are minimal near the poles and because the attitude of the NOAA-6 satellite is relatively stable, the mean error attributed to the effects of secondary geometric distortion is estimated to be less than 5 km.
The USGS has the responsibility of fitting the ~35 rectified, enhanced, and enlarged images into mosaic map form once the above procedures have been finished. The mosaic will be at a scale of 1:5 000 000 with an overlay printing of a grid and selected place-names to identify and locate prominent terrain features.
3. Progress To Date
Figure 2 is an index map showing the coverage area of cloud-free satellite data thus far recorded on tape. The stippled area represents LAC data; the cross-hatched area represents HRPT data recorded at McMurdo station in January 1980. Although the taped coverage includes most of the continent, much cannot be used for the mosaic because of clouds.

Fig.2. Index map of taped cloud-free satellite data from LAC and McMurdo station HRPT sources.
The software to preview the data is complete; the software to rectify the data is in final development stages. A11 23 passes acquired at McMurdo have been previewed in unrectified image form through the tape dump process. Imagery from the EOIS has been obtained for all 19 LAC data tapes ordered. Figure 3 is an example of a partially rectified image of the Amery Ice Shelf acquired at McMurdo. Figure 4 is an excellent scene of the Ross Ice Shelf/Transantarctic Mountains from LAC data. Figure 5 is also LAC data of the Antarctic Peninsula, truly a difficult area to acquire cloud-free scenes.

Fig.3. The Amery Ice Shelf: NOAA-6 AVHRR channel 2 image acquired at McMurdo station, 19 January 1980.

Fig.4. The Ross Ice Shelf: NOAA-6 AVHRR channel 1 (0.55-0.68μm) image from LAC data, 12 November 1980.
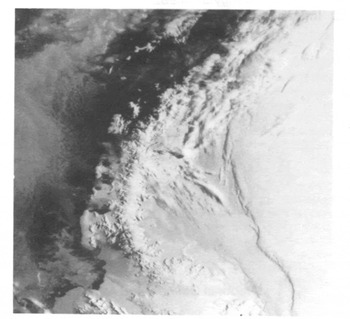
Fig.5. The Antarctic Peninsula; NOAA-6 AVHRR channel 2 image from LAC data, 25 January 1980.
Different scales are shown in scenes from LAC data in the vicinity of Ross Island. Figure 6 is an unrectified image at approximately 1:5 000 000 scale of this scene; the final mosaic will be at this scale. Figure 7 is an image at approximately 1:1 000 000 scale of the same scene. This is the most common scale at which Landsat imagery is reproduced
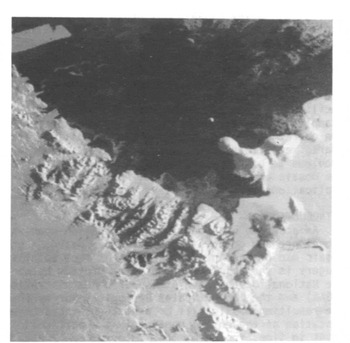
Fig.6. Ross Island and vicinity, NOAA-6 AVHRR channel 2 (25 February 1980). This LAC scene is approximately 1.5 000 000 scale, the publication scale of the Antarctic mosaic

Fig.7. Ross Island, NOAA-6 AVHRR channel 2. This LAC scene shows part of Figure 6 at approximately 1:1 000 000 scale.
4. Problems To Be Faced
One of our major obstacles has been the need for computer software to allow processing of the digital satellite data for specific applications. The software involves both the reading and the writing of data that are stored on CCTs and the image enhancement, rectification, and mapping of the data. The accuracy of the final mosaic product depends on the degree of refinement that is provided by the software. For example, the original geometric rectification used a simple approach that produced a satellite image accurate to within about 5 km. To increase the accuracy to 1 km would require a more elaborate software approach. Similarly, producing a polar-stereo-graphic mosaic would involve access to remapping software with the possible use of ground control points to increase the map accuracy.
The logistics of obtaining taped data of the Antarctic are complex. For LAC data, passes over the continent are scheduled by NESS. Owing to the great demand for this service, the mosaic scenes were obtained from those passes requested by the US Navy for ice observations. For McMurdo data, high-density tapes were purchased to use on the McMurdo station HRPT system and then reformatted at Scripps. Thus far, the US National Science Foundation has provided all funding support for tape acquisitions and travel to McMurdo for data collection.
Clouds are a persistent problem. Cloud-free data are essential to the completion of the project.
5.Applications
The mosaic will be useful to geographers, cartographers, glaciologists, geologists, and oceanographers. Although considered an uncontrolled mosaic, the configuration of the continent and delineation of the ice shelves will be superior to most maps and charts at 1:5 000 000 scale. The detail in certain remote areas will be superior to earlier maps, especially the coastal areas and those south of 81°S, which are outside the limit of Landsat coverage. The mosaic will enhance and complement the Landsat image maps of Antarctica because of the easy visual transition from image to image. There are problems in comparing conventional maps with corresponding images especially in the sometimes “featureless” areas of the Antarctic ice sheet.
Geologists will be pleased with the complete imagery of the Transantarctic Mountains and other ranges south of 81°S. The 1:5 000 000 scale should be useful for the study of plate tectonics in the Antarctic. Geographers will appreciate the complete coverage of the entire continent at a reasonable scale for showing coastlines and other features of unsurveyed areas.
Acknowledgements
The authors wish to acknowledge John Pritchard of NESS for his computer processing assistance, Jann Knapp for her preparation of illustrations, William Kosco of USGS for his support of the project, and Olivia Smith for her preparation of the manuscript.


