


Introduction
Using the real variation of the snow depth in space and time, with related variation of the snow-cover thermophysical properties, and observed meteorological characteristics during winter, should give a perfect correlation between the results of mathematical modeling of the soil-freezing process and Nature. However, the complexity of the soil-freezing phenomena necessitates various assumptions in mathematical modeling of the process. Determination of which of them leads to a noticeable difference between results of calculations and reality is important from a theoretical viewpoint and for practical applications.
Snow cover plays a major role in soil freezing, with its low heat conductivity and spatial depth variation. It is evident that snow appearance before and after the soil has started to freeze will result in different freezing depths until the end of a cold season. However, it is not clear how different they will be, especially for different properties of the snow cover.
Though probably acceptable for a large-scale consideration, the averaging of the snow-cover depth over a cold season, and the use of a constant thermal resistance instead of the snow-cover depth in the construction of analytical relationships, as well as simplified calculations of the freezing-depth value or temperature pattern in soils, cannot be correct for a site. What difference it will give in comparisons of modeled and observed results is so far unclear.
Even when standard methods are used in mathematical modeling of the freezing process, and the snow-cover depth change during winter is assumed to fit a parabolic function, the condition of regular variation forces us to accept uniformity or negligibly small changes in time of the thermophysical characteristics of snow and soil. This makes the models easier to use, but can also result in calculated values that are inaccurate.
Other common assumptions include the snow properties corresponding to the mean for the cold-season snow depth; snow-cover appearance and disappearance taking place at the times of inversion; and the snow-surface temperature having its mean seasonal value.
The purpose of the present work is to estimate the importance of the above-mentioned snow-related parameters, which are neglected or simplified in soil-freezing modeling. A model was constructed of the time-dependent, spatially varying thermophysical properties of snow cover and its influence on the soil-freezing process. The results of modeling were compared with the observed soil-freezing process, and they were found to be in good agreement. This allowed us to use the model in numerical experiments which showed how the delay between the start of soil freezing and the appearance of snow, and the thermophysical characteristics of snow cover, could influence the freezing depth.
Mathematical Model
Model description
The temperature distributions in snow cover and frozen and thawed zones of soil are described by the Fourier law of heat conduction with time-dependent thermophysical parameters of snow and dependence of the corresponding soil parameters on temperature and moisture (Equation (1)). With addition of the description of moisture transfer in the thawed zone of soil to account for moisture migration (Equation (2)),


where p is density (of skeleton in the case of soil), τ is time, c is specific heat capacity, T is temperature (K), A is the heat conductivity coefficient, × is a coordinate, w is total soil moisture and k is the mass-transfer coefficient. Instead of subscript " j " , subscript "s" will be used for snow, "f" for frozen soil (0 ≤ × ≤ Q and "th" for thawed soil (ξ ≤ × ≤ h) where ξ is the position of the interface between thawed and frozen soils ("freezing front"). The coordinate × will be used to describe position in the soil, and z (0 ≤ z ≤ hs(τ)) when snow is discussed, where h is layer thickness
The fourth-order boundary condition, equating temperature and heat fluxes, is accepted for the snow-cover-soil interface:

Tbf = 272.5°C was accepted as the temperature of water freezing in soil (Reference PavlovPavlov, 1979) for the freezing front.
Water migration leads to a change in the quantity of water freezing on the freezing front:
The Stefan condition in this case has the following form:

where L is the latent heat of melting. The specific quantity of freezing water is wf = wth(ξ,r) ― ww + Δw, where ww is the frozen-soil moisture on the freezing front and wth(ξ,τ) is the thawed-soil moisture, dependent on position and time.
The water density and volumetric soil moisture, or ground skeleton density and summarized moisture content, can be used as terms in the above equations.
After substituting wf into the Stefan condition (Equation (5)), the following relationships are valid:

or

When the left part of the last relationship is negative, i.e. with a large amount of migrating moisture, the right part also becomes negative. This should lead to the opposite movement of the freezing front: soil thawing. In reality, however, it results in water accumulation near the freezing front, with not enough speed of heat removal for it to freeze. Water migration will take place in the direction of the thawed zone in the soil. Soil thawing will take place when the left ρart of the first equation is negative.
The set of Equations (1–5) is subtended by the boundary conditions on the surface and at the bottom, by the initial temperature distribution in the thawed soil and by the history of snow accumulation.
The heat exchange on the soil surface or snow cover is described as:
where Q ∑ = Qth + Qe + Qr + Qsn is the total heat flux, with the other terms describing the heat fluxes due to convective heat exchange, evaporation, effective emission and solar radiation, respectively.The total heat-flux description can be simplified by approximation of the water-vapor pressure dependence on temperature as piecewise-hnear:
where α∊ and T∊ a are the effective values of the heat-exchange coefficient and air temperature, respectively, and Tm 0 is the temperature of a snow or a frozen-soil surface.
To represent actual conditions, different limits for temperature and heat fluxes can be set for the lower boundary of the thawed zone, such as absence of the heat flux:

The temperature at the freezing front is:
The modeled temperature distribution in soil to the moment when freezingstarts was accepted to be:
where Tma× is the maximum temperature in soil to the moment when freezing starts.
The water migration in soil leads to corresponding variations of the ground thermophysical properties. The effective volumetric heat capacity of the frozen soil, including the phase transition, was assumed to depend on the total moisture content in the following way:
The moisture distribution in the thawed zone requires the boundary condition for the freezing front on the thawed-zone side. It was usually accepted to be in the form:
where wlim is the critical moisture content, below which almost no moisture transfer can take place. The value of wlim is usually treated as a constant in such calculations. However, this boundary condition cannot be achieved rapidly, but only when the freezing front is stagnant for some period of time or moves very slowly. Moreover, introduction of this condition with wlim = const, with real values of mass-transfer coefficients destroys the modeled mass balance of water in the frozen and thawed layers. At the start of soil freezing, when the air temperature varies around 0°C the freezing-front movement is small and the condition described by Equation (6) can be achieved. With further front movement, however, it cannot be correct. That is why in the present model the moisture content of the neighboring net point, to which the freezing front will move during the next time-step (if the outgoing heat is sufficient for freezing of the incoming water and of the present water except ww), was used as the value of the moisture content on the thawed-zone boundary wth(ξ). This value approaches wlim, faster or slower according to the speed at which the freezing front moves. The wth(ξ) was determined from the condition of water-flux conservation:
The result is:

where kw12 = kw1/kw2, kw1=kw{wth(x)+wlim/2} is the moisture content of the neighboring net point, Ah is the step in the space variable, and the values of w2 and wth(0 in k12 calculations are taken from the previous time-step.
A similar approach was used to determine the temperature on the snow (soil) surface by equating the heat fluxes on it, and by assigning values of the effective air and the underlying snow (soil) layer temperatures.The water quantity on the freezing front from the thawed-zone side is to be wth, wth(x) When this value becomes more than the overall water capacity (ω>max), an ice layer (subscript ˚1" indicates ice) is formed, with the thickness:

Even if the freezing front is not moving, the ice-layer thickness is growing because of water migration. However, when the heat output from the front is insufficient and not all the incoming water is freezing, a negative moisture gradient can be formed and water movement into the thawed zone can start.
The water flux from the thawed zone at x=z is kth(w)/th where wth/x is the moisture gradient from the side of the thawed zone. The kth/w value is changed on this position. That is why the water quantity lost from the thawed zone and calculated from the water-flux value can be several times different from the water-content change of the thawed zone during the same time-step. For that reason, the water flux from the thawed zone was also calculated from the water-content change there.
The above set of equations was solved by the finite-difference method using the implicit difference scheme for non-linear problems of the heat and moisture transfer with varying coefficients. The snow-depth change, snow density and heat conductivity, thermophysical characteristics of the thawed and frozen soil, as well as terms of the surrounding heat balance, were calculated for each time-step in the model. When the results of the next calculation step exceeded the previous results by >10–25% (depending on accuracy), another fixed time-step was used to calculate the intermediate positions of the freezing front between the corresponding net points, and further movement of the freezing front was determined from the intermediate values. Calculations showed that the set of conditions could lead to opposite movement of the freezing front accompanied by thawing up to the soil surface. The possibility of partial snow-cover melting near the soil surface and of a frozen-layer thickness up to the annual temperature-variation depth were included in the model and computer program.
Numerical input
To obtain values of the freezing depth, the initial data were treated as follows:
The heat flux on the ˚bottom" of the soil was equated to 0. The initial temperature distribution was described by a parabola with a maximum temperature of 4°c at 1.5 m depth and of 0°G on the soil surface and at 3 m depth.
The air temperature (Ta) varied sinusoidally with the minimum value Tmin = –30°C and 0°G at the moment of freezing and at the 180th day, respectively:

The temperature of falling snow was assumed to be equal to that of air. Wind speed was taken as 5 ms–1, humidity as 70% and cloudiness as 0.65.Snow coverThe snow-density (kg m–3) dependence on the snow-cover depth (10–2 m) was described by a power function:
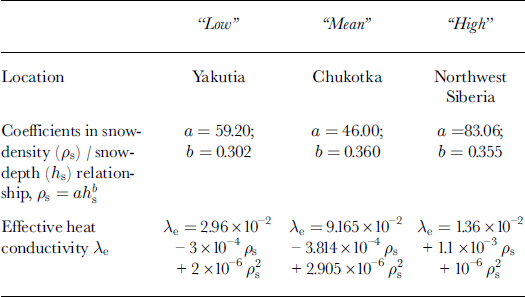
The coefficients were obtained statistically from the field-observation data from various regions of Russia. In actual calculations three relationships were used: ˚high-density snow", corresponding to conditions in northwest Siberia; ˚low-density snow", corresponding to conditions in Yakutia, east-central Siberia; and ˚mean snow density" which can be found in chukotka, northeast Siberia (Table 1).
Table 1. Snow-cover characteristics
Variations of the observed values of the effective heat conductivity of snow forced us to use several empirical relationships in the model for this characteristic’s dependence on density. After analysis of more than 20 published sets of experimental data (Reference Osokin, Samoylov, Sosnovskiy, Sokratov and ZhidkovOsokin and others, 1999), the resulting equation describing the average for corresponding density (with 10 kgnT3 step) relationships ("mean") was:
The range of observed values was between the ˚high",
and the ˚low" functions:
The ˚high", ˚low" and ˚mean" values in the calculations corresponded to the maximum, minimum and mean values of the snow density and effective heat conductivity coefficient according to the above equations (Table 1).
Soil
The characteristics of foam with a density of 1600 kg m–3, an initial moisture content of 25% and an overall water capacity of 35%, corresponding to the soil used in field observations, were used in the calculations. Similarly, the relationships describing the thermophysical characteristics of soil were based on results of laboratory work and published data.
The frozen-soil moisture content at the freezing front ww was taken from experimentally obtained relationships, approximated for loam as:
with m = 9.8325 and n =-0.3221.The mass-transfer coefficient dependence on volumetric moisture content wv was also obtained by approximation of experimental data, and for thawed loam was:
Using wv = wpth/ρw, where ρw is the water density, the relationship k = K(w) was obtained.
The heat conductivity coefficient (W m–K–1) of frozen loam was described by
and the heatconductivity coefficient for thawed loam was
The volumetric heat capacity (kJ m–3 K–1) of frozen loam corresponded to:
and the volumetric heat capacity of thawed loam corresponded to:
The model test
The developed model was tested on the results of field experiments in Igarka, northern Siberia (Reference PavlovPavlov, 1979). The time dependence of the air temperature, solar radiation, snowcover depth, snow density and moisture content of soil was approximated by polynomials with relatively high accuracy (Reference Osokin, Samoylov, Sosnovskiy, Sokratov and ZhidkovOsokin and others, 1999). The results of calculations, when differences in physico-mechanical and thermophysical characteristics of different soil layers at the observation site were taken into account, were in good agreement with the real process of soil freezing (Fig. 1), and validate the constructions used in the model.
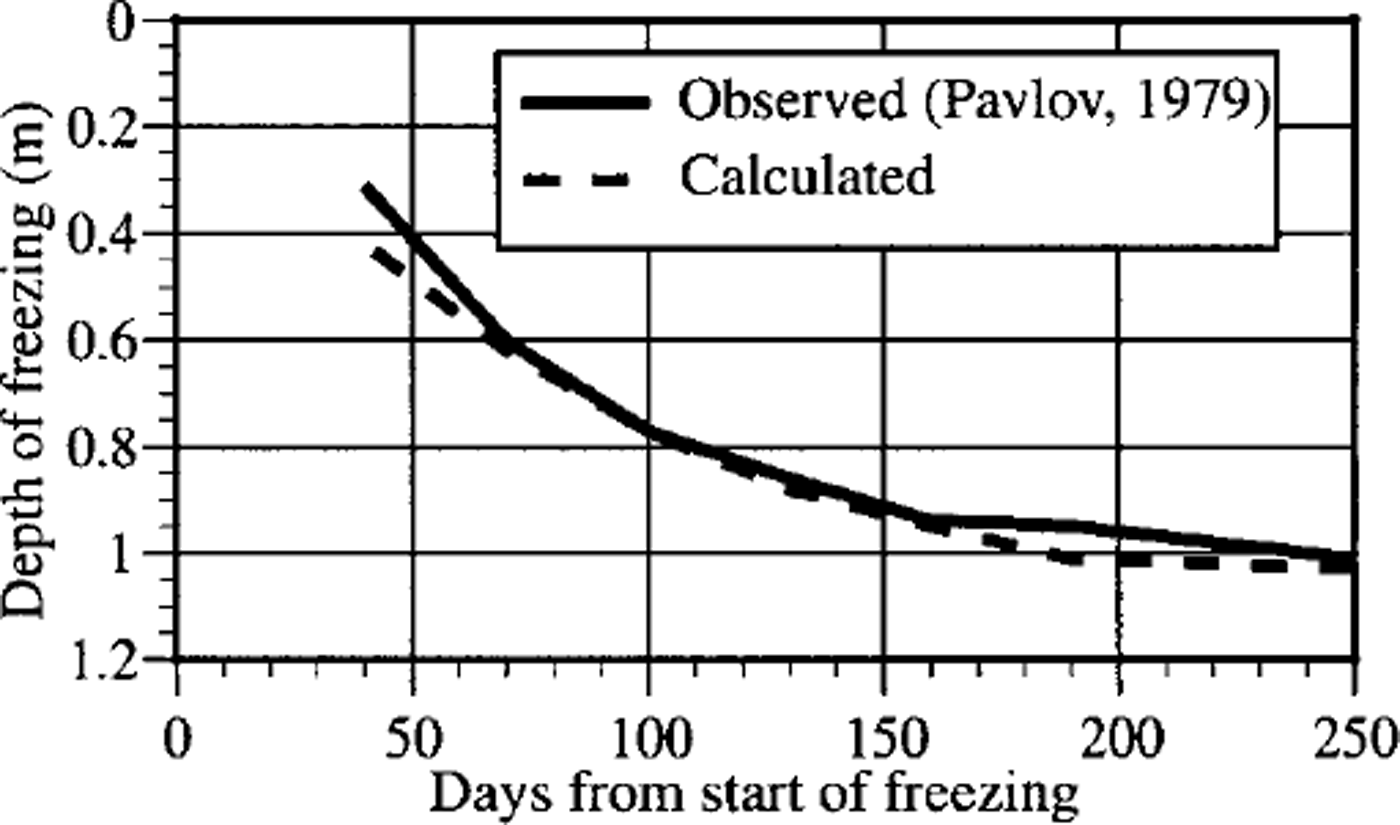
Fig. 1. Comparison of the observed and calculated positions of the freezing front.
Analysis of Results of Numerical Experiments
The calculated soil-freezing depth in relation to the delay between snow appearance and soil freeze-up for ˚mean" snow-cover characteristics is shown in Figure 2, together with data for snow ˚absence". It can be seen that the delay (0, 8 and 15 days) had significant influence on the freezing depth. On the 120th day, the modeled depth was 0.86, 1.15 and 1.33 m, respectively (2.3 m without snow cover), giving a 50% difference between no delay and a 15 day delay. The influence was even more (4.5 times) for ˚low" snow-cover characteristics, when the modeled depth was 0.16, 0.45 and 0.73 m, respectively.
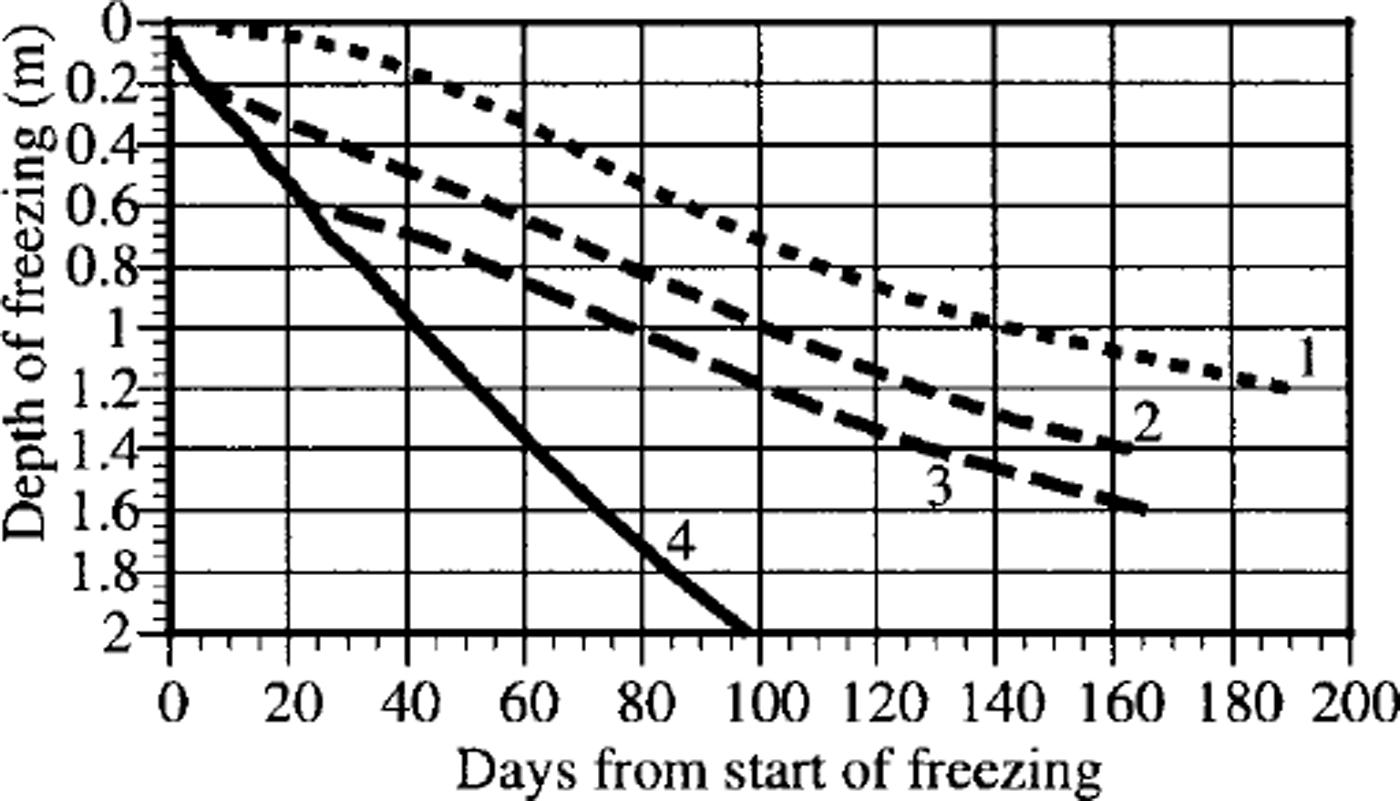
Fig. 2. The influence of delay between start of soil freezing and snow-cover appearance (1,2 and 3 represent no delay, 8 day delay and 15 day delay, respectively) on depth of freezing for ˚mean" snow characteristics (IS) and conditions without snow (4).
The results of numerical experiments on freezing depth determined for the ˚high", ˚mean" and ˚low" snow-cover characteristics, with the same snow-accumulation intensity and an 8 day delay, are shown in Figure 3. On the 150th day the freezing depth, considered without water migration to the freezing front, is 2.07 for the ˚high" (curve 4) and only 0.53 for the ˚low" (curve 2) values of ρsh and λsb.
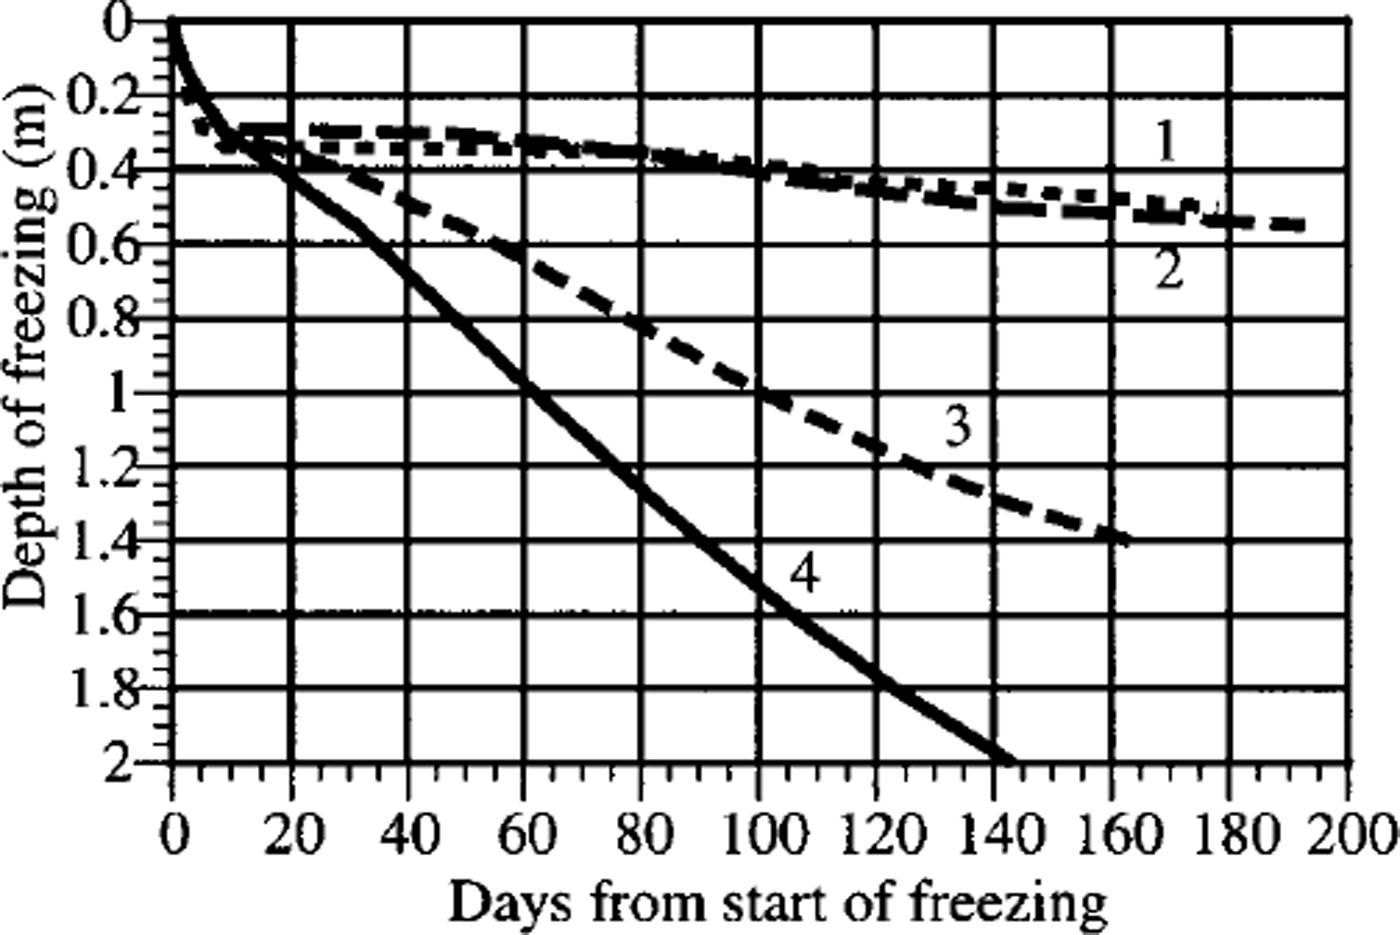
Fig. 3. The influence of the ˚low" (1,2), ˚mean" (3) and ˚high" (4) snow characteristics on the soilfreezing, considering (1) and not considering (2–4) the moisture migration.
The modeled air-temperature influence on soil freezing is presented in Figure 4. The minimum air-temperature decrease from –20° to –40°C leads to a 1.7 times freezing-depth increase on the 120th day for the ˚low" snow-cover characteristics (0.33 and 0.56 m for –20° and –40°C, respectively), and a 1.4 times freezing-depth increase for the ˚high-values (1.43 and 2.0 m). Using different thermophysical characteristics changes the modeled depth 3–4 times.

Fig. 4. The influence of a minimum air temperature of-20°C (1 3,5) and-4(0˚C (2,4,6) on soilfreezing, with ˚low" (1, 2), ˚mean" (3, 4) and ˚high" (5, 6) snow characteristics without considering the moisture migration.
The model allowed us to determine the influence of rapid, sustained warming on the character of soil freezing. When the temperature on the 50th day was suddenly changed from –23° to –3°C, kept at this value for 30 days and then reduced again to –29.5°C for an 8 day period of delay between snow-cover appearance and the start of freezing, the modeled freezing depth decreased 12% for the ˚mean" snow-cover characteristics and 28% for the ˚low-ones. In the last case the freezing front almost stopped at 0.3 m depth.
The sudden increase in snow-cover depth (on the 50th day, from 0.34 to 0.45 m, which corresponds to the 80th-day condition for ˚normal" snow accumulation) gives a similar result to the ˚low" snow-cover characteristics.
According to modeling results, the influence of water migration on the speed of freezing for the ˚high" and ˚mean" snow-cover characteristics was rather small. For the ˚low-snow characteristics and a delay between the start of soil freezing and snow-cover appearance, not including the water migration in the calculations, the freezing depth on the 100th, 140th and 180th days is overestimated by 19%, 25% and 27%, respectively. With the delay equated to 0, the freezing depth for the same days increases 200%, 80% and 65%, respectively.
The model also showed a possible influence of the snow-cover characteristics on the dynamics of soil moisture and the position and thickness of ice layers. The moisture distributions with depth in frozen- and thawed-soil zones for different snow parameters are shown in Figure 5. For an 8 day delay the total ice generation was 0.9 × lO"3 m, with a total freezing depth of 1.45 m (0.8 and 0.1 × lO"3 m thick ice layers at depths of 0.36 and 0.37 m, respectively). With no delay the ice generation was calculated to be 9.6 × 10⁻³ m, with a freezing depth of 1.16 m.
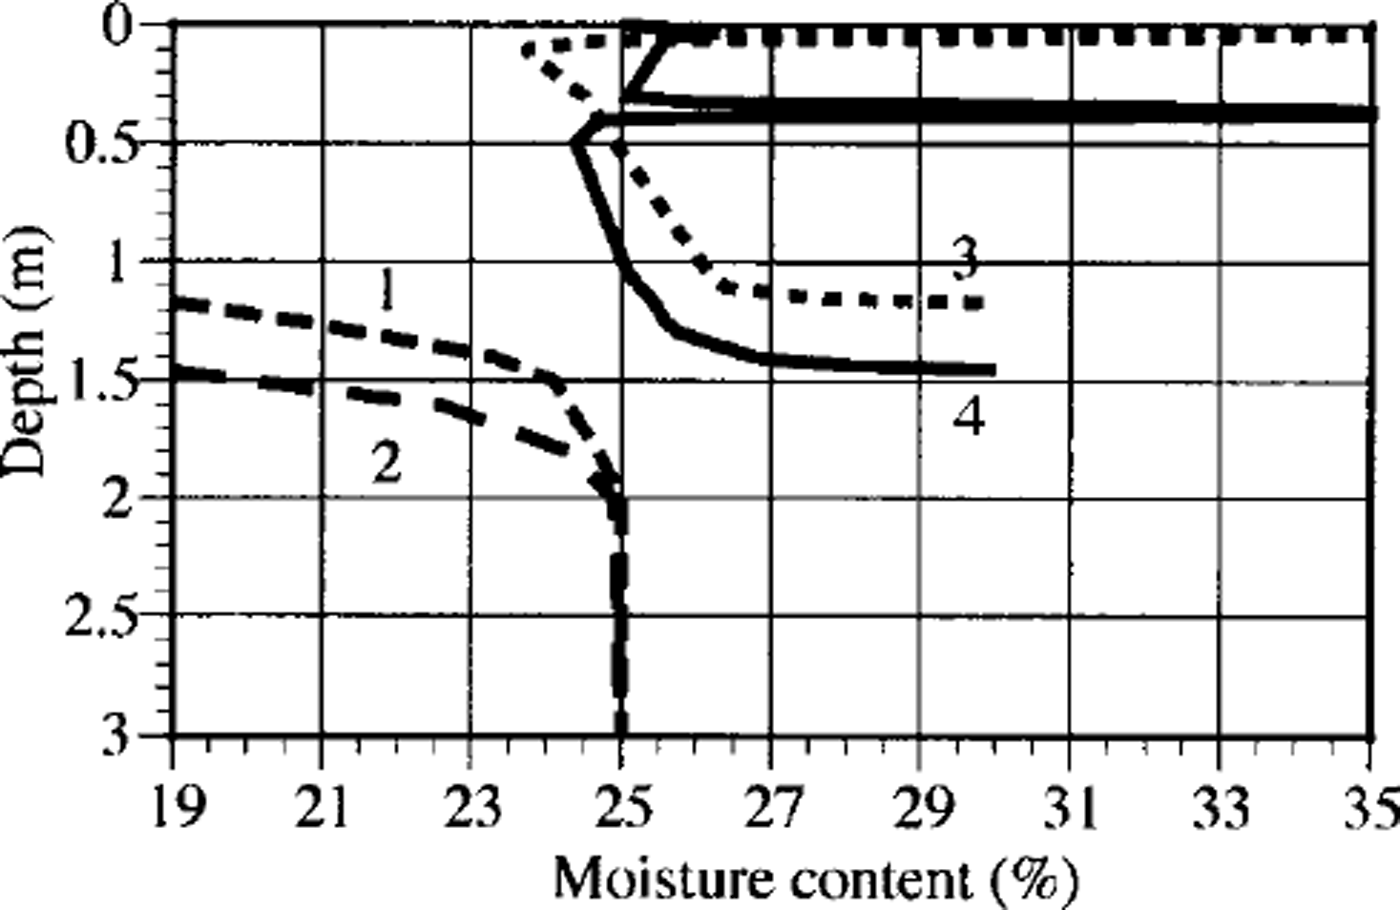
Fig. 5. The moisture distribution in thawed (1, 2) and frozen (3, 4) zones in soil for ˚mean" snow characteristics. No delay (1, 3) or 8 day delay (2, 4) between start of soil freezing and snow-cover appearance.
According to calculations done for the ˚low" snow characteristics, the total ice generation was 13.2 × 10–36 m with a freezing depth of 0.45 m (10, 2, 0.6 and 0.6 × KT3 m thick layers at depths of 0.32, 0.33, 0.34 and 0.45 m, respectively) for an 8 day delay, and 18.7 × 10⁶ m with no delay.
The calculations showed that the stable snow-cover formation with no delay leads to the appearance of ice layers several millimeters thick in the upper part of the soil. Sudden changes in air temperature and snow depth lead to changes in the moisture content of soil as a result of migration, and cause additional ice layers to form. Using the ˚low" snow characteristics, the 30 day temperature increase causes a 54.2 × lO"3 m thick ice layer to form on the freezing front. With a sudden change of the snow depth, 40, 8.3, 2.3 and 1.2 xKT3m thick ice layers are formed at depths of 0.32, 0.33, 0.34 and 0.35 m (with the freezing depth of 0.35 m). When no such sudden changes were modeled, the total ice generation was 13.2 × KT3 m.
For ˚mean" snow characteristics, the changes in moisture (ice) content of soil (Ah, (10–3m) and freezing depth Δz (m)) will be, respectively: +3.1 and –0.36 as a result of a minimum air-temperature increase from –30° to –20°C; +5.2 and –0.35 as a result of snow-depth increase from 0.7 to 1.4 m; +20.6 and –0.33 as a result of an initial soil-moisture-content increase from 25% to 30%. For the ˚low" snow characteristics the values will be noticeably higher.
Conclusions
The constructed model allowed us to estimate the impact of snow-cover characteristics on the process of soil freezing. The calculations showed that for similar snow-cover depth, but various ˚delays" between the start of soil freezing and snow-cover appearance, the soil freezing depth can differ by 2–3 times.
For different snow density, and heat conductivity of snow varying in the previously reported range, the freezing depth can differ up to 4–5 times.
These values suggest that neglecting the spatial and temporal variation of these characteristics leads to significant inaccuracy in determination of the temperature field, ice content and freezing depth of seasonally frozen soils.
Acknowledgements
The authors appreciate T. Zhang’s suggestions regarding the presentation of the model. We thank G. K. G. Clarke for his helpful comments.


