


Introduction
Many deep ice cores have been drilled, in both Antarctica and Greenland, and analyzed for a variety of parameters, such as electrical conductivity, dust, chemical constituency and 18Oand 2H isotope ratios. the δ18O and δ2H measurements can be used as a paleotemperature proxy, as both δ18O and δ2H are primarily affected by the local cloud temperature at the time of precipitation (Reference Armengaud, Koster, Jouzel and CiaisDansgaard, 1964). Deuterium excess d, defined by Reference Armengaud, Koster, Jouzel and CiaisDansgaard (1964) as
is taken as a measure of the difference in behavior between 18Oand 2H. A changing regime of evaporation in the source area will alter deuterium-excess values because the relative non-equilibrium contribution to the evaporation process will change. for polar regions it is now widely accepted that deuterium excess is above all affected by (1) the temperature of the moisture source and (2) the absolute humidity in that region (Reference Johnsen, Dansgaard and WhiteJohnsen and others, 1989; Reference FisherFisher, 1991; Reference Armengaud, Koster, Jouzel and CiaisArmengaud and others, 1998; Reference Delmotte, Masson, Jouzel and MorganDelmotte and others, 2000).
However, inmost cases, either δ18O or δ2H has been measured; seldom have both isotopes been measured simultaneously, largely due to the cost and time-consuming nature of these measurements.
From 1979 to 1981 the 2037 m (until bedrock) deep ice core at the Dye-3 location in south Greenland was drilled as part of the Greenland Ice Sheet Project (Reference DansgaardDansgaard and others 1982). the δ18O record of this core showed an abrupt 5‰ upward shift at 1784–1788 m depth, corresponding to a time interval of only about 100 years. This Younger Dryas/ pre-Boreal (YD/PB) transition has been examined in great detail, including deuterium excess (Reference Dansgaard, White and JohnsenDansgaard and others, 1989). the deuterium excess for this section showed a shift of about –5‰, starting at the same time as the δ18O shift, but reaching a new stable value about twice as fast as δ18O. This event defines the end of the last glacial period (Weichselian glaciation) and was preceded by a complex structure of rapid climatic shifts. the YD/PB transition is the last transition in the Bølling/Allerød–Younger Dryas (B/A– YD) climate oscillation.
The age of the ice at 1786m below surface was dated at 10720±150 years BP by counting annual layers in δ18O and electrical conductivity of the core. A more precise date of 11500±70 years BP for this transition has been obtained from the Greenland Icecore Project (GRIP) and Greenland Ice Sheet Project 2 (GISP2) cores by counting annual layers in several high-resolution chemical and isotope profiles (Reference JohnsenJohnsen and others, 1992).
Based on present-day spatial δ18O–temperature relations, Reference Dansgaard, White and JohnsenDansgaard and others (1989, Reference Dansgaard1993) at first assumed the YD/PB δ18O shift to represent a 7˚C temperature rise. Later it was argued that this value should be as high as 15˚C, based on borehole temperature calibration of the δ18O values in central Greenland (Reference Cuffey, Clow, Alley, Stuiver, Waddington and SaltusCuffey and others, 1995; Reference Johnsen, Dahl-Jensen, Dansgaard and GundestrupJohnsen and others, 1995).
The time-scales of the d and δ18O changes were initially calibrated at 20 and 50 years, respectively, using dating work done by Reference Hammer, Clausen and TauberHammer and others (1986), who claim a 2 cm annual-layer thickness in the YD and a 3 cm thickness shortly after the YD/PB transition. More recent insight is based on a comparison with the well-dated GRIP ice core, yielding mean annual layer thicknesses of 1.7 cm for the early PB, 0.7 cm in the YD, 0.9 cm in the Allerød, 0.95 cm in the Bølling and 0.45 cm in the pre-Bølling period. We estimate the accuracy of these values to be close to 10%. They are in fair agreement with annual high-resolution particle-induced X-ray emission (PIXE) data from sections of the Dye-3 core (Reference Hansson, Swietlicki, Larsson and JohnsenHansson and others, 1993). This makes it necessary to revise the time-scale of the YD/PB climate shift upwards to 50 and 100 years for the deuterium-excess and δ18O transitions, respectively. These are still very fast climate changes. A possible explanation is that the sea-ice cover retreated rapidly due to the return of the North Atlantic current, thus creating a vast area of initially cold surface water as an additional source of moisture (Reference Dansgaard, White and JohnsenDansgaard and others, 1989). the immediate cause is believed to be the return of the North Atlantic current to higher latitudes, and an associated northward shift of the polar front (Reference Ruddiman and McIntyreRuddiman and McIntyre, 1981; Reference Broecker, Peteet and RindBroecker and others, 1985; Reference BondBond, 1995).
The observed shift in δ18O at the onset of the Bølling period has a magnitude equal to that observed for the YD/ PB transition, thus indicating an enormous climate change on a short time-scale and making a detailed investigation as for the YD/PB transition equally interesting.
In recent years we have developed a new technique for measuring isotope ratios in our Groningen laboratory (Reference Kerstel, vanTrigt, Dam, Reuss and MeijerKerstel and others, 1999). the method is conceptually different from existing methods which are all based on isotope ratio mass spectrometry (IRMS). Instead, our apparatus uses an infrared laser to measure the direct absorption spectrum of gaseous water in order to obtain its isotope ratios (δ2H and δ18O, as well as δ17O). We have already shown its application in the biomedical field (Reference Van Trigt, Kerstel, Visser and J. MeijerVan Trigt and others, 2001), which, however, relies on the analysis of highly enriched samples (δ2H up to 15,000%!). This technique, as well as being elegant, is potentially very fast and can easily be automated. Advantages of the new method over the traditional ones include the absence of sample preparation. In fact, in practically all cases, even volatile contaminants do not interfere with the measurement, due to the very high selectivity obtained by high-resolution infrared spectroscopy. We directly obtain isotope ratios for deuterium and both oxygenisotopes. the δ18O measurement is not (yet) as accurate as with conventional techniques, but further progress is foreseen. However, for δ2H we already achieve a higher precision than most traditional methods, while the measurement of δ17O is new. Although it is known that for all natural, meteoric water samples a fixed relationship between 17O and 18O holds and thus, in principle, no new information can be derived from the 17O signal (Meijer, 1998), the 17O measurement can be used together with this fixed relationship as a check on the δ18O data, and possibly to improve their precision.
Here we demonstrate the application of the newly developed method to the measurement of the 18O/16O and 2H/1H isotope abundances in ice, investigating the deuterium excess in the Bølling transition in the Dye-3 deep ice core. This is the first application of our laser technique to ``real-life’’ samples in the natural abundance range.
Methods
Measurements
The laser spectrometer technique is based on direct absorption spectrometry, using a small section (~1.3 cm–1) in the 2.7 μm region of the infrared absorption spectrum of water. This section contains rotational–vibrational transitions for all four isotopomers of interest (i.e. 1H16O1H, 1H17O1H, 1H18O1H, and 2H16O1H). for water samples with natural isotope abundances the absorption strengths of these transitions are of the same order of magnitude and, although the spectral features are close to each other, they are well resolved. We can use the low-pressure, gas-phase, infrared absorption spectrum for isotope ratio determinations since the intensities of the transitions are a direct measure of the abundances of the corresponding isotopomers.
To record an absorption spectrum we scan a tunable, single-mode laser (a Color Centre Laser or FCL, Burleigh) from 3664.05 to 3662.70 cm–1 in about 5000 steps. for each step of the laser, we record the laser power before and after the passage through the gas cells using phase-sensitive detection.The spectra of the water samples in the four multiple-pass gas cells are thus recorded simultaneously. A 10 μL liquid-water sample is injected into the cells, assuring a final (partial) pressure of the water vapor of about 13 mbar, well below the saturation vapor pressure. One of the four gas cells always contains a working standard, while the others contain either reference water or an unknown sample. for each sample injection, eight successive scans were recorded. A full measurement cycle, including introduction of the sample, takes about 40 min. Since we have four gas cells, we measure three samples (or standards) in one run together with the working standard. Where duplicate measurements did not agree to within three times the mean standard deviation (SD), an extra measurement was made. This was needed for typically 10% of the samples. In the Bølling-transition section of the core, measurements were performed in fourfold. the error due to memory effects amounts typically to 55% of the difference in δ value between the previous and current samples. In this study this error is generally smaller than the analytical error. Special care had to be taken only after measuring Vienna Standard Mean OceanWater (V-SMOW) or Standard Light Antarctic Precipitation (SLAP), because their isotope ratios differ significantly from that of the samples and the other international calibration standard, Greenland Ice Sheet Precipitation (GISP). In these cases, the new samples were injected and removed once, before the actual measurement commenced.
Standards
Like traditional IRMS, laser spectrometry (LS) relies on comparison to a working standard (``machine reference’’) to obtain reliable isotope ratios. We chose a working standard as close as possible to the expected sample values, namely, a mixture of old ``leftover’’ batches of GISP. Repeated IRMS measurements established its isotopic signature to be very close (just 2.5‰ higher for δ2H) to the values of fresh GISP. As reference materials for the calibration of the system, we used fresh V-SMOW, SLAP and GISP. the use of primary calibration standards is defensible in this stage of the work, largely thanks to the very small amounts of water used.
The ratio of measured standards to samples for this project was about 1:3.
Samples
We measured 279 water samples of the Dye-3 ice core. Their age varies from 9200 to 14700 years BP, thus including both the YD/PB transition and the Bølling transition. As stated in the introduction, these samples have been previously measured for δ18O over the entire core, but not for δ 2H. Only for the YD/ PB transition has δ2H been measured previously (Reference Dansgaard, White and JohnsenDansgaard and others, 1989). In that study, all water was used up, so we could not include this particular section in our current program. the depth resolution of the ice-core section at depths of 1730–1812 m is 55, 27.5,11 or 5 cm, depending on the desired resolution for the specific period. In the Bølling transition the resolution is 5 cm, corresponding to roughly 7 years per sample.
Calibration
We apply a calibration procedure to scale our raw measurement results to the internationally accepted values of the calibration materials V-SMOW and SLAP, complying with the procedure recommended by the International Atomic Energy Agency (IAEA) (Reference GonfiantiniGonfiantini, 1984). It should be noted that in IRMS several types of corrections are necessary as well, but these are not as well understood and usually of much larger magnitude than those in LS.
The different gas cells exhibit different zero-point offsets. These are primarily associated with the optical alignment of the instrument. Because the alignment is very stable, we can easily and reliably correct for these offsets. the values are around zero with a magnitude of the order of 1 per mil.
The raw measurement results are also corrected for small differences in gas-cell pressure (amount of water) between the reference and sample cells. This linear correction is very well understood and can be calculated from simulated absorption spectra (Reference Kerstel, vanTrigt, Dam, Reuss and MeijerKerstel and others, 1999). Moreover, the magnitude of the corrections is small (typically 50.1‰) for all isotopes. the gas-cell and isotope-dependent scale expansion factors lie in the range 0.98–1.02, which is smaller than what is often seen in IRMS. the calibration procedure is described in more detail elsewhere (Reference Kerstel, vanTrigt, Dam, Reuss and MeijerKerstel and others, 1999). Note that the above scale corrections constitute a V-SMOW/SLAP scale normalization as prescribed by the IAEA (Reference CoplenCoplen,1988). After removal of obvious outliers, the final results are averaged for each sample.
Results and Discussion
Measurement precision
An indication of the precision of the LS measurements is the single-measurement SD of repeated measurements on the same sample. As each sample was measured only two to four times, one sample will not provide reliable statistical information. Therefore we take the mean of all calculated SDs as a measure. We then find the single-measurement precision to be ~0.6‰ for δ2H, ~0.5‰ for δ18O and ~0.3‰ for δ17O. the statistical spread of the SDs (histogram) is fairly well represented by a Gaussian curve. These results are comparable to those obtained in analyses based on repeated measurements of the same water sample (in particular V-SMOW), which were carried out in the framework of previous studies (Kerstel, 1999; Reference Van Trigt, Kerstel, Visser and J. MeijerVan Trigt and others, 2001). the better performance of the LS system in the case of δ17O is attributed to the higher signal-to-noise obtained on the H17OH spectral feature, compared to the H18OH line.
The relationship between δ18O and δ17O for meteoric waters established by Reference Meijer and LiMeijer and Li (1998) enabled us to calculate values for δ18O from the measured δ17O. In the case of a linear fit forced through zero for the inferred δ18O against the measured δ18O, we find a slope of 1.0023(20).We conclude that to good approximation these inferred (indirect) and measured (direct) δ18O values may be treated as duplicate determinations. the δ17O measurements thus serve as a check on the δ18O measurements and may even be used to improve the precision of the latter by doubling the number of independent δ18O determinations. We averaged the δ18O measurement and the calculated δ18O value (inferred from the δ17O measurement), using the squared errors as weighing factors, resulting in a precision of the combined determination of ~0.4‰. the combined result (i.e. the weighted mean) does not differ significantly from the direct δ18O measurement.
Deuterium and oxygen-18 isotope records
The depth profiles of the δ2H and δ18O records determined by means of LS are shown in Figure 1. They show qualitatively the same behavior, and the major transitions are clearly visible in both. As mentioned before, samples from the 1784– 1788 m interval (YD/PB transition) were no longer available.
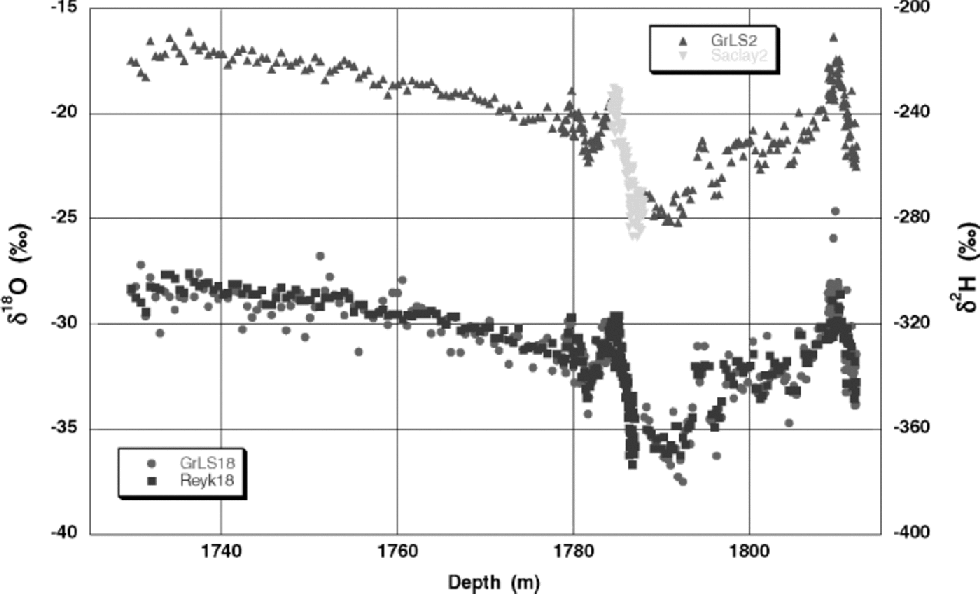
Fig. 1 δ 2H (GrLS2) and δ18O (GrLS18) depth profiles as measured with the Groningen LS apparatus. As explained in the text, the water samples around 1785 m (the YD/PB transition) were used up in the original measurements (Reyk18, given here for comparison purposes) by Reference Dansgaard, White and JohnsenDansgaard and others (1989), thus leaving a gap in the Groningen records. Reference Dansgaard, White and JohnsenDansgaard and others’ (1989) deuterium measurements (Saclay2) fit well into the gap in the GrLS2 record.
The LS δ18O record (GrLS18) can be compared directly to the old Reykjavik IRMS data (Reyk18), also shown in Figure 1.The median delta values for the two curves amount to –30.83‰ (279 samples) and –30.89‰ (281 samples) for the GrLS18 and Reyk18 records, a strong indication that the data have been properly calibrated. Closer inspection of the two isotope records reveals just one small section of the core at the end of the Bølling transition in which the two records deviate. Figure 2 shows this Bølling-transition region in detail. Between 1809 and 1810m (24 data points) the GrLS18 and Reyk18 records have median delta values that differ by 1.1‰. Such a large difference cannot be explained by fractionation (e.g. accompanying evaporation) during storage, transportation or sample preparation. Contamination, most likely by fragmentation of the drilling fluid in the ion source of the mass spectrometer, would have resulted in a higher IRMS value, not a lower one, with respect to LS. Moreover, the Reykjavik IRMS system is equipped with special cold-traps to prevent such contamination from affecting the measurements. Also, it is highly unlikely to have affected a small section of the core only. In fact, ice-core analyses of our Copenhagen laboratory (which does not take such elaborate measures as the Groningen laboratory against drilling-fluid contamination) in general show a systematic and more or less constant offset, up to about 0.5‰.
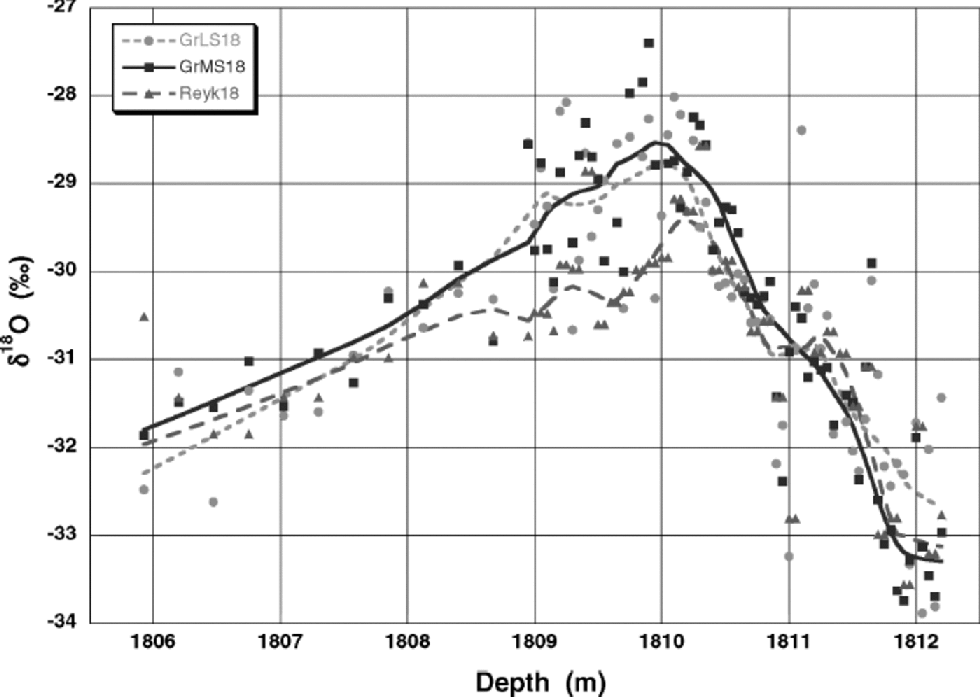
Fig. 2 Depth profiles for δ18O around the Bølling transition (about 14 500 years BP). Groningen LSand IRMS data are shown, as well as the old Reykjavík IRMS data. the deviation of the old and new measurements for the samples at 1809–1810 m is clearly visible.
In conclusion, we have no explanation for the observed local discrepancy between the GrLS18 and the Reyk18 records. for this reason, we remeasured 74 samples belonging to the Bølling transition (1806–1813m) by means of mass spectrometry in Groningen. This partial record we will refer to as GrMS18. Its median value is 0.43‰ higher than the GrLS18 record in the same depth range, tentatively attributed to drilling-fluid contamination of the ice-core, as also observed in the past in our Copenhagen laboratory. the GrMS18 record shows a substantially smaller scatter, reflecting the higher precision of IRMS with respect to δ18O measurements by means of LS. When the GrMS18 record is shifted downwards by 0.43‰, a nearly perfect agreement with the GrLS18 record is obtained, as can be seen in Figure 2.
The transition (increasing temperature with time; note that the time-scale is from right to left) occurs in about 1.5 m of ice. If we take the average annual-layer thickness during the transition to be equal to 0.7 cm, this corresponds to about 200 years or twice as long as the YD/PB transition. During the Bølling transition, δ18O increases from about –33.5‰ to –28.5‰ and the δ2H signal increases from about –260‰ to – 220‰. This is similar to the YD/PB transition and suggests a similar temperature rise of about 15˚C. We also notice in the δ18O record a 2‰-strong cold event at 1811.0 m depth in the middle of the Bølling transition lasting only 25 years. This climatic event is not as clearly depicted in other Greenland isotope records.
Deuterium excess
For the samples analyzed in this study, no deuterium depth profile previously existed, so there are no data to compare to. Only for the YD/PB transition (the section between 1784.20 and 1788.05m) has δ2H been measured (Reference Dansgaard, White and JohnsenDansgaard and others, 1989). But, as explained before, this section is missing in our dataset. However, as Figure 1 shows, the old δ2H record (Saclay2), measured previously in the stable-isotope laboratory at Saclay, France, fits well into the ``gap’’ in the present record (GrLS2), again demonstrating the quality of the calibration of the data, as well as the integrity of the two-decade old samples (δ2H in particular is very sensitive to fractionation processes).
From other deuterium-excess measurements on large numbers of ice-core samples, as well as from several laboratory ring-tests, we conclude that a typical deuterium-excess precision, using conventional IRMS techniques, amounts to about 1.8‰ (based on a precision of ~1‰ for δ2H and ~0.1‰ for δ18O). Although some glaciological isotope laboratories claim a precision well below the values used here, these claims may prove to be exaggerated if it comes to the accuracy of the measurements, particularly of the deuterium excess. Inter-laboratory comparisons carried out by the IAEA have demonstrated the difficulty of maintaining such high levels of accuracy across a number of specialized isotope laboratories (Reference LippmanLippman, 2000). This is especially reason for concern when two isotope measurements (δ2H and δ18O) are used to calculate the deuterium excess. We would therefore strongly urge the participation of the ice-core isotope community in similar ring-tests. the LS measurements alone (precision of~0.6‰ and ~0.4‰ for δ2H and δ18O, respectively) would yield a precision for deuterium excess of about 3.8‰, which is the same size as the expected natural (climate) variations. We therefore calculate the deuterium excess during the Bølling transition using the GrLS2 deuterium record together with the GrMS18 oxygen-18 record. the latter has been shifted downwards by 0.43‰ in its entirety, in order to best overlap with the more accurate, well-calibrated, GrLS18 record. As mentioned before, this procedure is justified by earlier observations of systematically higher IRMS δ18O values when no proper precautions are taken to prevent residual drilling fluid from interfering with the measurements.
Figure 3 presents the deuterium-excess depth profile in the range 1806 –1813 m, around the Bølling transition. the rms deviation of the data points with respect to the smoothed curve amounts to 1.4‰. This equals the estimated uncertainty in the deuterium-excess determination, based on the measurement uncertainties in δ2H and δ18O (0.6‰ and 0.1‰, respectively).The curve indicates that deuterium excess decreased by about 6‰ within a time-span of about 70 years at the onset of the warming. the residual structure on the curve, in particular the two small dips at 1811.5 and 1809.5m, falls within the measurement uncertainty and we hesitate to associate these with minor climate events. the overall pattern, then, is rather similar to what has been observed previously for the YD/PB transition (Reference Dansgaard, White and JohnsenDansgaard and others, 1989), and we may indeed assume that the same mechanism that caused the YD/ PB transition was also operative during the Bølling transition. It would be interesting to compare the Bølling isotope records to the other climate indicators, especially dust. If indeed the rapid shift in deuterium excess at the onset of the Bølling transition signals a northward shift of the polar front, in response to a return of the North Atlantic current to higher latitudes, one would expect to see a decrease in dust in parallel with the deuterium-excess shift, indicative of a more humid, milder and less stormy climate.
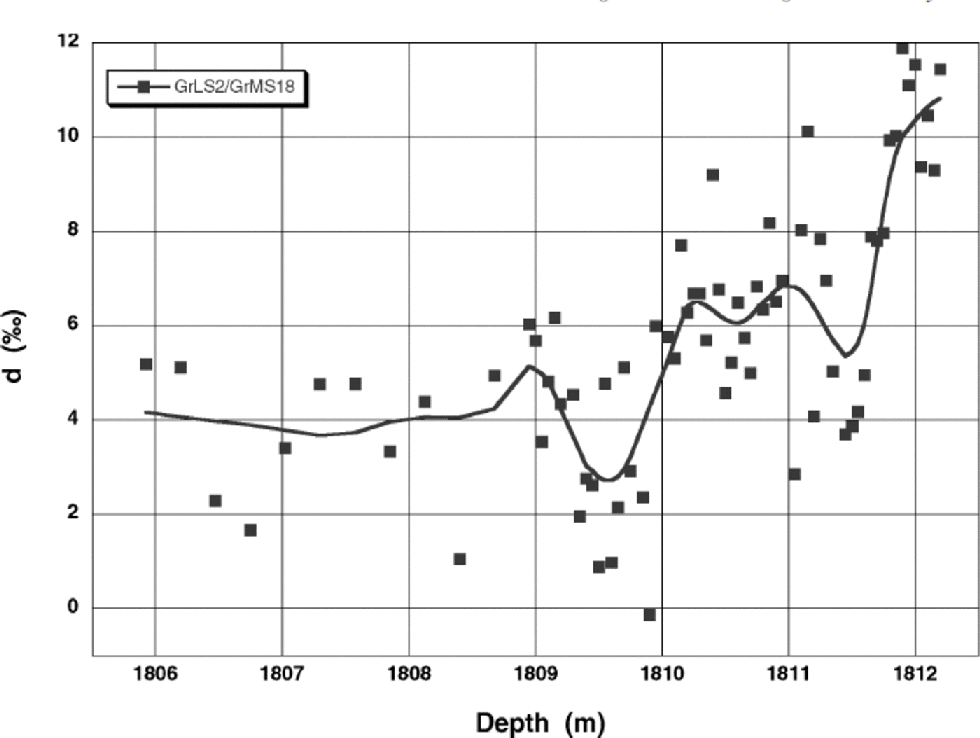
Fig. 3 Deuterium excess, d ~ δ2H – 8 δ18O , for the Bølling transition. the solid curve is obtained by smoothing of the GrLS2/ GrMS18 data and serves mainly to guide the eye. the rms deviation of the data with respect to the smooth curve is 1.4 ‰ . the shift in deuterium excess at the Bølling transition is about 6 ‰ , as was found for the YD/PB transition 26 m higher up in the core (Reference Dansgaard, White and JohnsenDansgaard and others, 1989).
The general picture emerging from these isotope and other studies is that the climate in the last glacial period has shown abrupt and radical changes in ocean circulation, polar front position, storminess, humidity, atmospheric temperature and evaporation conditions.
Conclusions
LS is a new and elegant way of measuring stable isotopes in ice-core samples. Its sample throughput is already quite high (50 samples d–1) and can easily be increased further. the single-measurement precision obtained for δ2H measurements (~0.6‰) is very competitive with traditional IRMS methods. for δ18O the precision (~0.5‰) is still almost one order of magnitude worse, while the measurement of δ17O (~0.3‰) is new. the δ18O precision can be improved to ~0.4‰ when δ18O and δ17O measurements are combined. When IRMS δ18O measurements and LS δ2H measurements are combined, a precision of ~1.4‰ for deuterium-excess measurements can be achieved, comparable to IRMS-only. Whereas IRMS δ18O measurements can be severely affected by drilling-fluid contamination, if no proper precautions are taken, LS is virtually immune to such effects, thanks to its extremely high molecular and isotopomer selectivity. Thus, the LS δ18O results are more accurate (but not more precise) than those obtained by IRMS.
The YD/PB transition (11500 BP) as measured by Reference Dansgaard, White and JohnsenDansgaard and others (1989, Reference Dansgaard1993) is not the only sharp transition at the end of the last glaciation. Some 3000 years earlier, the Bølling transition showed a similar temperature rise, in approximately 200 years time. Deuterium excess shifted similarly in about 70 years. Together, these observations indicate that the underlying mechanisms may have been very similar during the onset of the Bølling interstadial and the YD/PB climate transition.
Acknowledgements
The work was supported by the Dutch Foundation for Fundamental Research on Matter (FOM). E.K. would like to acknowledge a 5 year fellowship of the Royal Netherlands Academy of Arts and Sciences (KNAW). Finally, we would like to thank T. B. Coplen, J.W.C.White and E. J . Steig for useful comments on the manuscript.


