


Introduction and Background
Ice streams are an expression of the inherent instability of the West Antarctic ice sheet, and their behavior is a key control on the overall ice-sheet mass balance. Understanding the response of the ice sheet in a warming climate requires a thorough understanding of the internal dynamics of ice streams, in addition to the relevant ice/atmosphere and ice/ocean interactions in the region.
The basal environment of the ice streams and of many glaciers is a key scientific interest, including conditions, mainly basal sliding, that lead to fast flow of the ice. To obtain direct data on the deep basal glacial conditions, emplacements of instruments are enabled by fast hot-water drilling of access boreholes (Reference Engelhardt and KambEngelhardt and Kamb, 1997); and to obtain data on the nature of the ice near the bed, borehole video cameras have been deployed to acquire extensive video images (Reference Behar, Carsey, Lane and EngelhardtBehar and others, 2001; Reference Carsey, Behar, Lane, Realmuto and EngelhardtCarsey and others, 2002). The purpose of this paper is to present a review of the full range of original video recordings from the basal ice of Kamb Ice Stream (KIS). Direct observations at the ice-stream bed are a crucial complement to modeling efforts predicting future scenarios in a warming climate.
West Antarctic ice sheet
The West Antarctic ice sheet (WAIS) is drained to the Ross Sea, the Weddell Sea and the Amundsen Sea by ten large ice streams and several glaciers of various sizes. The overall balance of the ice mass depends on the dynamics of the ice streams that move at a speed 10–100 times faster than the surrounding ice sheet. The dynamics of the ice is controlled for the most part by processes that are active at the base of the ice. Is the ice frozen to the bed or is it at the pressure-melting point? Is the ice underlain by a layer of water-saturated till or by bedrock? Is the water pressure at the bed high or low? Is the ice mostly deforming or sliding over its bed? Is the geothermal flux normal or unusually high? Various ice/bed interactions control the velocity of the ice and so ultimately the balance of the ice mass. Is the ice sheet increasing or shrinking; is it in stable condition or is it destined to collapse (Reference KambKamb, 1990; Reference VogelVogel and others, 2005)?
Surge behavior
A surge of a glacier is a period of high velocity, about 10–100 times faster than during the slow-flow phase. Predominantly basal sliding instead of internal deformation of the ice controls the speed. During the surge a sufficiently large area of the glacier bed is lubricated by water at high pressure. This active surge phase can be maintained only for a limited time because the source area of the ice is depleted or because a loss of water removed sufficient lubrication. A quiescent phase follows, which is normally much longer than the active phase. A whole cycle can last tens to hundreds of years depending on the individual circumstances. Although the term ‘surge’ implies a relatively short time period of months or years for surges of temperate valley glaciers, cold glaciers on ice caps in Canada, Iceland and Svalbard and ice streams in Greenland and Antarctica may require a much longer timescale. We recognize them as surging based mainly on their intermittent exceptionally high speed.
Kamb Ice Stream 2000/01 field program
Kamb Ice Stream (KIS) is especially interesting because it was very active in the past until it stopped flowing fast ∼150 years ago (Reference Retzlaff and BentleyRetzlaff and Bentley, 1993; Reference Smith, Lord and BentleySmith and Bentley, 2002). The timing of the stoppage can be determined from the depths of buried crevasses ∼22 m below surface, but also from the thickness of a distinct frozen-on layer at the bottom of the ice. The location of our field program is shown in Figure 1. A velocity profile was measured from north to south across the ice stream, using repeat GPS location fixes at 86 stakes. It started at km 0 with coordinates 81 849.700 S, 135859.990W and ended at km 102.97 (82845.300S, 135846.390W). The velocity and the corresponding ice-thickness profile (Reference Conway, Catania, Raymond, Scambos, Engelhardt and GadesConway and others, 2002) was the basis for choosing specific drill sites to capture a variety of basal situations (Fig. 2). Of a total of 11 boreholes at three drill sites, three were dedicated to video camera deployment, boreholes 3, 5 and 9.

Fig. 1. Radar image of Kamb Ice Stream (NASA; Canadian Space Agency; RADARSAT Int. Inc.; Reference JezekJezek, 1999) with sticky spot (SS). Flowlines are drop-shaped around a topographic high, where the bed is currently frozen. Flow is east to west. The 1997 field camp with runway is visible as a white spot east of the drill sites indicated as white dots.
Fig. 2. Velocity and depth profile north–south across KIS from km 0 at 81849.700 S, 135859.990 W to km 102.97 at 82845.300 S, 135846.390 W as shown in Figure 1 . Location of drill sites indicated by arrows on the lower axis.
The first drill site (82822.000S, 136824.000W), at km 59.85 on the velocity profile, is in an area with low ice velocity of 7.5 ma– 1 . The ice at this site turned out to be frozen to the bed and therefore the area is recognized as a sticky spot (SS). The visible flowlines are curved around this drop-shaped island within the ice stream, which is about 30 km long and 15 km wide (Reference Jacobel, Welch, Osterhouse, Pettersson and MacGregorJacobel and others, 2009). The second drill site (82825.9580S, 136824.1360W) is 7.28 km south of site 1, outside SS with a local ice velocity of 14.15 m a- 1 . The third site (82823.9730S, 136824.2780W) is in the transition zone, 3.64 km south of site 1, with a local
Basal ice
Origin of basal ice
Meteoric ice derived from snowfall at the surface makes up the bulk of an ice sheet. This ice originally contains bubbles of pressurized air, with the consequence that, when the air pressure in bubbles exceeds the fracture strength, it is very brittle and fragile when the ice cores are brought to the surface and depressurized. At a depth around 1200 m depending on temperature, a phase transition to clathrate ice takes place, in which the air molecules become part of a type of ice lattice called a clathrate. The bubbles disappear and the ice turns clear and ductile.
In general, basal ice can have a more complex history, possibly reflecting conditions at the onset of glaciation (Reference SouchezSouchez and others, 1994; Reference GowGow and others, 1997). In particular, basal ice in an ice stream can be derived from basal water by various freeze-on processes including regelation and depressurization of cold water at the freezing point (Reference Alley, Cuffey, Evenson, Strasser, Lawson and LarsonAlley and others, 1997, Reference Alley, Lawson, Evenson, Strasser and Larson1998; Reference KnightKnight, 1997). Mechanical processes such as folding or shearing can also entrap debris. The basal layer in cold Antarctic ice streams can be tens of meters thick. Depending on the effective pressure, which is the difference between the ice overburden pressure and the basal water pressure, the interaction of the ice with the bed varies and therefore the amount of debris incorporated into the ice can vary during the accretion process. Layers of clean ice alternate with layers of debris-laden ice of various thicknesses and debris concentrations. When a piece of rock freezes on, it is removed from the bed, but still acts as a tool for comminution, abrasion and ploughing until it is fully incorporated into the ice.
A piece of deep glacial ice obtained from an ice core, either bubbly or clathrate ice, when placed in a glass of whisky or water experiences vigorous crackling and degassing. Yet when a piece of clear basal ice from KIS is put into water, nothing happens other than melting, showing that basal ice is practically devoid of air. Glacial bubbly ice above the basal accreted ice contains 10.5–12.5 cm3 of air per 100g of ice, while in the same amount of basal ice there is <0.2 cm3 of air (Reference Gow and WilliamsonGow and Williamson, 1975). The occurrence of air-free, non-clathrate, clear ice often coincides with the first appearance of debris in the basal ice layer. Since mechanical incorporation of debris into existing ice would not change the air content so drastically, the slow freeze-on process, during which segregation effectively prevents air from being incorporated into the ice lattice, must have formed most of the basal ice of KIS.
Absence of air from basal ice constitutes a diagnostic test for discriminating between debris incorporated by melt– refreeze processes and debris entrapped by purely mechanical means, shearing and folding. Isotopic analysis can provide an equally diagnostic test. In addition, shearing and isoclinal folds of debris into basal ice would require strong shear drag at the base. However, silty, cloudy, milky or discolored ice, as observed in the basal ice domain of Summit cores in Greenland or the Byrd core in Antarctica (Reference Gow, Epstein and SheehyGow and others, 1979), is completely absent from the basal ice of KIS, indicating that basal deformation of the ice does not occur or is very weak during and after the accretion process of basal ice, because shearing would elongate spherical mud clots and transform them into bands of discolored ice. Instead near-spherical mud clots in the basal ice are invariably surrounded by clear ice. Much of the driving stress is balanced by lateral shear stress along the margins rather than the bed of the ice streams (Reference Harrison, Echelmeyer and LarsenHarrison and others, 1998).
Basal thermal conditions
The speed of fast-moving ice streams is controlled by internal deformation of the ice, basal sliding, and it is believed that deformation of the subglacial debris may sometimes play a role (Reference Boulton and HindmarshBoulton and Hindmarsh, 1987). In deep ice streams with enough slope and consequently high shear stress, internal deformation may play the predominant role, but in relatively shallow ice streams, such as the lower Whillans Ice Stream (WIS) and KIS with thicknesses of the order of 1000–1500 m and very low slopes of the order of hundredths of a degree, basal sliding is prevalent (Reference Engelhardt and KambEngelhardt and Kamb, 1998). This requires a wet bed with high water pressure for efficient lubrication to reduce bed friction.
The basal thermal condition, whether the ice is melting or freezing at the bed, depends for the most part on the geothermal flux and the basal temperature gradient. In the case of KIS, we can determine the present basal freeze-on rate. In our boreholes across KIS, we measured unusually steep basal temperature gradients in the ice, of 60.5– 71.3 K km–1 (Reference EngelhardtEngelhardt, 2004a). A geothermal flux of 69 mWm–2 was measured in the neighboring Siple Dome borehole (Reference EngelhardtEngelhardt, 2004b). Under the assumption that basal sliding cannot support friction as an additional source of heat, we can calculate a basal freeze-on rate of 6.5– 9 mma–1. At this rate we would need approximately 1500– 1000 years to obtain the 10 m thick basal layer typically observed. This is much longer than the 150 years since the time when KIS stopped moving fast. Since then, only the lowest 1–1.4m has been frozen-on. Therefore, we conclude that freeze-on started much earlier in the history of KIS, even when it was an active ice stream at high speeds. Only 150 years ago freeze-on reached a critical limit, or water supply at high pressure was not sufficient to support high sliding speeds over big enough areas. A loss of water from an outburst flood, as often observed at the termination of glacier surges (Reference KambKamb and others, 1985), could also have contributed to the slowdown of KIS. Less water would have made the bed rougher, and in some places (e.g. sticky spots) the ice was already solidly frozen to the bed (Reference EngelhardtEngelhardt, 2004a).
Basal-ice chronology
The timeline of the basal ice accretion is complicated. It depends on many variables, including the basal temperature gradient in the ice, the geothermal flux along the ice-stream bed, the state of the basal hydraulic system, the water pressure and the sliding speed. The mass that is captured and advected into or melted out of the ice is the result of the history of ice/bed interactions evolving through time as the ice moves along its bed. We can describe the attributes of the layers with their distinct distribution and concentrations of debris of various kinds, but we are interested mainly in the processes that led to the incorporation of debris. Models may help us to quantify some of these processes (Reference O’Neill and MillerO’Neill and Miller, 1982, Reference O’Neill and Miller1985; Reference Alley, Cuffey, Evenson, Strasser, Lawson and LarsonAlley and others, 1997; Reference Tulaczyk, Kamb and EngelhardtTulaczyk and others, 2000a,Reference Tulaczyk, Kamb and Engelhardtb; Reference Bougamont, Tulaczyk and JoughinBougamont and others, 2003; Reference Christoffersen and TulaczykChristoffersen and Tulaczyk, 2003; Reference Rempel, Wettlaufer and WorsterRempel and others, 2004).
The basal-ice character is the result of a complex sequence of basal processes, and those processes also play an important part in the overall dynamics of the ice-sheet/ ice-stream system. The basal ice has a different chemical and isotopic composition from the meteoric ice above and has distinctly different physical properties due to the debris content, the ice fabric, water content, and grain-size distribution and crystal-axis orientation. In glacier and ice-sheet modeling and ice-stream dynamics, this basal-ice layer has generally been neglected, or greatly idealized, while in reality it might be of utmost importance (Reference IkenIken, 1981). Glacier surges are dramatic events where changes in speed occur rapidly with dislocation of huge ice masses, but they are also of limited duration. Kamb Ice Stream shows a history of such changes in the record of surface lineations and internal layering obtained from satellite images and radar profiles (Reference Catania, Conway, Raymond and ScambosCatania and others, 2005). In the case of KIS, the basal ice contains a remarkable record of past conditions giving us valuable data on the conditions that determine the previous fast flow, and more recent stoppage of an ice stream, and its potential for renewed fast flow or surge.
Methods
Access holes
The boreholes were drilled with the California Institute of Technology (Caltech) hot-water drilling system, which is capable of drilling a 1000m deep hole in less than a day (Reference Bentley, Bar-Cohen and ZacnyBentley and others, 2009). The water-filled borehole was initially 17.5 cm in diameter to accommodate the video camera case of 12.5 cm outer diameter and to allow for the gradual refreezing of the borehole during down-hole camera deployment. Because in the upper half of the borehole the ice temperature is -268C, the camera could be safely used in the borehole, without getting stuck, for about 4 hours. After that much time has elapsed, the borehole needed to be widened again using a hot-water reamer. The ice-stream thickness at our borehole sites was measured from the snow surface with the video-camera cable, which is a Kevlar-reinforced fiber-optic cable with little stretch, which we calibrated with a tape measure. We estimate that the uncertainty in the absolute depth is 0.5 m, and the repeatability and the precision on any particular logging run is 0.01 m at 1 km depth. The nominal ice-stream thickness at borehole 3, site 1 was 951.7 m; at borehole 5, site 2 it was 1191.8 m; and at borehole 9, site 3 it was 1033.9 m. Between the base of the ice at borehole 9 and the top of the till, we discovered a water-filled gap 1.4 m thick. In borehole 5 the basal gap was approximately 1-2 cm. The best way to know the depth of the ice and to ascertain that the bed has been reached is to see with the camera the actual basal edge of the ice. This was possible in boreholes 5 and 9, not in borehole 3 where the ice was frozen to the bed.
During hot-water drilling, the borehole is filled with water up to the permeable firn layer ∼30m below the surface. At the moment the hot-water drill breaks through from the ice to a wet bed, the borehole in most cases makes a good hydraulic connection and water rushes out of the boreholes into the basal water system. The water level in the borehole drops from 30 m to a level ∼100m below the surface for a 1000 m deep borehole. The new lower level corresponds to a water pressure at the base, which is near the ice overburden pressure. A typical water-level drop starts very rapidly and is completed within 1-2 min depending on the efficiency of the basal hydraulic connection. Occasionally the water pressure oscillates two to three times around the overburden pressure (Reference Engelhardt and KambEngelhardt and Kamb, 1997).
This vigorous outflow of water helps in cleaning out turbidity from the borehole that unavoidably forms when the drill is melting out debris-laden ice or is stirring up basal debris. High turbidity would prevent us from taking clear pictures with the video camera. In order to remove any lingering turbidity, pumping additional clean water into the borehole was sometimes necessary to prepare the boreholes for camera work. The situation is more difficult when the base of the ice is frozen to the bed and into the till so that no water can run out. This was the case for site 1 boreholes. No breakthrough occurred and the water level in the borehole did not drop. Camera work would have been impossible had we drilled all the way to the bottom and filled the borehole with turbid water. Instead, we initially drilled only into the upper 1.6 m of the basal ice. Clean water was pumped to the bottom of the borehole that stopped ∼24 m short of the base of the ice, in order to displace the turbid water. Turbidity could not be eliminated completely, but enough to see the debris-laden ice with the side-looking camera. After we drilled all the way to the bed, the bottom could be seen only when the down-looking camera window directly touched the melted-out debris collected at the base.
Deployment of video camera
The first application of a deep down-hole video camera system with digital technology for the purpose of obtaining data relating to ice dynamics was on KIS in the Antarctic field season 2000/01. The Ice Borehole Camera System is described in detail by Reference Behar, Carsey, Lane and EngelhardtBehar and others (2001) and Reference Carsey, Behar, Lane, Realmuto and EngelhardtCarsey and others (2002). It was designed and built by a team of glaciologists at Caltech and engineers at the Jet Propulsion Laboratory (JPL) in Pasadena. The objectives of the deployment were to examine accreted ice thought to be related to the flow, and ultimately the shutdown of streaming flow, in the recent past (Reference Retzlaff and BentleyRetzlaff and Bentley, 1993) and to observe directly the movement of the ice stream over its bed. The probe case contains two video cameras, one looking downwards in the borehole and one looking sideways into the ice at the borehole wall, each with its own light sources. The down-looking video images were recorded on tape at the surface station only. The side-looking videos were recorded simultaneously on the down-hole video camera tape recorder as well as on the surface tape recorder. The depth was measured with a calibrated metering sheave and an electronic bidirectional counter.
The system can take continuous videos with a rate of 30 frames s–1 and a resolution of 720 × 480 pixels per frame in NTSC (US National Television Standards Committee) format. A total of 30 hours of imaging data were acquired in three boreholes. Examples are archived at the US National Snow and Ice Data Center (NSIDC) in Boulder, CO (http:// nsidc.org/data/NSIDC-0528.html).
During the recording, the cameras move up or down in the borehole at a speed of 1 cm s–1. The side-looking images are vertically inverted, shown upside down. In the left upper corner (Fig. 3), a depth counter reading overlies the image. The real depth relative to the surface is obtained by dividing the number on the frames by a factor of 1.030 and adding 1.62 m. In the text and plots, the depth counter readings recorded on the images are used to avoid confusion. All images are from borehole 9, unless stated otherwise, because images from borehole 5 show essentially the same sequence of textures (Reference Christoffersen, Tulaczyk and BeharChristoffersen and others, 2010).

Fig. 3. Image of ice at 1056.71 m depth below surface, taken with side-looking video camera. Scale 40 mm × 60 mm.
We discovered a faint ash layer at 728 m depth, which is probably related to a strong reflection horizon often seen in radar sections (Reference LairdLaird and others, 2010). Most of our effort, however, was concentrated on imaging the lowest 10–20 m of basal ice.
The still images, presented in this paper as examples, are single video frames, i.e. 14 frames out of >100 000. The complete video and an even better stereo rendering of the images give a much more vivid impression of the basal ice scenery. Examples can be viewed at a webpage of NSIDC (http://nsidc.org/data/NSIDC-0528.html).
Results
Thickness of basal ice
The basal ice consists of a sequence of layers produced by the freeze-on of basal water and debris as the ice stream slides along its bed under varying but generally high water pressure at or close to the ice overburden pressure (Reference Engelhardt and KambEngelhardt and Kamb, 1997). It is free of air bubbles and contains debris in varying proportions and distributions. It is certainly not the type of clathrate ice that forms by a transition from bubbly ice by incorporating air molecules into the ice lattice host and therefore is rich in air but debris-free, because it is not expected to be stable at the pressure and temperature conditions at the base of KIS (Reference Kuhs, Klapproth, Chazallon and HondohKuhs and others, 2000). In our boreholes, the basal ice always had bubbly ice above it, and the transition was abrupt unlike a transition to clathrate ice.
In borehole 3 at site 1 , we could observe only the top 1.7m of the basal ice of total thickness 28.73 m. The next 27 m downward were obscured by turbidity in the borehole water. Because the ice was frozen to its bed, flushing out the turbid water was difficult. The bed could be seen by pressing it closely against the window of the down-looking camera. However, the visible images from this borehole reinforced and confirmed features in other boreholes. The fact that we find a basal layer of frozen-on ice of similar thickness and stratification to those in the other boreholes that were not frozen to the bed shows that this area shared a similar flow history for most of the time and that it was part of the ice stream during previous periods of fast flow. This is also manifest in the same basal temperature gradient as in the ice outside the present sticky spot (Reference EngelhardtEngelhardt, 2004a). The solid freeze-on to the bed seems to be a more recent occurrence. Since freeze-on to the bed, some folding may have occurred near the bed, but could not be recognized in the images.
Borehole 5 at site 2 had the first debris-laden ice layer 25.10 m above the bottom. This layer was only 0.44 m thick. Below this layer was a bubble-free ice mass that was 10.56 m thick and revealed layering with laminar structure and clear ice lenses. The next occurrence of debris inclusions in the basal ice started 14.10 m above the bed. At the base was a small gap 10–20mm wide between the ice and the till bed. This gap was certainly not formed by water running out of the borehole, because the water was too cold and it ran out instantly and not more gradually as is the case for an initially small gap. The water level in the borehole, and therefore the water pressure at the bed, was firmly established and could not be changed by pumping water in or out of the borehole, indicating a well-developed basal hydraulic system at a water pressure equivalent to the overburden pressure of the ice. All turbidity in the borehole was thoroughly removed by flushing, thus enabling the cameras to take clear pictures.
In borehole 9 at site 3, the basal ice with detectable debris started 9.78 m above bottom. However, the ice above this mark seems to be different from bubbly ice. Therefore the basal ice from basal accretion may have extended further up to reach a total thickness comparable with the other boreholes. At the base, for the first time a surprising discovery was made. As we lowered the camera, we could see the basal ice edge, and lowering it further we could see the smooth basal ice surface from below with no rocks sticking out. From the base of the ice to the real bed, a water-filled channel or lake existed that was 1.4 m deep. Again, as in borehole 5, at the moment the drill reached the bottom, drilling stopped and the drill was immediately raised to avoid its getting stuck in the till below. The water running out of the borehole was near the pressure-melting temperature and could not melt out a cavity of this size. Even the initially hot drilling water after being pumped through 1000 m of hose surrounded by cold water was already very cold near the base, slowing down the drilling speed to a few meters per hour. The extent of the subglacial channel can be estimated for the upstream part to be 166-230 m using the thickness of the bottom layer of clear ice of 100 mm, a freeze-on rate of 6.5-9 mm a-1 as calculated above, and the present ice velocity of 15 m a-1. Flowing water could be observed in this subglacial channel. Small particles falling down from the borehole could be seen being carried away in the gap at a speed of 20 mms–1. This demonstrates how a clear debris-free ice layer forms from direct contact with water and not with till.
Debris content in basal ice
Since clear ice appears essentially dark in the images, because no light from the camera is reflected back, while debris in the ice appears as illuminated spots, the spectral brightness of each pixel in the images is some measure of debris present. By taking the average brightness of all video pixels in a line of the digital image and averaging over several lines, one obtains a relative measure of the debris content in this slice of ice. This works well at low concentrations where the debris is visible within the ice to a depth of ∼0.5 m from the borehole wall, while at higher concentrations the debris near the wall obscures the debris further away from the wall.
A calibration of the debris content is possible only in part by comparing the average brightness from the video pixels with the actual debris content in an ice core recovered in the same borehole from the same depth using a hot-water ice-corer (Reference Engelhardt, Kamb and BolseyEngelhardt and others, 2000). Figure 3 is a frame from the borehole video showing the debris in the ice at 1056.71 m depth, and Figure 4 shows a picture of an ice core taken from the same depth.

Fig. 4. Ice core with debris at same depth as in Figure 3. The ice-core diameter is 100 mm. The scale along the core is in inches.
Several slices of the ice core were cut and the actual debris concentration in it was measured by melting the ice and drying and weighing the debris. The brightness of the debris in the ice at the same depth could then be calibrated for actual debris content. In this way we obtain two points on our calibration curve, one for clear ice and one for relatively low debris content. We were unable to take an ice core with debris-rich ice; therefore we tentatively used the same calibration also for higher debris densities. The spectral brightness is not necessarily a linear function of debris content, but it is still a monotonic function, meaning higher brightness indicates higher debris content. Therefore at higher debris content, even if this procedure does not give an absolute measure of debris, it is still a relative measure of debris content. It clearly shows the variability and especially major transitions and also a lot of fine structure in the debris concentration. The overall debris content of the basal ice layer as reconstructed for site 3 is shown in Figure 5. The debris in basal ice of site 2 was published by Reference Christoffersen, Tulaczyk and BeharChristoffersen and others (2010).
Fig. 5. Reconstructed debris content per weight in basal ice versus depth below surface.
In order to make this plot readable, it was necessary to smooth out the extreme fluctuations by applying a moving average over 40 mm of depth. We find that the debris content varies over a wide range, sometimes abruptly within a few millimeters. Debris-rich layers can be in contact with clear and debris-free ice layers. Surprisingly, in 80–90% of the basal ice, the debris content is very low, only a few percent per weight. Only in distinct layers near the bottom does the concentration of debris rise to higher values of about 10–25%. In the basal ice of borehole 9, the debris content dropped to zero frequently above 1056.77m depth and an additional 16 times below; these transitions are not shown in Figure 5 because of the automatic smoothing process.
In the debris-concentration plot of Figure 5, at least five major events can be recognized, which separate four different flow regimes. It starts with the end of bubbly ice and the beginning of freeze-on of basal ice at 1053.06 m depth for borehole 9. At 1056.77 m depth an abrupt transition in debris concentration occurs. It stays generally high down to 1060.44 m, where it drops to a distinctly lower level. At 1062.56 m depth, a sharp spike in debris content marks the beginning of the most recent flow regime. At the lowest end of the record we see a 100 mm thick clear ice layer with 1.4 m deep water below. However, there are great variations and many abrupt fluctuations including clear ice layers within these regimes also.
The abrupt change in debris content for borehole 9 at 1056.77 m depth is shown in Figure 6. The debris-content profile in borehole 5 at site 2 is very similar, including the abrupt change in debris regime as shown in Figure 7 for 1212.20 m depth. All side-looking images are inverted vertically and their size is 40 mm × 60 mm.

Fig. 6. Abrupt debris-content change in the ice at 1056.77 m depth in borehole 9, taken with a video camera looking sideways into the ice from the borehole. The 40 mm × 60 mm image is inverted vertically, meaning the clear ice is above the debris.

Fig. 7. Abrupt debris content change in the ice at 1212.20m depth in borehole 5. Image is inverted as in Figure 6.
Above this depth, the debris clumps are suspended in the ice with very low debris content as shown in Figure 3 from 1056.71 m depth. Below 1056.77 m the debris is often much more concentrated up to 20-25%/wt with an occasional rock imbedded in the ice as shown in Figure 8 at 1057.26 m depth, and with a layer of 20 mm clear ice below.

Fig. 8. Below the transition at 1056.77 m in borehole 9, bigger rocks are embedded in ice; the image shows a smooth rock above a clear ice layer at 1057.26 m. The image is inverted as in Figure 6.
Texture of basal ice
The debris in the ice above the transition at 1056.77 m consists of mud clots, aggregates of mostly clay and some very fine sand grains, suspended in a matrix of clear ice. In polarized light a thin section from an ice core reveals that the mud clots are concentrated at grain boundaries (Fig. 9).

Fig. 9. Thin section of an ice core in polarized light. Diameter of ice disk is 100 mm. Mud clots concentrated on grain boundaries.
The clot sizes are 1–5mm in diameter. The composition of the mud clots was established by letting them melt on a Petri dish (Fig. 10). Assuming a concentration of 2.7 g cm–3 for rock materials, only about 24%/vol. is rock, the rest is interstitial ice.

Fig. 10. Typical thawed mud clot from the ice core shown in Figure 4.
The general impression is that in 80–90% of basal ice the debris content is of the order of a few percent per weight. There are layers, often narrow, that have locally higher debris content of the order of tens of percent, adjacent to debris-free clear ice layers. The spherical mud clots are not elongated and do not form bands of cloudy ice. Therefore deformation of the basal ice must be very limited, which indicates that the flow of the ice stream is mostly by basal sliding of the ice over a well water-lubricated bed and over several subglacial lakes at high water pressure, as is the case during glacier surges.
A melting event in an otherwise freeze-on regime could occur only if the basal thermal conditions changed such that the basal heat budget would change from freezing to melting, which could happen if the ice stream crossed an area of abnormally high geothermal flux, or the water flow was so vigorous that frictional heat changed the heat budget as in Rothlisberger channels (Reference RothlisbergerRothlisberger, 1972; Reference EngelhardtEngelhardt, 1978). Since this is very unlikely, we assume that the basal ice in most parts contains a unique record of a continuous history of freeze-on processes since it started. Melting could occur, if the ice thickened substantially, reversing the steep temperature gradient. This would require compressive flow, which seems to be incompatible with a low-friction bed under high water pressure. Since basal sliding is so well lubricated, we also assume that additional heat from friction and from deformation of the ice can be neglected. Reference Alley, Cuffey, Evenson, Strasser, Lawson and LarsonAlley and others (1997) describe several mechanisms for the formation of basal layers. The formation of ice lenses can have two explanations: one is from direct freeze-on, the other is by a secondary ice-segregation mechanism as frequently found in permafrost (Reference O’Neill and MillerO’Neill and Miller, 1982, Reference O’Neill and Miller1985; Reference Rempel, Wettlaufer and WorsterRempel and others, 2004, Reference Rempel, Wettlaufer, Worster and Christoffersen2007; Reference Christoffersen, Tulaczyk, Carsey and BeharChristoffersen and others, 2006).
From a qualitative assessment of the images acquired by the video cameras in KIS, several facies can be discerned in the basal ice. The basal ice itself is identified by the departure from bubbly meteoritic ice to generally clear ice. At greater depth, the descending cameras detected smaller bubbles in the ice, but we do not expect a transition to a gas-hydrate clathrate phase to be stable at the pressure and temperature conditions at the base of KIS. We see an abrupt transition to accreted ice. In addition, the low air content in the ice clearly identifies the basal ice as being derived from freeze-on processes.
Immediately below the bubbly ice, a clear ice zone starts in which usually, but not always, the first debris is incorporated. This debris is uniformly distributed and suspended in a matrix of very clear ice. The concentration of this debris is often extremely low, <1%. And, from ice cores of the same depth, we established that the apparent particles are, in reality, mud clots. This low-debris zone of 3.64 m thickness from depth count 1053.06 to 1056.77 m in borehole 9 does not show any layering or separate clear ice lenses (Fig. 3).
The borehole wall is very smooth without any clasts sticking out from it (Fig. 11). This suggests that during the accretion process the ice was not in direct contact with its till bed but sliding over a water-filled gap or subglacial lake with some suspended mud that was occasionally entrapped at grain boundaries while any impurities, including mud particles, were expelled by fractionation from the clear ice matrix. It is generally impossible to make homogeneously muddy or cloudy ice by a slow freeze-on process from muddy water. The tendency to expel foreign substance, even macroscopic particles, from a freezing ice front is very efficient. However, occasionally a pocket of foreign particles, a mud clot, can be captured at grain boundaries. Assuming the present freeze-on rate of 6.5–9 mma–1, calculated above, we conclude that over a period of about 200–400 years the ice stream was sliding over a well-lubricated bed at high water pressure. During this period, we infer that no tectonic processes thickened or thinned the basal ice, because no basal debris was incorporated. In the basal-ice column below 1056.77 m, we suspect that at least 16 totally clear ice layers can be identified. An example is shown in Figure 8. The ice stream flowing over water channels or subglacial lakes seems to be a common occurrence (Reference Fricker, Scambos, Bindschadler and PadmanFricker and others, 2007). Since no clasts of bigger rock can be frozen-on during these episodes, the water-filled gap has to be bigger than any rock size in the till. It is also possible that subglacial lakes occasionally drain (e.g. Reference Fricker and ScambosFricker and Scambos, 2009), letting the ice temporarily settle or touch its bed, creating a thin layer of embedded debris (Fig. 12).
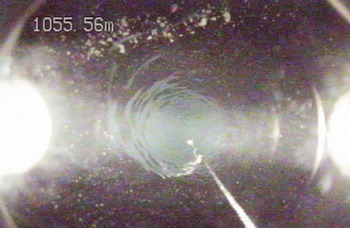
Fig. 11. Down-hole-looking image with smooth borehole wall, but embedded debris in the ice from 1055.56 m depth. Chain hanging from the camera has markers at distances of 25 and 50cm.

Fig. 12. Thin layer of concentrated debris next to mostly clear ice at 1063.12 m depth.
Overall, in the absence of tectonic thickening of the ice seen in the boreholes, the amount of water under ice streams must be substantial. A 50–100km wide and 1000 km long ice stream with a frozen-on basal ice layer of 10m would require 450–900 km3 of water. This water needs to originate upstream in areas of high geothermal flux or volcanic activity (Reference Blankenship, Bell, Hodge, Brozena, Behrendt and FinnBlankenship and others, 1993; Reference EngelhardtEngelhardt, 2004a). A small amount up to 3% of ash is found in basal debris (Reference Kamb, Alley and BindschadlerKamb, 2001), also indicating previous volcanic activity. High sliding speeds over an almost frictionless bed cannot produce water under simultaneous freeze-on conditions. High sliding velocities are also changing the basal hydraulic system by destroying any existing water channels and creating a more sheet-like water flow system (Reference KambKamb and others, 1985; Reference KambKamb, 1987, Reference Kamb, Alley and Bindschadler2001).
In several areas of the basal ice (e.g. around 1057.49 m) we encounter finely laminated, wispy ice with tiny sub-millimeter mud balls as shown in Figure 13. This might be the case where water flows along an upward-sloping bed. The water is being depressurized and thus supercooled and consequently forms ice platelets that accrete in an oriented manner to form the thin laminations with some entrapped mud (Reference Alley, Lawson, Evenson, Strasser and LarsonAlley and others, 1998; Reference Lawson, Strasser, Evenson, Alley, Larson and ArconeLawson and others, 1998). The interstitial ice is transparent, showing that during freeze-in the segregation process of ice and mud particles is still working even in this special environment of accretion. This is certainly the case for one branch of KIS that connects to the deep Bentley Subglacial Trench, and also along overdeepen-ings in the bed, which are often found under glaciers. The ice platelet or frazil ice accretion mechanism also provides an explanation for the existence of a 10 m layer of ice in boreholes 3 and 5 below the first occurrence of some debris in the ice. This layer of ice looks almost like the bubbly ice above, but under careful examination it sometimes contains fine laminations and episodes of very clear ice layers. In borehole 9, no upper layer with debris is found, but the existence of a layer from accreted platelets is likely. The formation of frazil ice is quite common wherever cold water becomes depressurized and supercooled. An extreme example is found under the Ronne Ice Shelf where up to 150 m of this type of ice has been accreted (Reference Engelhardt and DetermannEngelhardt and Determann, 1987).

Fig. 13. Finely laminated, wispy frazil ice accreted from supercooled water.
The first distinct horizontal layers of debris (Figs 6 and 7) appear 6.5 m above the bottom of the ice, followed by an irregular sequence of other debris and clear ice layers. From this point downward, embedded rocks stick out from the borehole wall (Fig. 14). These rocks often but not always have a smooth rounded surface, indicating that most of them are derived from fluvial action and not crushed as is usually found in basal till. The rock in Figure 8, about 8 mm across, shows a surface where the front mud coating was blasted away by the hot-water jet.

Fig. 14. Elevated debris content, with rocks sticking out from a rough borehole wall.
The biggest rock found in the whole borehole is 40 mm × 60 mm across and is shown in Figures 15 and 16. The rock is partially embedded in the borehole wall. It has a smooth surface with a shiny multicolored coating that could not be washed away by the water jet. This surface appears quite different from a freshly broken angular surface, indicating that it was possibly formed by fluvial action and may have been altered chemically or even biologically (Reference LanoilLanoil and others, 2009). The rock is surrounded by a matrix of clear ice with much smaller mm-size particle inclusions.

Fig. 15. Large smooth rock partly embedded in rough borehole wall 1 m above base of ice.

Fig. 16. Close-up of large smooth rock visible in Figure 15. The rock/ice-wall transition is visible as a faint line at left.
About 1 m from the bottom of the ice, the debris content increases and the layering becomes more pronounced. We see heavy sedimentation in laminae with clear ice (Fig. 17). Assuming our interpretation above is correct, this part of the basal debris was incorporated after KIS slowed down. However, in borehole 9, a clear ice layer 100 mm thick existed at the very bottom (Fig. 18). Because of the slow freeze-on process and ongoing recrystallization, the single crystals in the basal layer are large, of the order of 10100 mm, sometimes 500 mm (Fig. 19). The bottom ice surface is very smooth, with no rocks imbedded. Borehole 9 had 1.4 m deep water underneath with some suspended material that moved sideways at a speed of ∼20mms–1.
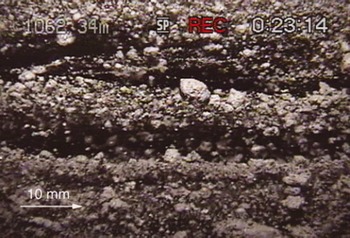
Fig. 17. Debris layers 1 m above base of ice, accreted after slowdown of KIS.
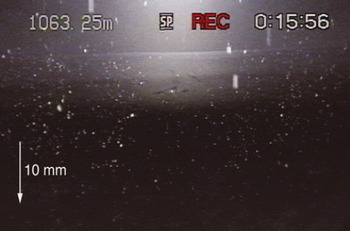
Fig. 18. Clear basal ice with sharp lower ice edge. Picture is upside-down, with slightly turbid water at the top of the image (below the ice).

Fig. 19. Looking from below onto the base of the ice with grain boundaries visible. Picture upside-down. Slight turbidity in the water backscatters light. The contrast in this image has been enhanced digitally.
An ice layer is bordered on the upper side by a layer with coarser debris and below by frazil ice that consists of streaks of fine-grained ice with some mud inclusions in a mm-scale net-like pattern (Fig. 20). Only a few large clasts or mud clumps larger than 5 mm could be observed.

Fig. 20. Laminated frazil ice bordering clear ice lens.
Many clear ice lenses appear to be totally clear and free of debris. Flowing water with finely dispersed suspended material is found under several boreholes. All boreholes on KIS outside the sticky spot and off the Engelhardt Ridge connected readily to a well-developed basal hydraulic system showing the abundant presence and the recharging of water. It is remarkable that the hydraulic condition found under KIS is similar to the hydraulic system found under currently much faster-flowing active Whillans Ice Stream and Bindschadler Ice Stream (Reference Engelhardt and KambEngelhardt and Kamb, 1997; Reference Kamb, Alley and BindschadlerKamb, 2001).
Interpretation and Discussion
In the debris-concentration plot (Fig. 5), at least five major events can be recognized, which separate four different flow regimes. The plot starts with the end of bubbly ice and the beginning of freeze-on of basal ice at 1053.06m depth for borehole 9. Over 3.64 m, from the upper end of the basal ice at 1053.06–1056.77 m depth, the debris content stays extremely low. At 1057.77m depth, an abrupt jump in debris concentration occurs. The concentration stays on a generally high level for 2.67 m until 1060.44 m where it drops to a distinctly lower level for 2.11m. At 1062.56 m depth, a sharp spike in debris content marks the beginning of the most recent flow regime reached, which may correspond to the KIS slowdown 150 years ago. Since then the debris content has gradually decreased to zero. The lowest 100 mm of basal ice is practically debris-free again, because the ice was moving over a channel or lake. The bottom of the ice is reached at 1063.29m depth with a 1.4m deep water channel below. The 740 mm accreted during the last 150 years corresponds to a freeze-on rate of 5mma–1.
There is great variability and many abrupt fluctuations, but also a great deal of fine structure within the debris layers, including clear ice layers within these regimes. This suggests a complex history of interactions of the base of the ice with its bed and reveals a delicate balance of the basal water pressure at or near the ice overburden pressure.
The early record in the frozen-on basal ice shows that flowing water existed under the ice and was deep enough to prevent the ice from touching its bed and picking up rocks of any size. Instead we find that some turbidity in the basal water is manifest in isolated mud clots accreted at grain boundaries on the freezing front. This could have been a period of fast extending ice flow, creating a steep temperature gradient in the ice. A previous bottom-melting event from volcanic activity could also have melted the warmer ice at the base and brought colder ice closer to the base, steepening the temperature gradient. Fast ice flow can destroy any efficient drainage channels for the water to escape, keeping the water pressure high. The frequent formation of frazil ice may also restrict the water flow in some places, contributing to the retention of water at high pressure. This period of fast flow or surge may also be manifest in the relatively thick ice on the Ross Ice Shelf, as discovered with early radio-echo observations by Reference Rignot, Mouginot and ScheuchlRobin and others (1970) and verified by Reference Shabtaie and BentleyShabtaie and Bentley (1987) and Reference Fahnestock, Scambos, Bindschadler and KvaranFahnestock and others (2000), and in the relict shear margins and internal features described by Reference Catania, Conway, Raymond and ScambosCatania and others (2005). The end of this period is marked by a sharp increase in debris content, including rocks, in the basal ice. This abrupt change in the concentration of debris in basal ice may have been caused by a loss of water, possibly an outburst flood, leading to a slowdown of KIS. Depending on what freeze-on rate can be assumed, this might have occurred 500–600 years ago. The base of the ice more often comes into direct contact with the bed, allowing for denser debris to be picked up, but also shows frequent clear ice where the ice was lifted off the bed or moved onto a subglacial lake, indicating a subglacial hydraulic system undergoing frequent changes (Reference Fricker and ScambosFricker and Scambos, 2009). Often encountered fine structure within the debris layers reveals a delicate balance of water pressure fluctuating near the ice overburden pressure as observed in most boreholes drilled on ice streams (Reference Engelhardt and KambEngelhardt and Kamb, 1997). The surface topography of KIS shows flat regions, which Reference Rignot, Mouginot and ScheuchlRobin and others (1970) characterized as pseudo ice shelves, alternating with sloping surfaces due to grounding of ice. The debris concentration dropped to a lower level 150–200 years later. This must have caused a speed-up, again resembling a surge mode with heavy crevassing. Finally, 150 years ago, a sharp spike in the debris content may indicate the termination of the fast motion regime. Since then, KIS in the lower reaches has no longer been in surge mode. The ice stream slowed to the present speed probably by substantial loss of water in an outburst flood that is generally observed in surge glaciers at the termination of their surges (Reference KambKamb and others, 1985). The debris content in the ice also fluctuates thereafter. Water lost under KIS may have spilled over to Whillans Ice Stream in an act of water piracy (Reference Alley, Anandakrishnan, Bentley and LordAlley and others, 1994; Reference Conway, Catania, Raymond, Scambos, Engelhardt and GadesConway and others, 2002). However, the water supply under the ice stream is still high and ubiquitous and a new build-up of water pressure is lifting the ice off the bed, again allowing clear ice to freeze-on at the very bottom.
Obviously a large amount of water is still or again present under KIS, despite the fact that at its base the ice stream has been in freeze-on mode for several hundred years. Under these conditions, water production by basal friction or deformation is excluded. Therefore we conclude that a huge source and reservoir of water lubricated the fast flow of KIS. Presently, the flow speed of KIS in the lower trunk region towards the grounding line is so low that we can assume that it is frozen to the bed, similar to the situation at the sticky spot (Reference Rignot, Mouginot and ScheuchlRignot and others, 2011).
Large frozen areas at the bed could efficiently restrict the drainage system and could keep the water at high pressure upstream, as observed at most boreholes on KIS. KIS is not fully dormant. In its upper reaches it still flows at a speed of 60–120ma–1, and convergence with the slower ice downstream is creating an ice bulge with thickening rates of 0.55ma–1 (Reference Price, Bindschadler, Hulbe and JoughinPrice and others, 2001; Reference Joughin and TulaczykJoughin and Tulaczyk, 2002). Moving ice bulges often form on surge glaciers, separating the activated from the dormant part of the glacier.
KIS has typical characteristics of surging: high flow velocities in the past, a large accumulation area, extensive water supply and storage for basal lubrication, predominant basal sliding, a stop-and-go behavior, and presently a restricted drainage system in the lower reaches near the grounding line.
Conclusions
The freeze-on layers in the basal ice of KIS reveal a complex history of ice flow and ice/bed interaction. Four different flow regimes can be recognized, but also a great variability of debris concentration and many episodes of clear ice-layer formation. We infer that the base of KIS frequently slides over a sheet of water or subglacial lakes. The composition of the freeze-on layers is a measure of the basal water pressure and of how close and how long the contact is with the till bed. Periods of fast flow are interrupted by periods of slower motion marked by heavier debris concentrations in the basal ice layers.
If the water depth is sufficient, freeze-on results in clear ice, because turbidity or sediment load in the water is low. A shallower water sheet flow under the ice is more vigorous and can be turbid. Some debris from turbid water is entrained, mostly as mud clots at grain boundaries.
In all boreholes where the ice was not frozen to the bed, we know that the basal water pressure was at or very near the ice overburden pressure, because on reaching the bed the freshly drilled boreholes made instant contact with the basal hydraulic system. Plenty of water seems to be available under the ice streams. Even under KIS, which presently is not streaming fast, a large amount of water is available and ice is accumulating. Because the lower reaches of KIS towards the grounding line are moving very slowly, they are likely to be frozen to the bed, effectively restricting or even blocking the drainage system of KIS.
Under these conditions KIS seems to be set up for the next surge (Reference Catania, Conway, Gades, Raymond and EngelhardtCatania and others, 2003). When this happens KIS may contribute to the disintegration of the WAIS, which has occurred in the past (Reference Scherer, Aldahan, Tulaczyk, Possnert, Engelhardt and KambScherer and others, 1998) and which, especially under present scenarios in a warming climate, can be expected to happen again, with potential sea-level rise of 3–6 m (Reference Alley, Bindschadler, Alley and BindschadlerAlley and Bindschadler, 2001; Reference ThomasThomas and others, 2004; Reference Bamber, Riva, Vermeersen and LeBrocqBamber and others, 2009).
Acknowledgements (By H.E.)
The results presented here are based on a research program initiated by the visionary Barclay Kamb, who persisted in studying the basal conditions of fast-moving glaciers and ice streams in situ. I am extremely grateful for his keen interest and constant support. I am very grateful to our field assistants, who showed great enthusiasm and unrelenting dedication even under demanding circumstances. The 2000/ 01 drilling team included Shulamit Gordon, Matt Bach-mann, Daniel Abrams, Stefan Vogel, Regina Sterr, Kate Batten, Michele Koppes and Robin Bolsey. The JPL/Caltech camera design team also included Frank Carsey, Lonne Lane, Robert Ivlev, Ken Manatt, Kobie Boykins, Jason Feldman, Fabien Nicaise, Kai Zhu and Alberto Behar. Alberto Behar was also crucial for the video image acquisition. Bjorn Johns of the University Navstar Consortium (UNAVCO) helped with the precision GPS measurements. The comments of my reviewers and editors greatly improved the paper. I also appreciate the help of a great number of support people, especially my late wife Luise Engelhardt. The US National Science Foundation Office of Polar Programs funded this work under grant OPP-9615420.


