


1. Introduction
In recent years, increasing attention has been paid to the compressive strength of ice when external loads are applied perpendicular to ice sheets, for example the penetration of a submarine from ice-covered water or the landing of a space shuttle on an icy planet (Carney and others, Reference Carney, Benson, Dubois and Lee2006; Ivanov and others, Reference Ivanov, Prockter and Dalton2011). The columnar structure of sea ice makes it behave mechanically anisotropic (Petrich and Eicken, Reference Petrich, Eicken, Thomas and Dieckmann2010).
Normally, the strength of columnar ice is three to five times greater under vertical loading than under horizontal loading (Timco and Frederking, Reference Timco and Frederking1986; Høyland and others, Reference Høyland, Bjerkås and Vernyayev2004; Moslet, Reference Moslet2007; Shafrova and Høyland, Reference Shafrova and Høyland2008; Timco and Weeks, Reference Timco and Weeks2010). Gao and others (Reference Gao, Zhao and Yao2010) suggested that the loading direction may lead to the different failure modes and consequently anisotropic behaviors. It has been established that the yield stress is sensitive to the loading direction in polycrystalline materials when the crystal orientation is considered (Renshaw and others, Reference Renshaw, Golding and Schulson2014). Nevertheless, especially for sea ice, very little is known about the mechanism behind the failure process induced by the loading direction. From the view of material behavior, the results have shown that the ice responds with instantaneous elastic, delayed elastic and viscous deformations (Sinha, Reference Sinha1978). The strain rate is one of the key parameters in determining these rheological behaviors (Sinha, Reference Sinha1982, Reference Sinha1988; Petrovic, Reference Petrovic2003). These characteristics may cause sea ice to fail in a brittle manner under high loading rates. Similar to rock materials, the mechanism of the brittle failure of sea ice has been investigated extensively (Ashby and Hallam, Reference Ashby and Hallam1986; Schulson, Reference Schulson2001).
Under the uniaxial compression, the sea ice can fail in ductile or brittle mode under various strain rates. In the ductile mode, the stress decreases gently after reaching the maximum value and no strong fracture appears. On the other hand, the stress shows a sudden drop when ice fails in brittle mode and ice fractures can be observed in the specimen. For the sea ice formed under the same conditions or collected from one ice sheet, its failure mode may vary from a ductile manner to brittle manner when raising the strain rate to a critical level. The failure mode of sea ice can transfer between ductile and brittle at a certain strain rate. This strain rate is commonly called as brittle-to-ductile transition (hereafter referred to as D/B transition) rate. It is very vital since the ice compressive strength usually reaches its maximum value and becomes a key design parameter for offshore engineering in cold regions.
The D/B transition can be understood as a competition between the stress concentration relaxation and the propagation of cracks. The relaxation can be explained by the grain boundary sliding induced by the creep performance (Liu and others, Reference Liu, Baker and Dudley1995). The confinement can increase the overall compressive strength and change the D/B transition by suppressing the stress concentration (Schulson and Buck, Reference Schulson and Buck1995; Iliescu and Schulson, Reference Iliescu and Schulson2004). Picu and Gupta (Reference Picu and Gupta1995a, Reference Picu and Gupta1995b) argued that crack nucleation is initiated from internal flaws in saline ice rather than the grain boundary sliding in freshwater ice as a result of the brine inclusion. Therefore, the transition is influenced by both the porosity and the confinement (Li and others, Reference Li, Zhang, Lu, Leppäranta and Li2011). Based on split Hopkinson pressure bar tests, Jones (Reference Jones1997) and Kim and Keune (Reference Kim and Keune2007) suggested that the ice strength increases significantly under an impact strain rate (10−1 to 103 s−1). Unfortunately, details of the failure process were not further investigated owing to instrumental limitations. Using a high-speed camera, Carney and others (Reference Carney, Benson, Dubois and Lee2006) succeeded in recording the contact process and observing local fracturing in an ice sample. Recently, Lian and others (Reference Lian, Ouyang, Zhao, Liu and Qi2017) measured the deformation during the failure process with a digital method. Both tests showed that the damage of ice crystals might be the reason behind the high strength. Previous studies have noted that the compressive strength and stress–strain relationship are highly sensitive to the failure modes. Although the ice is stronger when loading vertically, a few fielding experiments have been performed and very little attention has been paid to the failure mode transition in this loading direction (Sinha, Reference Sinha1983).
In this study, uniaxial compressive tests of sea ice were carried out in the Bohai Sea. Both vertical and horizontal loadings were applied to the sea-ice samples. This study has two primary aims: one is to investigate the influence of the loading direction on the failure mode and compressive strength, which is represented by the maximum compressive force over initial cross area; and the second is to ascertain the change in the D/B transition under various loading directions.
2. Field tests of the uniaxial compression of sea ice
The thermodynamic and dynamic conditions of sea ice vary depending on the location, and its mechanical properties also vary based on the environmental conditions. In this study, field experiments were carried out in the northeast area of the Bohai Sea (as shown in Fig. 1), where the ice season usually lasts for 3 months every winter. The surface seawater was measured to have a salinity of 33.2 ± 0.3 ppt, which is higher than the average value for the Bohai Sea (28–30 ppt) (Yang, Reference Yang2000). The selected area had a strong semidiurnal tide in February of 2018. Thus, the sea ice was expected to exhibit an S3 structure (columnar ice with a preferred c-axis orientation) (Michel and Ramseier, Reference Michel and Ramseier1971).

Fig. 1. Field site for the uniaxial compressive tests of sea ice in the Bohai Sea. This figure is generated from a satellite image. The sea-ice extension is marked with yellow arrow; some offshore platforms are marked with red dots; entrance of the Yellow River, Dalian and Tianjin are marked with yellow dots.
The testing program was performed in the winter season of 2018 in the Bohai Sea (at the beginning of February). Normally, the ice collection procedure is dependent on the location and ice condition. For instance, on thick ice (e.g. Svalbard area, Beaufort Sea), it is more convenient to obtain samples for vertical loading with mechanical drills. On the other hand, it is more productive to collect samples for horizontal loading by directly sawing them from the ice sheets. In this study, 1.0 m × 1.5 m ice plates were first cut from the level ice, which had a thickness of 22 ± 2 cm. The plates were then cut to 107 mm × 50 mm × 50 mm samples. Analysis of thin sections showed that the ice had a typical columnar structure with a grain diameter of 0.8–1.5 cm, as shown in Figure 2. The length and width are about ten and five times of grain diameter, so we assume the size effect is not critical in these experiments.

Fig. 2. Thin sections of the level ice viewed under polarized light: (a) overall sketch of level ice, (b) texture of ice samples, (c) grain structure of an ice sample under vertical loading and (d) grain structure of an ice sample under horizontal loading.
The microstructure (e.g. column size) and physical properties (e.g. brine volume and salinity) of sea ice depends on the temperature history during the growth period (Weeks and Ackley, Reference Weeks and Ackley1986). In addition, the air temperature history determines the ice temperature profile and does as such influence the in situ measurements of compressive strength (Timco and Weeks, Reference Timco and Weeks2010). The air temperature from the frazil ice formation (27 January) until the end of the fieldwork (6 February) is plotted in Figure 3a. The sea-ice temperature may be the most difficult parameter to control during field tests because it changes as soon as the sea-ice samples are removed from the ocean water. Some researchers prefer to test immediately after drilling, when the samples may still retain their temperature gradient (Høyland and others, Reference Høyland, Bjerkås and Vernyayev2004; Moslet, Reference Moslet2007; Shafrova and Høyland, Reference Shafrova and Høyland2008). In this study, we allowed the ice to reach an equilibrium temperature with that of the ambient air, so that all specimens would be tested at the same temperature. The air temperature was stable before dawn (when the tests were performed) and there was little influence from radiation during the night. Therefore, all the samples were collected and machined after sunset and refrigerated overnight in the open air prior to testing. The temperature of the sea-ice samples was measured via a drilled core after each test. The samples had an average temperature of −16.5 °C and varied from −15 to −18.3 °C. The weight and volume of ice samples were measured and the density is calculated with value from 878 to 906 kg m−3. Following the equations by Cox and Weeks (Reference Cox and Weeks1983), the total porosity is from 36 to 42‰.

Fig. 3. Air temperature and salinity of sea ice in the field experiments: (a) air temperature history during fieldwork and (b) salinity profile of level ice.
The salinity profile of level ice followed a typical ‘C’ shape and varied from 4.3 to 9.2 ppt, as shown in Figure 3b. The samples used for testing were collected from the central layer of the level ice and had salinities of between 5.5 and 7.4 ppt.
In the field tests, we applied a portable loading system which is supported by a serve motor with mild capacity. The motor provides a loading speed range (10−3 to 0.8 mm s−1) wider than that of a regular converter motor; however, this range is narrower than that of the motors typically used in indoor laboratories (usually greater than five orders of magnitude). The final sample size was actually half that of those in the pre-tests, so that the transition rate was covered in the tested strain rate range. In each test, the platen displacement and compressive load were measured simultaneously with potential meter and strain gage. The data sampling rate was 300 Hz for both load and displacement. Meanwhile, the failure processes of the sea-ice samples were also videotaped.
The average deformation is expressed by the ratio between the platen displacement and initial sample length, and can be written as

where ɛ nom is the nominal strain; d is the platen displacement and L i is the initial height of sea-ice sample.
Here, we can define the nominal strain rate as

where $\dot{\varepsilon }_{{\rm nom}}$ is the nominal strain rate and v is the moving speed of platen.
The nominal strain rate is the ratio between platen moving speed and initial sample length. Without installing a displacement transducer on the sea-ice specimen, the field experiment can be finished in a short period. Under this situation, the temperature of sea-ice sample can be relatively consistent during one test. However, this simplification leads to some errors, and we will discuss it with details in Section 5.4.
3. Experimental results for the uniaxial compressive strength of sea ice
In the field experiments on the uniaxial compressive strength of sea ice, the nominal strain rates were varied from 10−5 to 10−2 s−1 for both loading directions (vertical and horizontal). At low nominal strain rates, the loading process is relatively stable, and three repetitions were performed for each nominal strain rate. The failure process became more random at high nominal strain rates, and thus the tests were repeated five to six times in this range.
Figure 4 shows the stress–strain diagrams of sea ice during uniaxial compressive tests under various nominal strain rates in the vertical and horizontal loading directions. With an increasing nominal strain rate, a D/B transition can be clearly observed in both Figures 4a and b. At low nominal strain rates, the curves increase and decrease gently without any abrupt change. With a gradual increase in the nominal strain rate, the sea-ice sample exhibits brittle failure behavior. As indicated by the red arrow in Figure 4, the stress dropped to zero immediately upon brittle failure of the sample. At higher nominal strain rates, the stress curves exhibit multiple peaks, indicating multiple fractures in the sea-ice sample. In Figure 4, it can be seen that the uniaxial compressive strength of sea ice under vertical loading is much higher than that under horizontal loading. The maximum uniaxial compressive strength is 12 MPa under vertical loading, which is approximately three times that under horizontal loading. The transition rates are 5 × 10⁻⁴ s−1 under vertical loading and 3 × 10⁻³ s−1 under horizontal loading.

Fig. 4. Typical stress–strain curves under various nominal strain rates with different loading directions: (a) loading direction parallel to the grain columns (vertical loading) and (b) loading direction perpendicular to the grain columns (horizontal loading).
The stress–strain diagrams indicate that the compressive strength of sea ice is sensitive to the nominal strain rate. Thus, the relationship between the compressive strength and the nominal strain rate is plotted in Figure 5. The results show that the compressive strength is between 6.0 and 10.8 MPa under vertical loading and between 1.9 and 6.0 MPa under horizontal loading.

Fig. 5. Relationship between the compressive strength and nominal strain rates under different loading directions: (a) compressive strength of sea ice under vertical loading and (b) compressive strength of sea ice under horizontal loading.
Under both vertical and horizontal loadings, there is an obvious D/B transition when the nominal strain rate increases from 10−5 to 10−2 s−1. In the ductile failure zone, there is a positive correlation between the strength and nominal strain rate. The maximum compressive strength appears in the transition zone, where there is no clear relationship between the nominal strain rate and the compressive strength. In the brittle failure zone, the compressive strength is negatively correlated with the nominal strain rate. In addition, the results exhibit less scatter in the ductile regime than that in the brittle regime. This scatter will be discussed along with the failure modes of the sea-ice samples in Section 5.2. These results indicate that the failure mode of sea ice is dependent on the nominal strain rate. Furthermore, the transition nominal strain rate is influenced by the loading direction.
4. Failure process of sea Ice under uniaxial compression
In the compression tests under vertical and horizontal loading, the sea ice exhibits different nominal strain rates of D/B transition and compressive strengths. This section includes three subsections: ductile failure process, brittle failure process and D/B transition. Each subsection is further organized into two parts. The first part focuses on the phenomenon from observations and strain–stress curves. Based on the phenomenon, the second part follows the analysis of the mechanisms with sketches.
4.1 Ductile failure process at low nominal strain rates
To investigate the failure process of sea ice in the ductile mode under vertical and horizontal loading, Figures 6a–c and 6d–f show the failure processes of sea-ice samples under vertical and horizontal loading, respectively, at a strain rate of 9.3 × 10⁻⁵ s−1. The corresponding stress–strain curves are shown in Figure 6g.
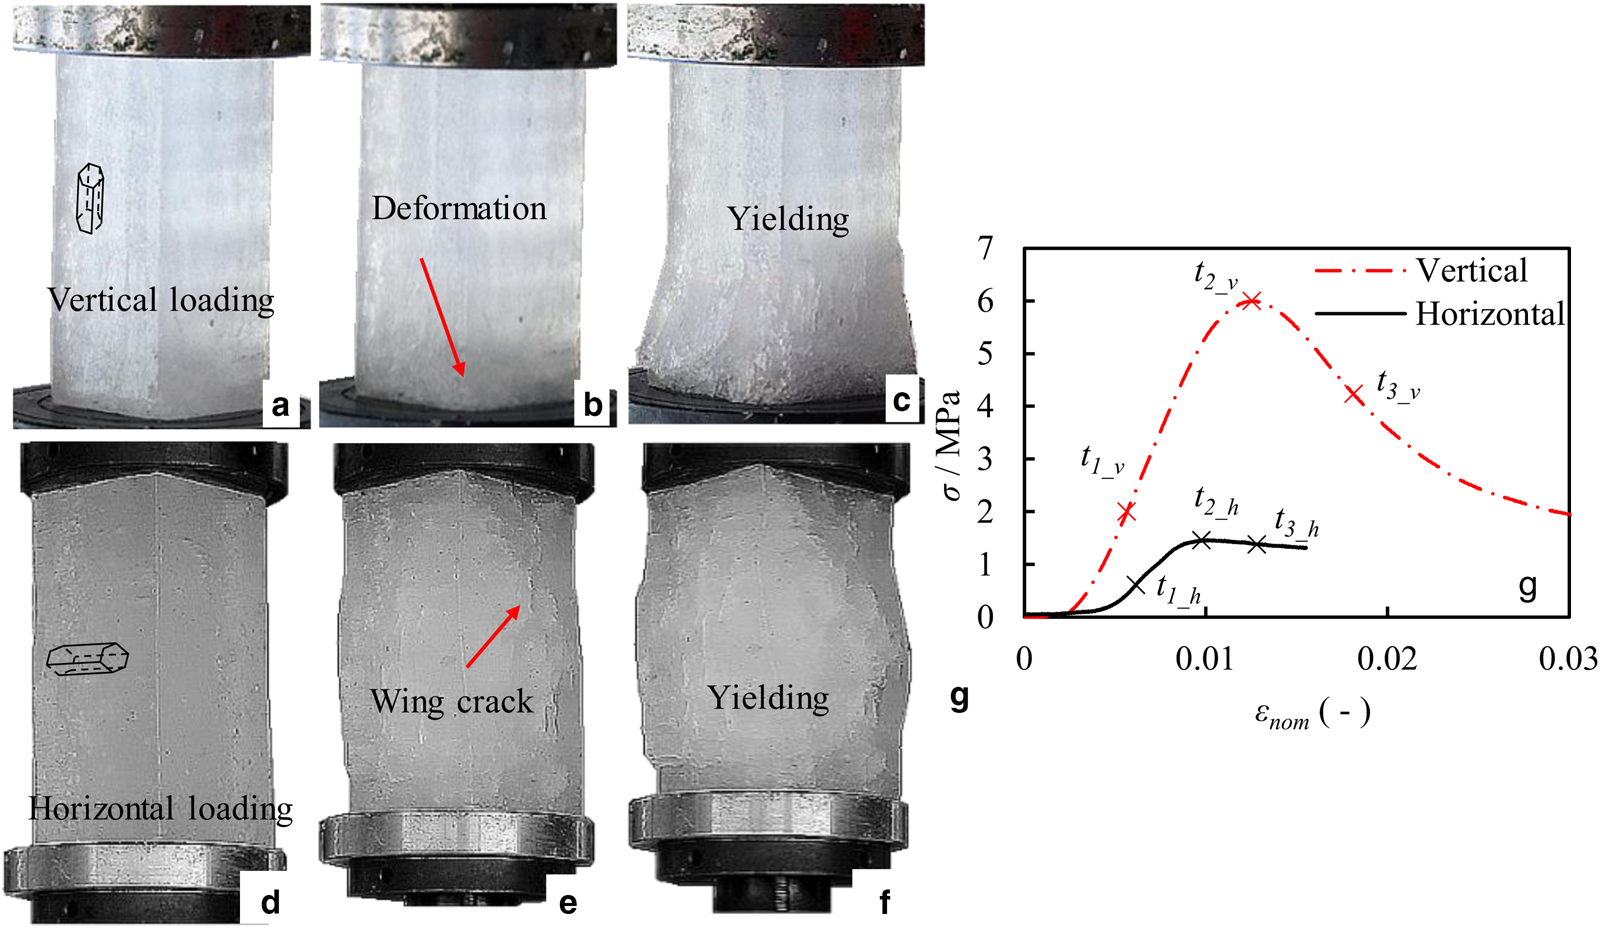
Fig. 6. Ductile failure processes of columnar ice under different loading directions (subscripts v and h indicate tests under vertical and horizontal loadings, respectively): (a) t = t 1_v, (b) t = t 2_v, (c) t = t 3_v, (d) t = t 1_h, (e) t = t 2_h, (f) t = t 3_h and (g) relationship between stress and strain under different loading directions.
At the beginning of the compression under vertical loading from t = t 1_v to t = t 2_v, deformation can be observed at the bottom of the sea-ice sample, as shown in Figures 6a and b. When the stress reaches its maximum value, the sea-ice sample is split and splayed outward at the ice–platen interface, as shown in Figure 6c. In contrast, there was very little change at the top of the sea-ice sample. Based on the internal salinity gradient (Fig. 3b), the bottom of the sea-ice sample is more porous than the top. Thus, the weaker bottom of the sample started to deform and yield under a lower load than the top of the sample. Note that the upper and lower plates are made of the same material, which means that the asymmetric deformation was not induced by friction. Therefore, this vertical heterogeneity is primarily a result of the salinity gradient. This behavior was also observed in laboratory tests conducted by Kuehn and Schulson (Reference Kuehn and Schulson1994).
Under horizontal loading, the sea-ice sample fails in a different manner. From t = t 1_h to t = t 2_h, the initial cracks due to brine pockets and air bubbles develop to form wing cracks, which can be directly observed on the sample surface, as shown in Figure 6e. With increasing loading, the wing cracks stop growing and start to open up (as shown in Fig. 6f). When the sea-ice sample yields, the middle portion of the sample is highly dilated. Figure 6g shows that the deformation at ice–platen surfaces is constrained by friction. This constraint may be not essential for the ductile process. However, it becomes critical in the brittle mode (Section 4.3).
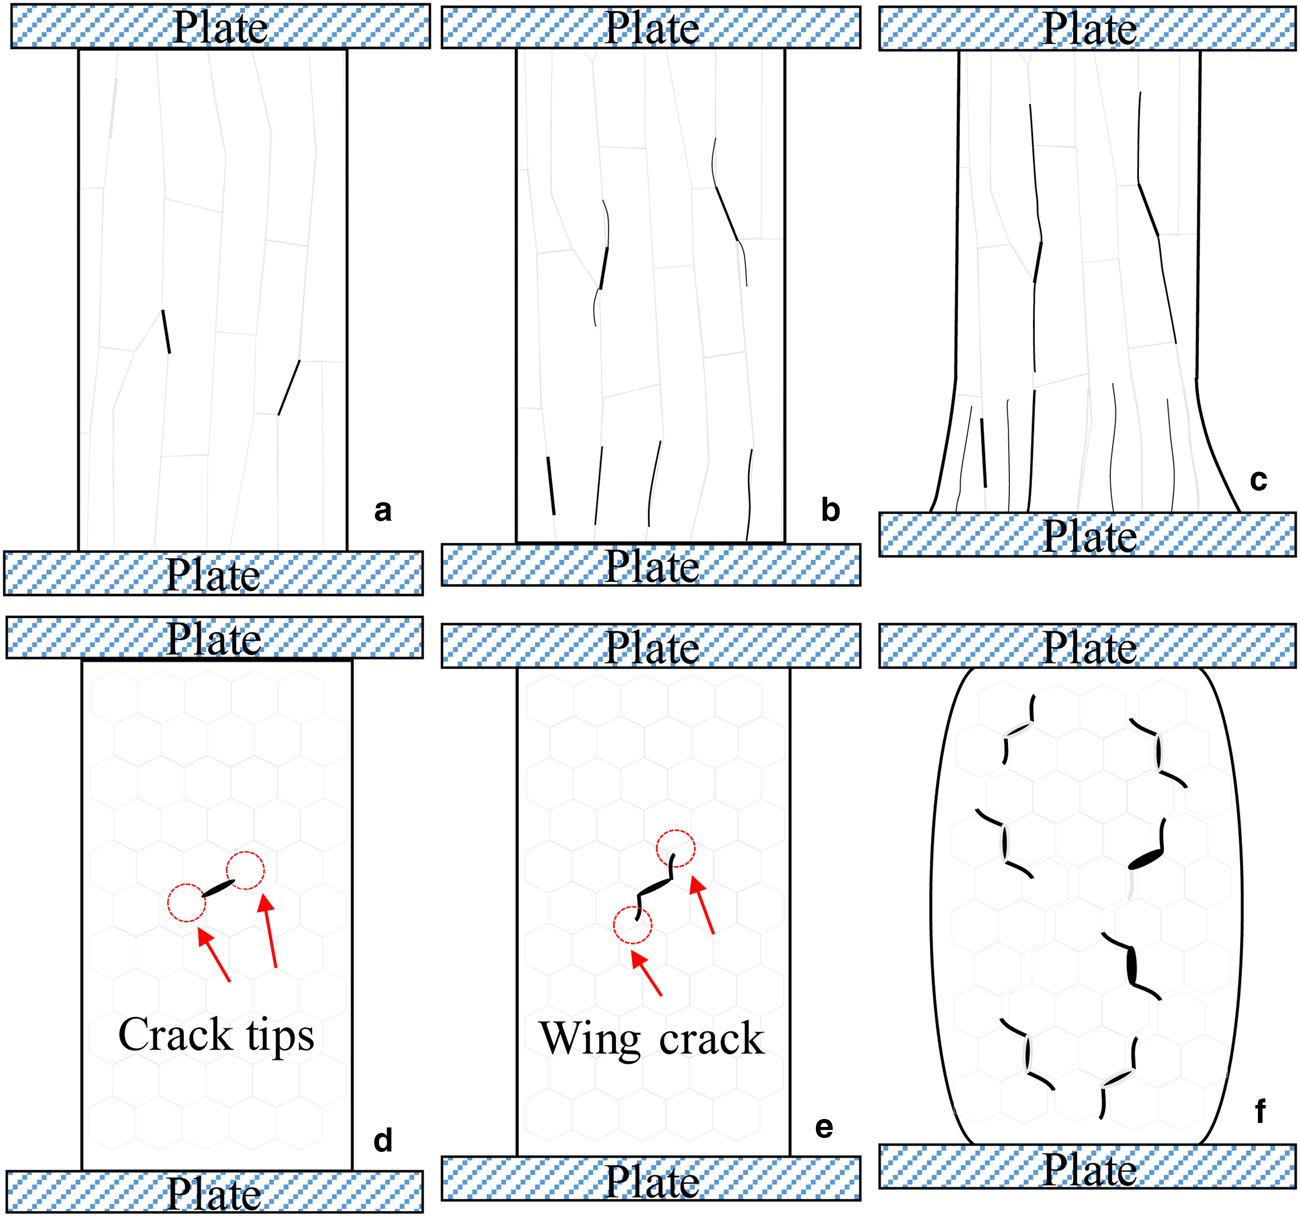
Based on the field observations, the mechanism of failure process can be obtained. Figure 7 shows sketches of the 2-D microstructure of the ice samples during the failure process corresponding to the experimental results in Figure 6. In these sketches, grains and cracks are represented in faded gray and black colors, respectively. Three stages can be identified during the yielding process. In the compressive tests under vertical loading, they are: (I) initial crack, (II) deformation and (III) yielding, where the stress decreases and the sample loses capacity. In the compressive tests under horizontal loading, they are: (I) initial crack, (II) wing crack and (III) yielding.

Fig. 7. Schematic of the ductile failure processes: (a–c) under vertical loading: (a) stage I: initial crack, (b) stage II: deformation and (c) stage III: yielding and (d–f) under horizontal loading: (d) stage I: initial crack, (e) stage II: wing crack and (f) stage III: yielding.
Sea ice exhibits a combination of mechanical behaviors, including elasticity, visco-elasticity, visco-plasticity, creep rupture and brittle behavior (Schulson, Reference Schulson2001). The natural sea ice contains brine inclusions and air bubbles. Once it carries a load, these inherent flaws are the preferred location for the formation of stress concentration and initial cracks, as indicated by the dark colored marks in Figure 7a and d. Thus, both failure processes begin with the formation of initial cracks (stage I). The cracks preferentially develop along grain boundaries (Smith and Schulson, Reference Smith and Schulson1994; Frost, Reference Frost2001; Gupta and Bergström, Reference Gupta and Bergström2002). Therefore, the relative directions between the load and the grain boundary result in different failure behaviors (stage II). When the load is applied parallel to the long axes of the columns, sliding along the grain boundary is suppressed, and the stresses act on the ice crystals. The deformation is a result of creep and grain decohesion (Figs 6c and 7c). On the other hand, loading perpendicular to the long axes of the grains results in many short paths between the grain boundaries. The stress concentration at the crack tips is released when the initial crack (from stage I) develops into a wing crack along the boundary (in stage II). In the final stage (stage III), the wing cracks stop developing and widen, as shown in Figures 6f and 7f.
Although both tests are terminated at ductile rupture, they follow different mechanisms. The sea-ice deformation under vertical and horizontal loadings is driven by crystal decohesion and grain boundary sliding, respectively. The decohesion is dependent on the normal strength of the freeze bond, while the shear strength of the freeze bond controls the grain boundary sliding. It seems possible that in the ice freeze bond, the normal strength is higher than the shear strength. Therefore, in the ductile-dominated process, the compressive strength is higher under vertical loading than under horizontal loading.
In the stress–strain relationship (red curve in Fig. 6g and curves of the ductile regime in Fig. 4a) under vertical loading, the descending arms of the curves are much sharper than those under horizontal loading (black curve in Fig. 6g and curves of the ductile regime in Fig. 4b). Under vertical loading, the force decreases as a consequence of the completion of decohesion. In contrast, under horizontal loading, boundary sliding proceeds throughout the tests, resulting in a gentle decrease. These results may further support the different yielding mechanisms induced by the loading direction. Another reason for this sharper drop might be the expansion of the ice at the bottom. Due to this deformation, the decrease of platen–sample friction also made contribution to the sharper drop.
4.2 Brittle-to-ductile transition of sea ice
The compression on sea ice leads to time-dependent deformation, which can be characterized by delayed elastic and viscous creep (Sinha, Reference Sinha1978). With an increase in the nominal strain rate to a moderate value, the time-dependent delayed elastic is limited. The ductile deformation becomes insufficient to relieve the stress concentration. The crack nucleates, and brittle behavior starts to dominate the failure process. Figures 6a–c and 6d–f show the failure processes under vertical (5 × 10⁻³ s−1) and horizontal (3 × 10⁻⁴ s−1) loadings, respectively. The corresponding stress–strain curves are given in Figure 6g. The transition nominal strain rate is lower under vertical loading than under horizontal loading.
In the compressive test under vertical loading, an initial crack (indicated by the arrow in Fig. 8a) appears in the central of the sample at the beginning of the test (t = t 1_v). This crack gradually grows along the loading axis and becomes a dominant crack (t = t 2_v). When the crack penetrates the sea-ice sample, the split halves suddenly become unstable and fail through buckling. In this test, the sample is catastrophically broken into pieces.

Fig. 8. Failure processes of the ductile-to-brittle transition: (a–c) under vertical loading: (a) initial crack (vertical crack), t = t 1_v, (b) vertical primary crack, t = t 2_v and (c) sample failure in buckling, t = t 3_v and (d–f) under horizontal loading: (d) initial crack (wing crack), t = t 1_h, (e) inclined primary crack, t = t 2_h, (f) sample failure in shear faulting, t = t 3_h and (g) the corresponding stress–strain diagram.
In the compressive test under horizontal loading, the damage is also initiated from a single crack (indicated by the arrow in Fig. 8d). Compared with the primary crack in the compressive test under vertical loading, the initial crack under horizontal loading grows at a certain angle (~30°) relative to the loading axis (Fig. 8b). At the end of the compressive test, the sea-ice sample fails through a shear faulting mode.
Through the observed ice behaviors, we further analyzed the ice failure process. In the tests under both vertical and horizontal loadings, the stresses increase during the crack development (t = t 1_v to t = t 2_v and t = t 1_h to t = t 2_h). In addition, the sudden decrease in the stress indicates that both samples fail in the brittle mode, as shown in Figure 8g. However, after reaching the maximum stress, there is a short pre-yielding period before the final collapse. This indicates that the ductile behavior still plays some role in the failure process. In fact, this loading speed provides an ideal condition in that the crack growth is just triggered. Thus, the crack can develop with stabilization through the ductile deformation. Therefore, the so-called D/B transition is indeed a brittle failure with a stable process of crack development.
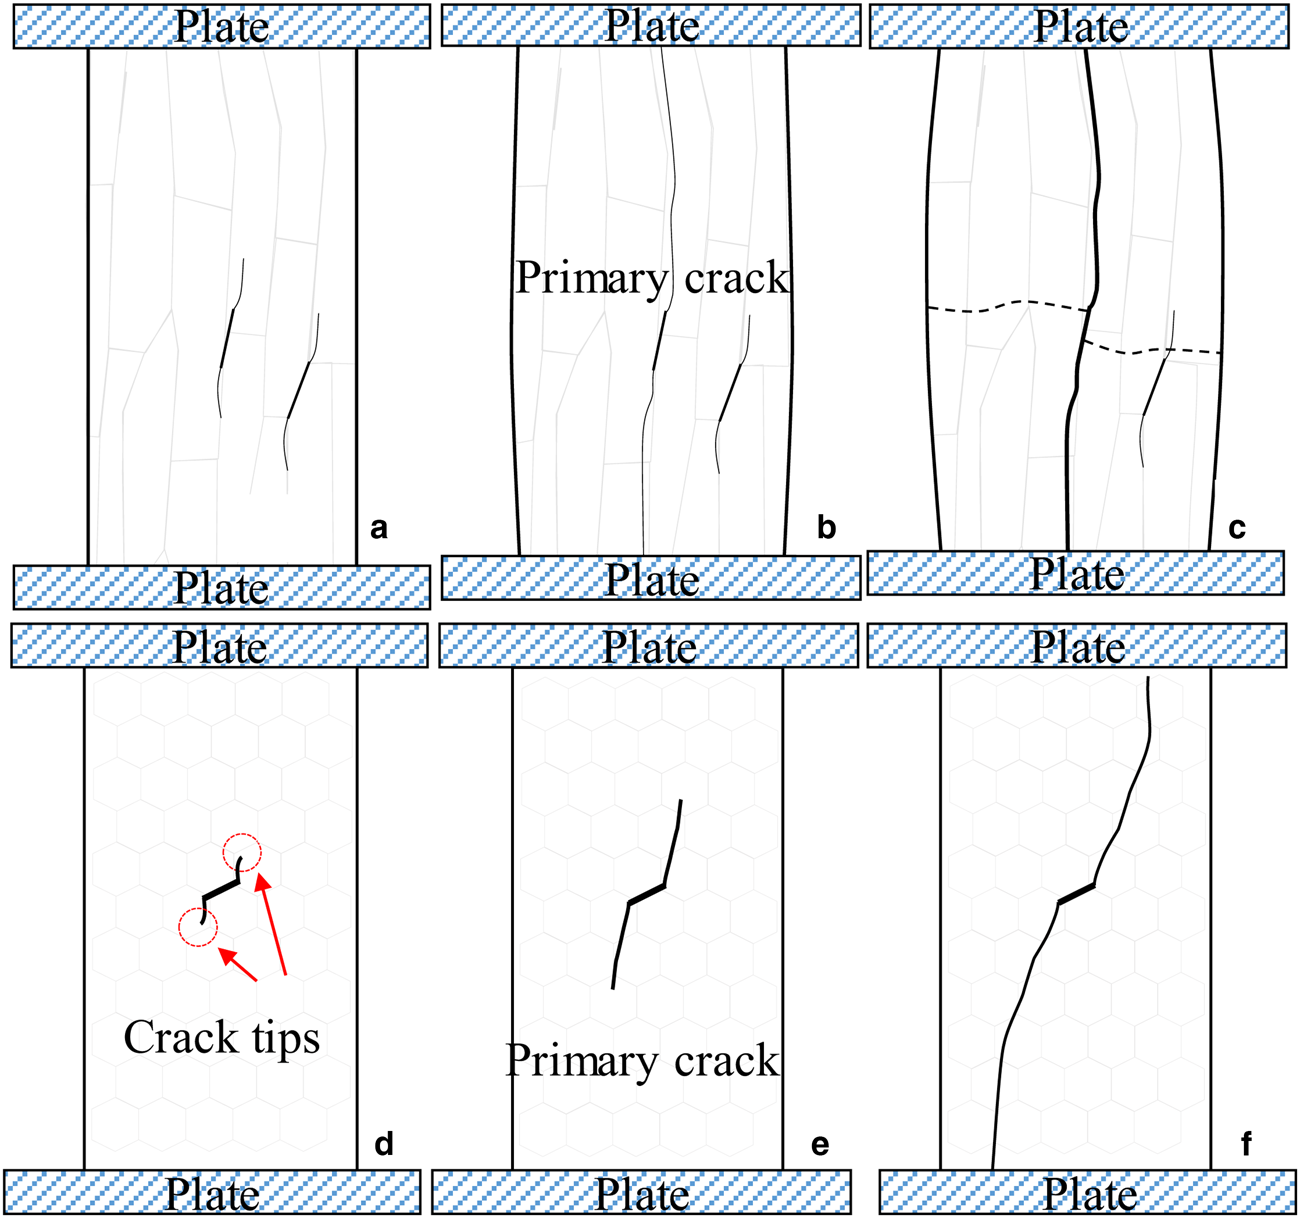
Based on the photos and the stress–strain diagram, the failure processes of the D/B transition are sketched in Figure 9. The beginning stage (stage I) is also initiated from the crack development, similar to the process in the ductile-dominated yielding. However, because the nominal strain rate is relatively high, the creep and plastic deformation are insufficient to relax the stress concentration at the crack tips. Thus, the initial crack grows if the loading is continued (stage II).

Fig. 9. Schematic of the failure process under the D/B transition: (a–c) under vertical loading: (a) stage I: initial crack, (b) stage II: primary crack and (c) stage III: buckling and (d–f) under horizontal loading: (d) stage I: wing crack, (e) stage II: primary crack and (f) stage III: faulting.
In the second stage, the relative direction between the loading axis and the grain orientation leads to different crack paths, as shown in Figures 9b and e. In the compression test under horizontal loading, the principal stress is transformed into shear stress, and the crack develops preferentially along the grain boundary (Fig. 9e). When the inclined cracks accumulate and form a primary crack through the sample, the sample fails through shear faulting (Fig. 9f). In contrast, the crack development through shearing is impeded by the column orientation in the compression tests under vertical loading. The crack grows vertically because the strength of the cohesion between grains is weaker than that of the crystals (Fig. 9b). Once the sea ice is split by a vertical crack, the two slender columns suddenly become unstable and fail through buckling.
In the D/B transition, although the ductile behavior plays some role, the final failure is still brittle. The failure mechanism is shearing along the grain boundary under horizontal loading, and buckling with crystal fracture under vertical loading. Apparently, there is a higher strength in the crystal bodies than the bonds between grains. Therefore, the compressive strength is higher under vertical loading than under horizontal loading.
As shown in Figure 5, the compressive strengths reach their maximum values under both loading directions in the D/B transition zone. We may approach this conclusion from two paths. On the one hand, at high loading speed the stress relaxation becomes less important than that under low loading speed. Thus the strength is higher than that with lower loading speed. On the other hand, in the D/B transition, the dominate crack is able to develop in a stable manner through the sample and split it into two large pieces. The single fracture leads to higher force peak than that in multiple peaks, which we will discuss in the next section.
4.3 Brittle failure process at high nominal strain rates
As discussed in Section 4.2, the fracture is stabilized by ductile behavior under a moderate nominal strain rate. With a higher nominal strain rate, this stabilization is weakened, and the failure process is dominated by pure brittle failure. As indicated previously, the stress–strain diagram displays multiple peaks at high nominal strain rates. This section will focus on the failure process of compressive tests at a nominal strain rate of 7.5 × 10⁻³ s−1. Figure 10 shows photographs of the samples in the compressive tests of sea ice under vertical and horizontal loadings.

Fig. 10. Brittle failure processes of columnar ice: (a) t = t 1_v, (b) first crack appears close to the left surface, t = t 2_v, (c) first buckling and appearance of the second crack, t = t 3_v, (d) second buckling, t = t 4_v, (e) subsequent cracks and buckling, after t 4_v, (f) strain–stress diagram of ice under vertical loading, (g) t = t 1_h, (h) first inclined crack and first stress peak, t = t 2_h, (i) second inclined crack appears and maximum stress, t = t 3_h, (j) final failure and stress decreases to zero, t = t 4_h and (k) strain–stress diagram of ice under horizontal loading.
Under vertical loading, the first crack appears near the left surface (Fig. 10b) at t = t 2_v. With increasing loading, the crack penetrates the sea-ice sample vertically. Once a slender column is separated from the sample, it immediately fails through buckling (Fig. 10c). Meanwhile, another crack forms on the right side of the sample (at t = t 3_v) and fails through a similar process. According to the stress–strain diagram (Fig. 10f), each of these buckling failures produces a single force peak. Together, the diagram displays multiple peaks before the final failure.
On the other hand, inclined cracks form preferentially in the horizontal loading tests following the mechanism introduced in Section 4.2. In Figure 10h, a fully developed crack appears at the upper-right corner (Fig. 10h), which results in the first peak in Figure 10k. The second inclined crack occurs at the upper-left corner and leads to another force peak.
According to the fieldwork, the failure processes are sketched in Figure 11. Under a high nominal strain rate, the stress concentration relaxation is weakened, and the sea ice fails in a brittle manner. When brittle behavior dominates the failure processes, the local damage may encounter local lateral confinement (Kolari, Reference Kolari2017). If the crack development is part of this damage, the confinement could limit the crack development. As was observed in the ductile behavior (Section 4.1), the sea-ice samples are constrained by the ice–platen friction. For the brittle failure process cases (Fig. 11), the ice is constrained at the top and bottom by the ice–platen friction while there is low confinement in the mid-height section of the sample, where cracks occur easily (stage I in Figs 11a and d).

Fig. 11. Sketch of the brittle failure processes: (a–d) vertical loading: (a) stage I: Initial crack, (b) stage II: vertical cracks, (c) stage III: first buckling, (d) stage III: second buckling and (e–g) horizontal loading: (d) stage I: wing cracks, (e) stage II: inclined cracks and (f) stage III: faulting.
In stage II, the initial crack develops along the grain boundary, similar to the transition process in Section 4.2. In this stage, the cracks grow in different paths depending on the loading direction, as shown in Figures 11b and e. In the compression test under vertical loading, the cracks separate the sample into several slender columns, and each buckling failure of one of these columns produces a force peak. Likewise, the inclined cracks in the samples loaded horizontally also lead to multiple force peaks.
In the brittle-dominated mode, the overall compressive strength is lower than that of D/B transition. For vertically compressed ice, because the cracks move outward, the columns become thinner than the two formed in the transition condition. For the horizontal loading tests, the shear area from the inclined cracks is also reduced. Indeed, the material failure is divided into several steps instead of a single heavy fracture. Therefore, it could be conceivably hypothesized that the compressive strength has a negative correlation with the nominal strain rate.
In summary, under vertical and horizontal loadings, the sea ice fails in both ductile and brittle modes. Although the nominal strain rate is the trigger for the D/B transition, the real driving mechanism can be understood as the competition between the stress buildup and stress relaxation near the wing crack tips, which agrees with the analysis by Schulson (Reference Schulson1997). At high loading speed, the stress buildup dominates the crack and leads to crack development; on the other hand, at low loading speed, the stress concentration is relaxed and the crack development is impeded. Furthermore, depending on the loading direction, sea ice fails in various paths and responds with different strengths.
5. Discussion
5.1 Influence of the nominal strain rate on the failure mode of sea ice
In Sections 4.1–4.3, the experimental results show that the sea ice undergoes various failure modes under different nominal strain rates. Under the same loading speed, the sea ice may fail in different modes due to the random distribution of brine inclusions and air bubbles as well as grain shapes. Different failure modes have been observed under similar experimental conditions (Sammonds and others, Reference Sammonds, Murrell and Rist1998; Strub-Klein, Reference Strub-Klein2017).
In this study, different failure modes were also observed at the same nominal strain rates. Based on the observation (videotape) and force–time records, the proportion of each failure mode is further calculated. In the time history curves, the ones without sudden drop are assumed to be ductile failure; the ones with sudden drop but single force peak are treated as transition mode; the ones with multiple peaks are treated as brittle mode. Figure 12 shows the proportion for the tested nominal strain rates. At low and high nominal strain rates, the sea-ice samples are dominated by ductile failure and brittle failure, respectively. However, at moderate nominal strain rates, especially at the transition strain rate, the sea-ice samples can fail in ductile failure or brittle failure. This can be explained by two factors. First, the development of micro-cracks in sea ice is very sensitive to the nominal strain rate at the D/B transition condition, and small differences could lead to different failure modes. Second, the transition nominal strain rate is a range rather than a single value. This range might be wider for sea ice with a higher porosity.

Fig. 12. Failure mode distribution at different nominal strain rates: (a) vertical compressive loading and (b) horizontal compressive loading.
5.2 Influence of the failure mode on the compressive strength of sea ice
In the analysis of the failure processes in Section 4, the σ c–$\dot{\varepsilon }$ relationship is consistent within each failure mode. In Figure 13, the σ c–$\dot{\varepsilon }$
 relationship is indicated for different failure modes. For both loading directions, the relationship followed similar trends. At low $\dot{\varepsilon }$
 (below 4.7 × 10⁻⁴ s−1 for vertical loading and below 1.8 × 10⁻³ s−1 for horizontal loading), where the ice failed in the ductile mode, σ c and $\dot{\varepsilon }$
 have a positive correlation. At the D/B transition, σ c reached its maximum values. At high $\dot{\varepsilon }$
 (above 5 × 10⁻⁴ s−1 for vertical loading and above 2.8 × 10⁻³ s−1 for horizontal loading), where the ice failed in a brittle manner, σ c decreased with increasing $\dot{\varepsilon }$
 . The data indicates that the σ c–$\dot{\varepsilon }$
 relationship is mainly dependent on the failure mode. It is reasonable to fit the σ c–$\dot{\varepsilon }$
 relationship with different equations based on the failure mode.

Fig. 13. Compressive strength under different failure modes: (a) vertical loading and (b) horizontal loading.
These different trends agree with the analysis of the failure mechanism in Sections 4.1–4.3. In the ductile mode, the lower nominal strain rate benefits stress relaxation. At the D/B transition, a primary crack leads thick columns to break, and thus results in the highest compressive strength. In the brittle mode, increasing the nominal strain rate decreases the column diameters (or shear area). The thinner the formed columns (smaller shear area), the weaker the ice will be. Overall, these results provide further support for the hypothesis that the transition is not only in the strength trends but also in the failure modes.
5.3 Influence of the loading direction on the brittle-to-ductile transition
Another interesting result is that the value of $\dot{\varepsilon }_{{\rm D/B}}$ is lower under vertical compression loading than under horizontal compression loading, as shown in Figure 14. As discussed in Section 4, the indicator of the transition is the appearance of brittle failure, which is a result of the competition between crack nucleation and stress concentration relaxation. The crack nucleation leads to the crack development and consequently the brittle failure while the relaxation impedes crack development and results in the ductile failure. Since the stress concentration relaxation follows different mechanisms, the D/B transition strain rate is dependent on the loading directions. Under horizontal loading, the stress concentration is relaxed by grain boundary sliding, while for vertical loading it is relaxed by grain decohesion. Compared with the viscous behavior from the sliding, the instantaneous elastic response of the decohesion is more sensitive to the strain. Therefore, sea ice under horizontal loading requires a higher nominal strain rate to trigger crack nucleation.

Fig. 14. Compressive strength of sea ice under different loading directions.
5.4 Influence of nominal strain and system stiffness
During a uniaxial compression test, the stresses on the two ends of sea-ice specimen are the combination of ice–platen friction and compression. It is more complex than the idealized uniaxial loading with uniform deformation. Conventionally, the deformation inside a specimen is measured with an extra displacement transducer attached directly on the ice surface. In this way, the complex stress condition at the platen–ice area would not be taken into count. However, the air temperature changes all the time during the field tests. The extensometers were not installed in the specimens, so that the experiments can be finished in a short time to avoid the obvious change of temperature. As introduced in the previous section, the nominal strain and nominal strain rate are calculated from the displacement of loading platens. They are less accurate than the direct measurement from transducers. These differences may lead to some error in determining D/B transition rate. However, the failure mode transition would still occur over a certain range of strain rates. And the mechanism of failure mode shift would not be different.
Another important issue is the influence of system stiffness. During the loading process, the rig system may deform and consequently influence the determination of strain and strain rates. For the loading machine applied in this study, the manufacturer provides a parameter of system deformation <0.01 mm at 50 kN (loading capacity). The loading system is much stronger than ice samples. Based on this value, the true D/B transition rate is lightly lower than the results exhibited in the previous section.
5.5 Connection between micro-scale structure and macro-scale behavior
Natural sea ice contains gas and brine pockets. During the uniaxial compression tests there may be stress concentration on the flaws. Under low strain rates, the stress concentration could be relieved by relaxation and the flaws may not fully develop to cracks. And the macro-scale behaviors of the ice could be expansion and split-out (Fig. 6) depending on loading direction, as the observation in the experiments. If the strain rate reaches a critical value, the flaws grow and become macro-scale cracks. Eventually, the macro-scale cracks spread through the ice specimen and result in the brittle failure.
During the ice growth, the brine and air are often trapped on the grain boundaries. Thus, the cracks are more likely to initiate at the grain boundaries. When the cracks develop, the grain boundaries are, in general, the preferred paths. Therefore, the failure pattern and consequent strength are dependent on the relative direction between loads and grain boundaries (grain columns).
6. Conclusions
Sea ice has a columnar structure and behaves with anisotropic mechanical properties under natural conditions. The main goal of this study is to determine the influence of the loading direction on the failure processes and compressive strength of sea ice. Uniaxial compressive tests were conducted under vertical and horizontal loadings on S3 sea ice in the Bohai Sea with nominal strain rates ranging from 4.7 × 10⁻⁵ to 7 × 10⁻³ s−1. The average compressive strength varied from 6.0 to 10.8 MPa under vertical loading and 1.9 to 6.0 MPa under horizontal loading. The brittle-to-ductile transition nominal strain rates are 5 × 10⁻⁴ s−1 under vertical loading and 3 × 10⁻³ s−1 under horizontal loading.
These uniaxial compressive tests show that the sea ice can fail in ductile or brittle modes under both loading directions, depending on the nominal strain rate. However, the failure processes have different mechanisms under different loading directions. In the ductile failure mode, the sea ice yields through grain boundary decohesion under vertical loading and grain boundary sliding under horizontal loading. In the brittle mode, the samples failed through shear faulting along the grain boundary under horizontal loading and through cross-column cracking under vertical loading. Compared with boundary sliding and shearing, decohesion and cross-column cracking induce higher strengths. Under the same conditions, sea ice has a lower transition nominal strain rate under vertical loading than under horizontal tests.
The proportion of the failure modes shows that the brittle behavior of sea ice dominates the final failure over a range of nominal strain rates. The correlation between the nominal strain rate and the compressive strength is dependent on the failure mode. The compressive strength increases with increasing loading rate in the ductile mode but decreases with increasing loading rate in the brittle mode. It has a maximum value in the brittle-to-ductile transition zone.
The manner of the crack development in sea-ice samples is essential to the ice failure mode and the compressive strength. The precise mechanism of the local deformation and crack development remains to be elucidated. The traditional instrumentation (extensometer) would be reliable on measuring ice strain within a certain range. We can also consider inserting a transducer into the closed loop system, so that the loading speed can be adjusted accordingly during the test, and the strain rate can be well controlled. Although such design would improve controlling the ice strain rate, it is more challenging to run it in the fieldwork environment. For capturing detailed deformation localization, a further study applying digital image correlation is in progress. The mechanism of crack development under various loading rates will be investigated in a future study.
Data
All data that support our findings in this paper are available from the corresponding authors (jisy@dlut.edu.cn) upon reasonable request.
Acknowledgements
This study was supported financially by the National Key Research and Development Program of China (Grant nos. 2018YFA0605902 and 2016YCF1401505) and the National Natural Science Foundation of China (Grant no. 41576179).


 Open access