


1. Introduction
Past climatic and environmental changes provide vital baseline data for future projection of climate change. Such data have been obtained by studies of archives, such as tree rings, ice cores, fossil pollens, ocean sediments and corals (Alexander and others, Reference Alexander2013). Climate change is not spatially uniform, even in small regions. In particular, the relatively short-term climate change that occurs over several years to decades varies greatly from region to region (e.g. PAGES 2K Consortium, 2013; Tsushima and others, Reference Tsushima2015). It has been reported that warming is more apparent at higher elevations than at lower elevations (Wang and others, Reference Wang, Fan and Wang2016). However, little data are available to examine how climate change varies with elevation.
Ice cores from Himalayan glaciers are important with respect to the water resources that support societies in south Asia (Immerzeel and others, Reference Immerzeel, Van Beek and Bierkens2010), as well as recent increases in anthropogenic aerosols (Ohara and others, Reference Ohara2007; Alexander and others, Reference Alexander2013). Although the region is difficult to access, several ice cores have been recovered from high elevations of the Dasuopu (Thompson and others, Reference Thompson2000) and East Rongbuk (Qin and others, Reference Qin2002) glaciers. Based on these ice cores, relationships between crustal components and fluctuations in large-scale atmospheric circulation, such as the Asian monsoon and westerlies, have been reported (e.g. Thompson and others, Reference Thompson2000; Kang and others, Reference Kang2002; Qin and others, Reference Qin2002). On the contrary, Kaspari and others (Reference Kaspari2008) revealed differences in accumulation rates for two ice cores that are separated by 125 km. The accumulation rate in the East Rongbuk ice core was lowest in the 1800s, whereas it was highest in the Dasuopu ice core at the same time. It is not clear whether this discrepancy is caused by the complex topography of the Himalayas, local variability in the monsoon circulation, or errors associated with the ice core dating. In this regard, further ice cores from the Himalaya need to be extracted and studied. However, few ice cores have been drilled in this region, particularly on the southern side of the Himalayas (Fujita and others, Reference Fujita2002).
Since 2017, we have conducted a research project that aimed to extract an ice core from the southern side of the Himalayas. This project aims to investigate the spatial variability of precipitation along the Himalayas by analysing oxygen isotopes in tree rings – as a proxy for precipitation (Sano and others, Reference Sano2013, Reference Sano, Xu, Dimri, Ramesh, Dimri, Bookhagen, Stoffel and Yasunari2019) and ice cores. In this paper, we describe our reconnaissance ice core drilling with a hand auger in 2017 and 2018, and the main operation in 2019, during which we drilled an 81.2-m-long ice core with an electro-mechanical drill. We also present preliminary stratigraphic results for the ice cores, and water stable isotopes for an 8-m-long ice core drilled in 2018.
2. Drill site and expedition schedule
2.1 Drill site
The Trakarding–Trambau glaciers are located in the Rolwaling region of eastern Nepal (Fig. 1). The glaciers range in altitude from 4600 to 6850 m a.s.l. and cover an area of 76.5 km2. At the terminus of the glaciers, Tsho Rolpa, which is the largest glacial lake in Nepal, has been expanding since the 1960s (Sakai and others, Reference Sakai, Chikita and Yamada2000). The debris-free Trambau Glacier is separated from the debris-covered Trakarding Glacier by a rockwall at 5000 m a.s.l. The ice core drill site was located on a gentle sloping snowfield (27.919° N, 86.545° E, and 5862 m a.s.l.). Mass-balance observations since 2016 suggest that the site is broadly situated at the equilibrium line altitude, and is thus affected by the melting of surface snow (Sunako and others, Reference Sunako, Fujita, Sakai and Kayastha2019). The ice thickness at the site is ~300 m, based on ground-penetrating radar investigations (personal communication from Sunako et al.).
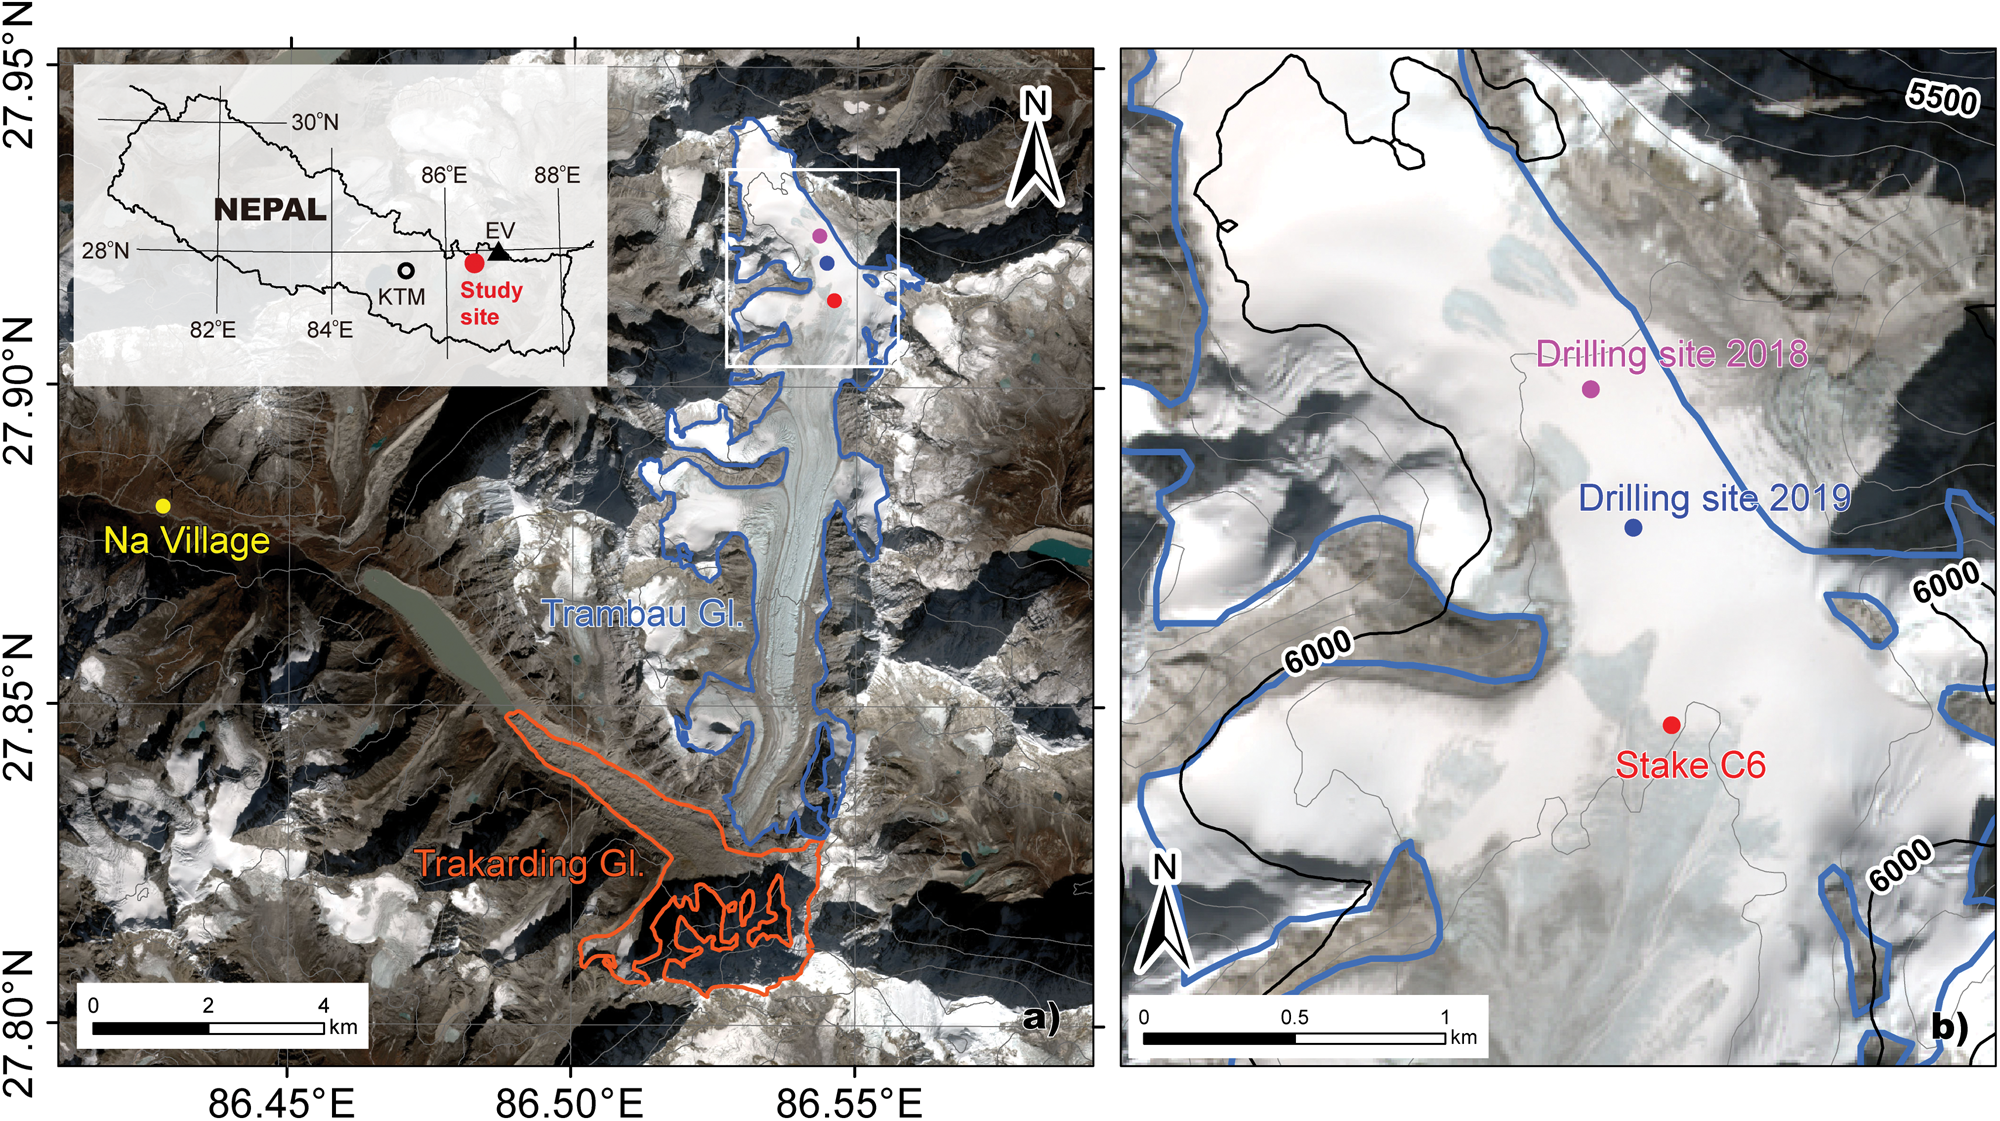
Fig. 1. (a) Overview of the Trakarding–Trambau glaciers in the Rolwaling region, Nepalese Himalaya, and (b) a close-up view of the drill site. The inset in (a) shows the Rolwaling region (red circle), Kathmandu (KTM), and Mount Everest (EV). Na Village (yellow circle in (a)) is the highest (4600 m a.s.l.) and final village before the field site. Open white box in (a) denotes the area of (b). Glacier boundaries were modified from the GAMDAM Glacier Inventory (Nuimura and others, Reference Nuimura2015; Sakai, Reference Sakai2019). The background image is a Sentinel-2 image taken on 24 November 2017.
2.2 Expedition membership and timeline
Figure S1 shows the expedition timeline. The expedition team consisted of eight scientists, seven Sherpa guides and 38 porters. En route to the drill site, we conducted glaciological observations such as GPS surveys, aerial photogrammetry with an unmanned aerial vehicle, temperature measurements of debris layers, measurement and re-installation of mass-balance stakes, data recovery from automatic weather stations (AWSs), and installation of new AWSs at different elevations.
3. Transportation and helicopter operations
One of the major issues during the expedition was the weight limitation of the transportation. The helicopter transportation to the drill site at 6000 m a.s.l. was challenging, and we had to reduce the maximum weight of each piece of baggage to 40 kg, which is the maximum weight that one porter can carry. To achieve this weight reduction, an 180-m-long cable was removed from the drill winch. Other heavy instruments were also disassembled. Packing shape and balance were also taken into account for the porter baggage loads. A summary of the instruments used for the drilling and glaciological observations are listed in Table 1 and shown in Figure S1. Another issue with respect to the expedition was the size of the helicopter. In a past expedition that we conducted in Hidden Valley, west Nepal in 1998, we chartered a large Russian helicopter (Ml-8), which can carry >2 t at 5000 m a.s.l. (Fujita and others, Reference Fujita2002; Takeuchi and others, Reference Takeuchi2009a). However, in recent years, such large helicopters have been requisitioned by the Nepalese army and are unavailable for civilian purposes. The helicopter we chartered was an Airbus AS350-B3e, with a maximum loading volume for one flight that was limited to 0.68 m3 (i.e. six ice core boxes, each 0.39 m × 0.65 m × 0.45 m). The maximum loading weight was 240 kg between Kathmandu and Na, with the latter being the highest village (4600 m a.s.l.; Fig. 1) before reaching the drill site. The maximum loading weight was 50–100 kg between Na and the drill site (5862 m a.s.l.).
Table 1. List of equipment transported by the helicopter operation
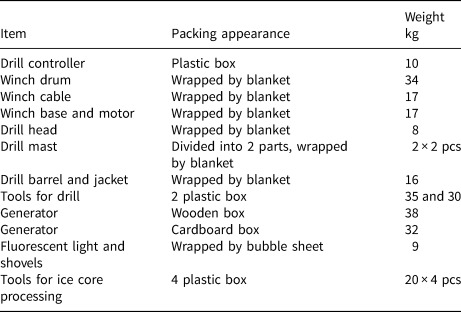
Just in case, one piece was prepared to be <40 kg for carried by porters.
On 2 November 2019, the outbound flight operations were conducted. Three helicopters flew from Kathmandu to Na village with a total instrument load of 330 kg. Each helicopter then made two shuttle flights to the drill site. During the return flight operations on 9 November 2019, two helicopters conducted seven shuttle flights between the drill site and Na village, and four shuttle flights to Kathmandu, which transported a total load of 550 kg of instruments and ice core samples.
The ice core samples were taken to Tribhuvan Airport in Kathmandu in cold storage (−13°C) by a refrigerated vehicle (−18°C), and then stored until they were shipped to Japan. Given that no flight with freezing storage is available between Nepal and Japan, we rearranged each ice core box to be 15 kg in gross weight and added 10 kg of dry ice to each box, which was imported from India. The cargo was transported by regular commercial flights and experienced room temperature conditions for ~20 h. The ice core samples were finally placed in cold storage (−20°C) at the Institute of Low Temperature Science, Hokkaido University, Hokkaido, Japan.
4. ICE core drilling
Prior to the main drilling expedition in 2019, we conducted two reconnaissance drilling expeditions in 2017 and 2018 on the same snowfield. For the reconnaissance drilling, we used a hand auger (Kyushu Olympia Kogyo, Japan), which can drill a 0.5-m-long ice core with a diameter of 73 mm. During the main drilling expedition in 2019, we used a small and lightweight electro-mechanical drill system (Geo Tecs, Japan) for shallow ice cores (Takahashi, Reference Takahashi1996, Reference Takahashi2005).
4.1 Drill system
The electro-mechanical system can drill a 0.55-m-long ice core with a diameter of 95 mm. This system has been used mainly for drilling in high mountainous regions since 2002 (e.g. Takeuchi and others, Reference Takeuchi2004, Reference Takeuchi2014; Tsushima and others, Reference Tsushima2015). The winch mortar requires a maximum power of 750 W, while the drill mortar requires 350 W at 100 V in DC mode. The detailed drill system was described in Takeuchi and others (Reference Takeuchi2004). Figure 2a shows the entire drill system set up at the drill site. The drill is guided with a winch on a mast and a 180-m-long armoured cable. One of the most uncertain issues with high-elevation drilling is whether the generator can provide electricity at the expected output. The generator used during drilling was a petrol-powered generator (EF2500i; Yamaha Motor, Japan), which is suitable for cold climates. Its expected output is 2.5 kV A at sea level, and it weighs 29 kg. To avoid incomplete combustion in the thin air at high elevation (~470 hPa at 6000 m a.s.l.), we reduced the fuel injection amount by using a narrower jet nozzle (Part No. 1HX-1423E-31; Yamaha Motor, Japan). In addition, the dirty spark plug was changed frequently during drilling. The engine oil was also changed at least once a day. As such, the generator provided sufficient electricity for drilling at 6000 m a.s.l.
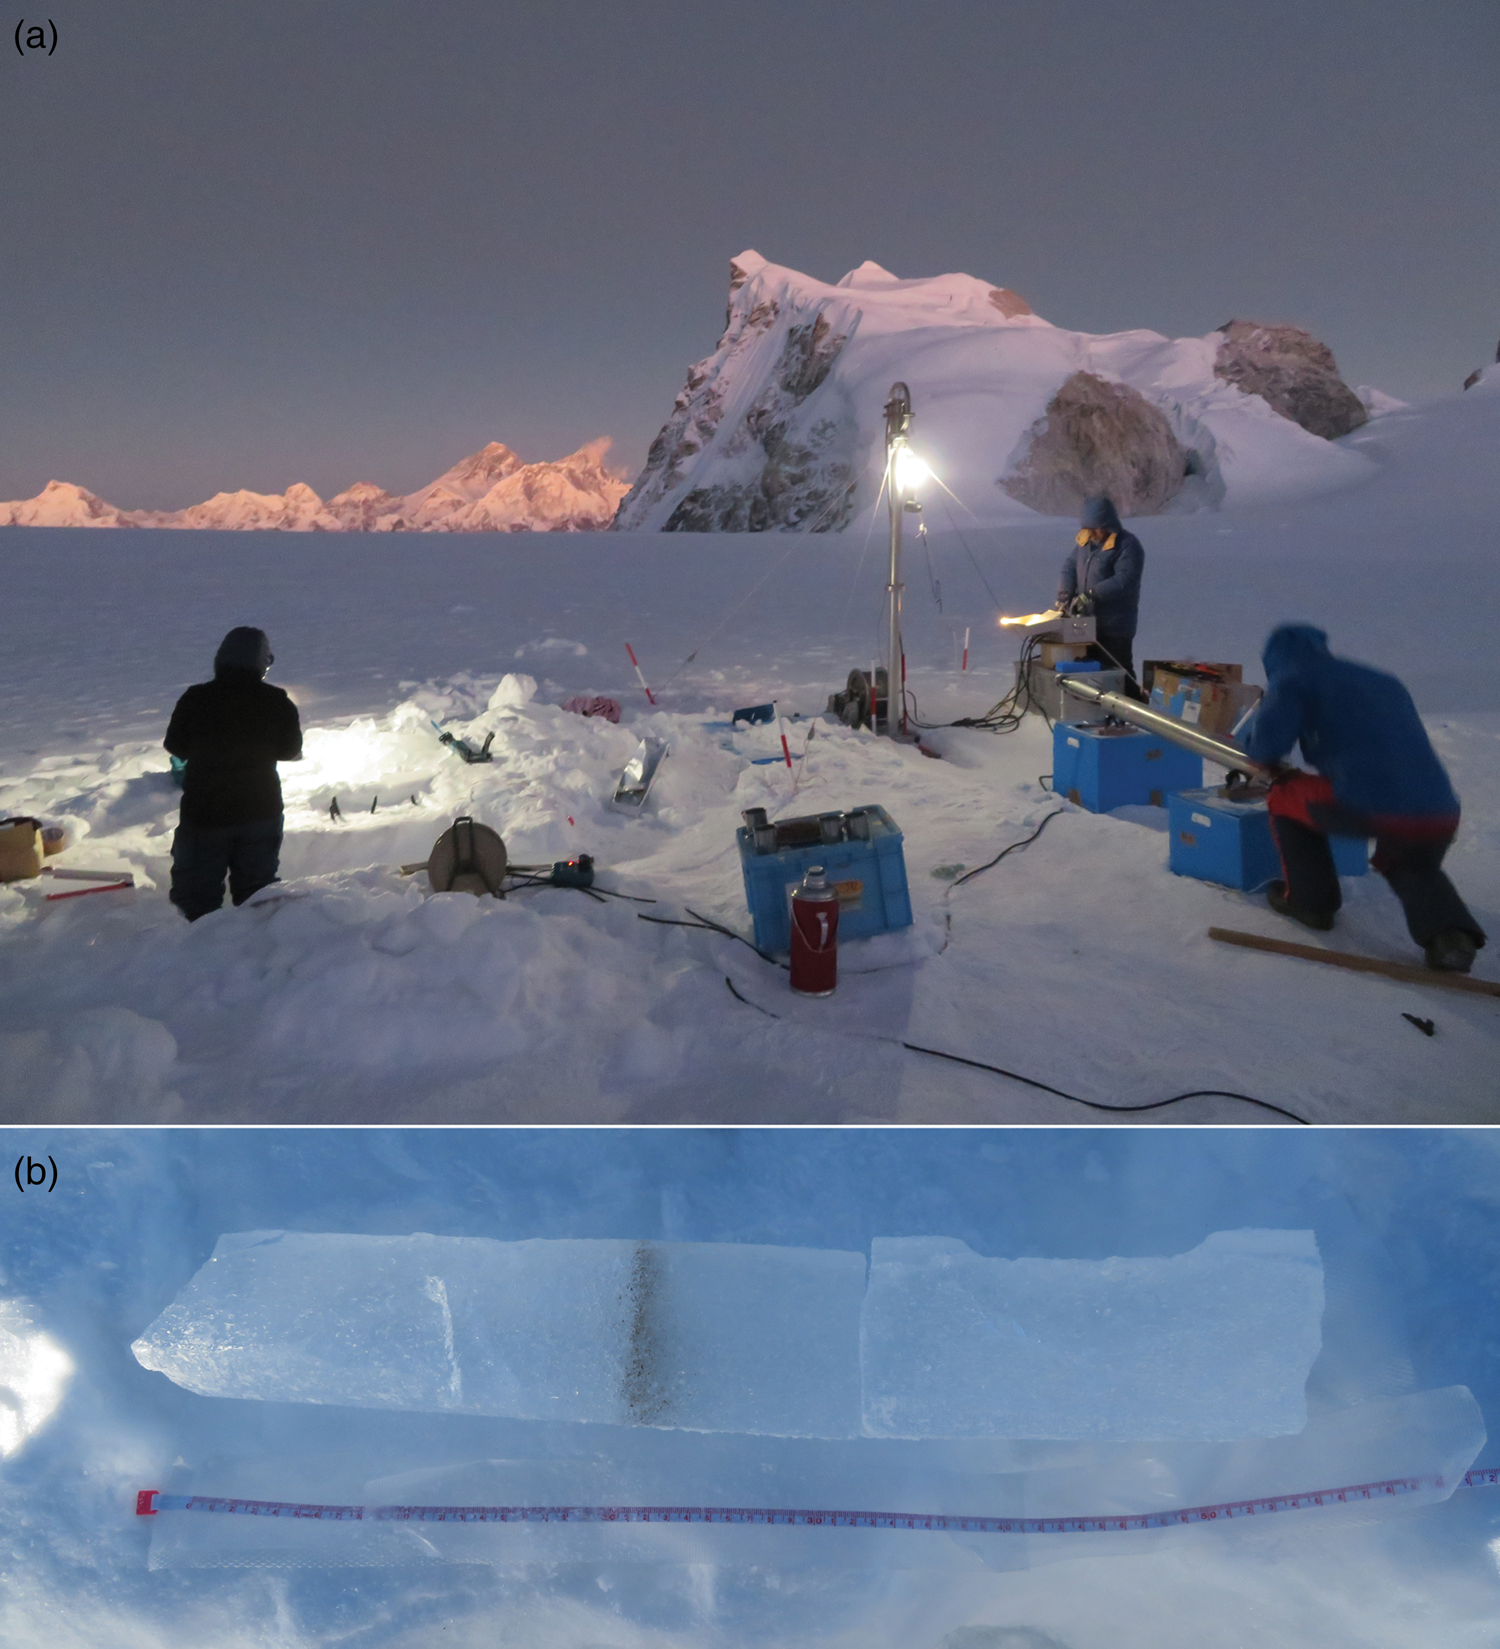
Fig. 2. Photographs of the drill system (a) and in situ ice core processing (b; run no. 82) on the Trambau Glacier during the 2019 drilling expedition.
4.2 Drilling operation
The drilling operation was conducted for 5 days, and a 78.4-m-long ice core was recovered in 177 runs over 41 drilling hours (Fig. 3). The air temperature was measured with a temperature sensor and logger attached to the drill system (without a sun shade), and was lower than the melting point throughout the drilling operation (Fig. 3a). However, strong solar radiation warmed the drill during the daytime, as previously reported (e.g. Kamiyama and others, Reference Kamiyama, Motoyama and Watanabe2001; Fujii and others, Reference Fujii2002; Kohshima and others, Reference Kohshima2002; Takeuchi and others, Reference Takeuchi2004; Takahashi, Reference Takahashi2005). The warm drill caused melting and refreezing of ice chips, which was problematic during the drilling; the wet chips often became stuck in the barrel spiral. In addition, compressed chips in the upper space of the ice core barrel pushed the ice core downwards, thus the drill cutters could not reach the ice. The first day of drilling (4 November 2019) was rather cold, and it was possible to continue the drilling throughout the daytime. However, it was too warm to drill on the second day (5 November 2019). It was problematic to extract the ice core from the barrel due to refreezing; therefore, the drilling speed was slow at a depth of 20 m (Fig. 3b). Thus, we took long noontime breaks on the third and fourth days (6 and 7 November 2019; Fig. 3a). The last day (8 November 2019) was cloudy and we were able to drill from 6 am until noon. The overall drilling progress was ~2 m h–1 (Fig. 3b).
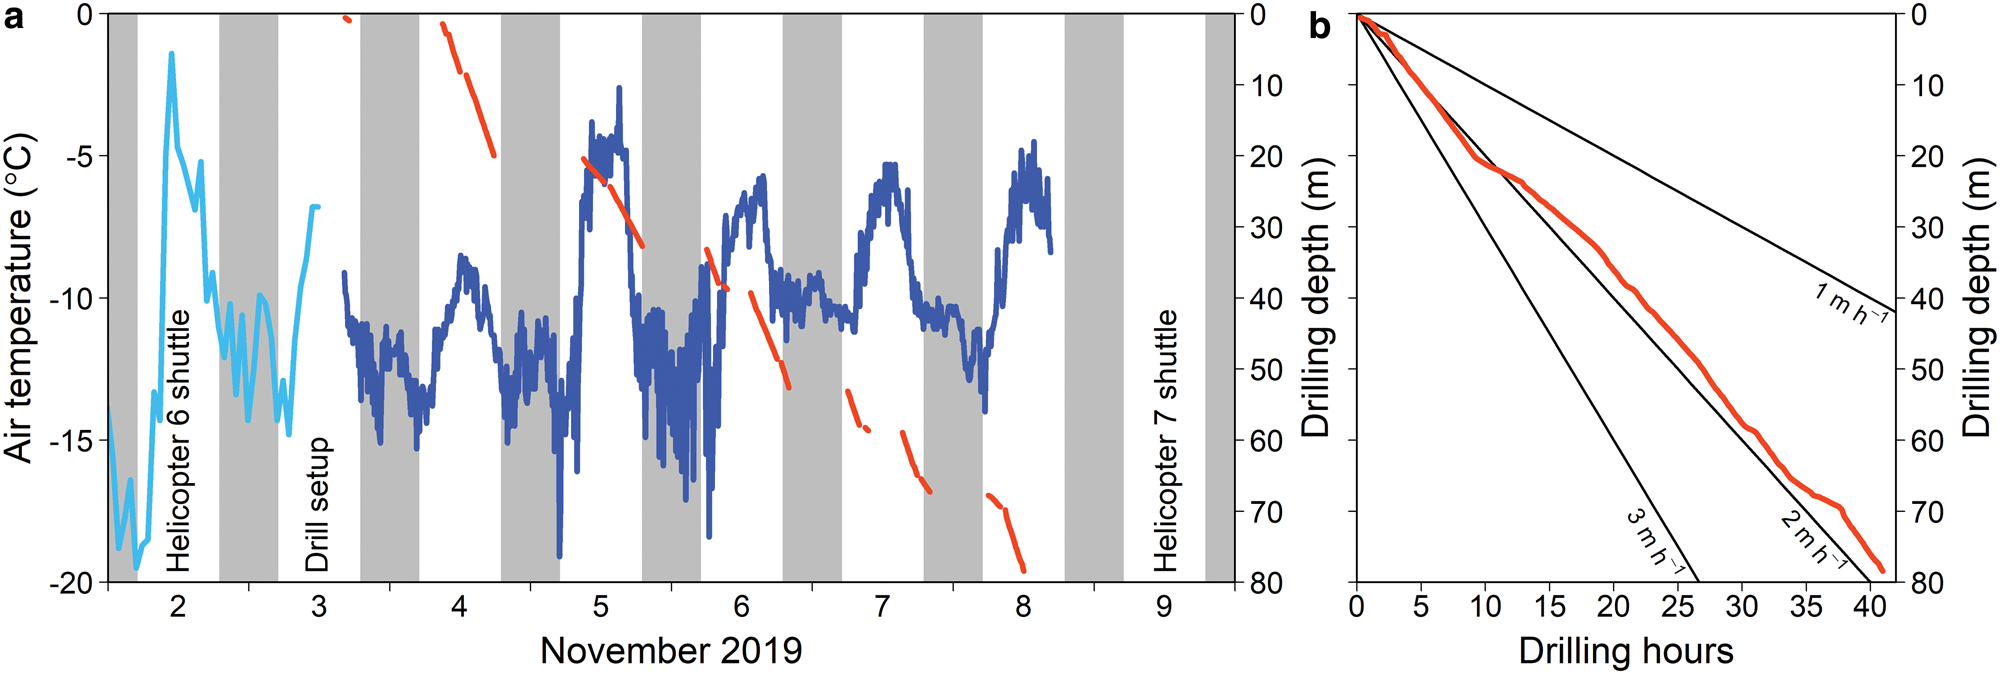
Fig. 3. (a) Air temperature (left axis) and drilling progress (right axis) on the Trambau Glacier in the Rolwaling region, Nepalese Himalaya, and (b) drilling progress vs time. Light blue and blue lines denote air temperatures (left axis) at Stake C6 (1 h intervals) and at the drill site (10 min intervals), respectively. The red lines in both panels denote the drilling depth (right axes).
4.3 In situ measurements
The air temperature was recorded with a thermistor data logger (TR-52i; T&D Co.) at Stake C6 (1 h intervals) and the drill site (10 min intervals; Fig. 1b). The sensor was shielded by a PVC pipe at Stake C6, whereas it was exposed at the drill site. After the drilling was completed, we measured the borehole temperature by attaching the thermistor sensor to the anti-torque between 14:00 and 16:00 on 8 November 2019. The temperature was logged at 10 s intervals, and the anti-torque was stopped at 5, 10, 20, 30, 40, 60, 70 and 77.55 m depth for 10 min. The average of the latter 5 min at each depth was taken as the borehole temperatures.
The length and weight of each ice core were measured immediately for bulk density calculations. The ice core length was 78.4 m based on the cable length, although it was 81.2 m based on an in situ inspection. The ice core was visually inspected to identify firn, ice and bubble-containing layers, including dust layers. Due to budgetary and transportation constraints, the ice core was cut longitudinally using an electrical saw (JR101DW; Makita Co.), and only 60% of the core was transported back to Japan (Fig. 2b). The ice core samples were sealed in long plastic bags, and then packed into insulated boxes (0.39 m × 0.65 m × 0.45 m). To avoid melting, the ice core boxes were stored in a snow pit under a sunshade made from a plastic sheet. The internal temperature of one ice core box was recorded with a temperature logger. Figure S2 shows that the interior temperature of the ice core box was positive during the helicopter return operation on 9 November 2019. However, since 9 November 2019, the ice core temperature has been below the melting point and is currently stored in the cold room of the Institute of Low Temperature Science, Hokkaido University, Japan. Despite the positive temperature recorded in the ice core box, melting of the ice core samples is not evident.
4.4 2018 ice core
We conducted two reconnaissance drilling expeditions in 2017 (2.5 m) and 2018 (8.39 m) on the same snowfield as the main expedition in 2019. The ice core samples were cut horizontally in situ with a ceramic knife into ~0.1-m-long sections. To avoid possible contamination, we shaved off the outer 3 mm of each sub-sample with the ceramic knife. The decontaminated samples were packed into clean polyethylene bags (WHIRL-PAK), melted at ambient temperatures at the camp site, and then stored in glass bottles. During drilling on 4 November 2017, we also took samples of fresh snow and snow layers near the drill site and Stake C6. We collected the snow samples in clean polyethylene bags (WHIRL-PAK), which were then melted at ambient temperatures at the campsite and stored in glass bottles.
The water stable isotope ratios (δD, δ18O and δ17O) of the ice core were measured using a near-infrared cavity ring-down spectrometer (Picarro L2140-i) with a Picarro-A0211 vaporiser (Schoenemann and others, Reference Schoenemann, Schauer and Steig2013; Steig and others, Reference Steig2014) at the National Institute of Polar Research, Tokyo, Japan. The precisions of the δD, δ18O and δ17O measurements were ±0.1, ±0.04 and ±0.04‰, respectively. Water stable isotope ratios (δD and δ18O) of the snow samples were measured using a near-infrared cavity ring-down spectrometer (Picarro L2130-i) with a Picarro-V1102-i vaporiser at the Research Institute for Humanity and Nature, Kyoto, Japan. The precisions were ±0.2‰ for δD and ±0.08‰ for δ18O. We calculated the d-excess (d-excess = δ D− 8 × δ18O) and 17O-excess (17O-excess = ln(δ17O + 1) − 0.528 × ln(δ18O + 1); in per meg; Barkan and Luz, Reference Barkan and Luz2005, Reference Barkan and Luz2007).
5. Stratigraphy and preliminary results
5.1 2019 ice core
The density and stratigraphic profiles of the 81.2-m-long ice core are shown in Figure 4. The average core length was 0.46 m, and 57 cores were longer than the drill capacity (0.50 m; Fig. 4a). The average density of the ice core is 866 kg m–3 (Fig. 4b), and 88% of the core is refrozen ice with a density of >830 kg m–3 (Fig. 4c). The stratigraphic features indicate that the study site should be categorised as a percolation zone (Cuffey and Paterson, Reference Cuffey and Paterson2010). Dust layers occur throughout the entire ice core (Fig. 4d). Dust density is also shown in Figure 4e. Previous studies have suggested that aerosol deposition on Himalayan glaciers depends on changes in atmospheric circulation, such as strengthening and weakening of the summer monsoon (e.g. Thompson and others, Reference Thompson2000).
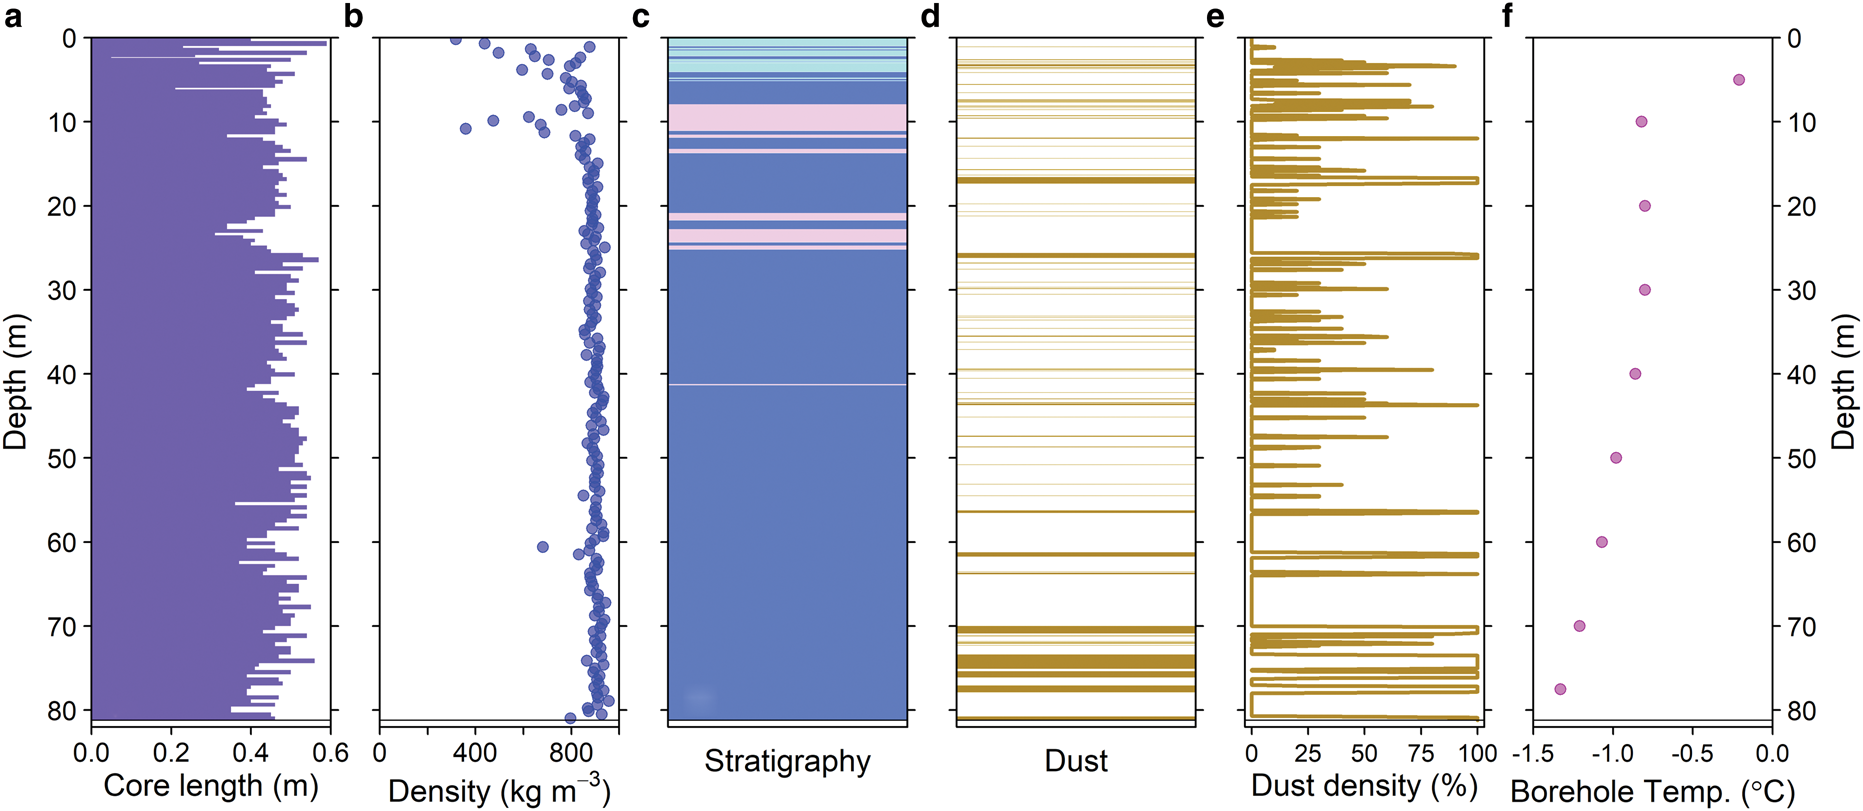
Fig. 4. Profiles of (a) core length, (b) density, (c) stratigraphy, (d) dust layers, (e) dust density and (f) borehole temperature in the ice core from Trambau Glacier, Nepalese Himalaya, drilled in 2019. The light blue, pink, and blue shaded areas in (c) denote firn, bubble-rich ice, and refrozen ice, respectively. Dust density is defined as the percentage of dust layers counted at 0.01 m intervals in every 0.1 m of core.
The borehole temperature gradually decreased with depth from −0.21°C at 5 m to −1.33°C at 77.55 m. During the borehole temperature measurements, the outside temperature was −6.7°C. The 10 m depth temperature, which is generally considered to correspond to the annual mean air temperature (Loewe, Reference Loewe1970), was −0.82°C. The annual mean temperature observed at Stake C6 was −8.7°C for 1 year from 31 October 2018. Previous studies have reported ice temperatures of −9.6°C at 10 m depth at 6450 m a.s.l. on the East Rongbuk Glacier (Kang and others, Reference Kang2003) and −16.0°C at 10 m depth at 7200 m a.s.l. on the Dasuopu Glacier (Thompson and others, Reference Thompson2000). The 10 m depth temperature at our drill site is significantly warmer than the annual mean temperature. As shown in Figure 4, melting and refreezing might have occurred at the drill site. A previous study suggested that latent heat released by refreezing of percolating meltwater could increase the ice temperature (Bingham and others, Reference Bingham, Hubbard, Nienow and Sharp2008). This would affect not only the ice temperature and stratigraphy, but also the palaeoclimatic record in the ice. Therefore, such ice cores first need to be examined for the effects of melting, percolation and refreezing.
5.2 2018 ice core
Figure 5 shows the density, stratigraphic and water stable isotope profiles of the 8.39-m-long ice core drilled in 2018. The figure also shows the water stable isotopic data for fresh snow collected in 2017 at Stake C6 near the drill site. We found that the bulk ice core density quickly increased to the ice density (Fig. 5a), and that 85% of the ice core consists of refrozen ice from 0.25 to 6.88 m in w.e. (Fig. 5b). The stratigraphic features indicate that the study site should be categorised as a percolation zone. Figure 5c shows that the dust concentration varies widely with depth. δ18O varies between −19.4 and −11.2‰ (Fig. 5d). The d-excess and 17O-excess vary between 7.9 and 15.0‰, and −0.8 and 70.8 per meg, respectively. Average δ18O and d-excess values for the four samples of fresh snow are −13.9 and 17.6‰, respectively. The correlation coefficient between the seven-sample running averages of the d-excess and 17O-excess is r = +0.43 (p < 0.05) from 2.03 to 4.27 m depth. At other depths, the 17O-excess increases with decreasing d-excess and vice versa. It is thought that both the 17O-excess and d-excess vary due to molecular diffusion during evaporation processes. Previous studies have reported that relative humidity is negatively correlated with 17O-excess and d-excess of atmospheric vapour on the ocean (Uemura and others, Reference Uemura, Matsui, Yoshimura, Motoyama and Yoshida2008, Reference Uemura, Barkan, Abe and Luz2010). Risi and others (Reference Risi, Landais, Winkler and Vimeux2013) further noted that re-evaporation of precipitation is an important control on the 17O-excess and d-excess. The positive correlation between these secondary parameters suggests a relatively strong influence from kinetic fractionation on water stable isotopes during evaporation. In contrast, a negative correlation would indicate the effects of re-evaporation during vapour transportation and precipitation.
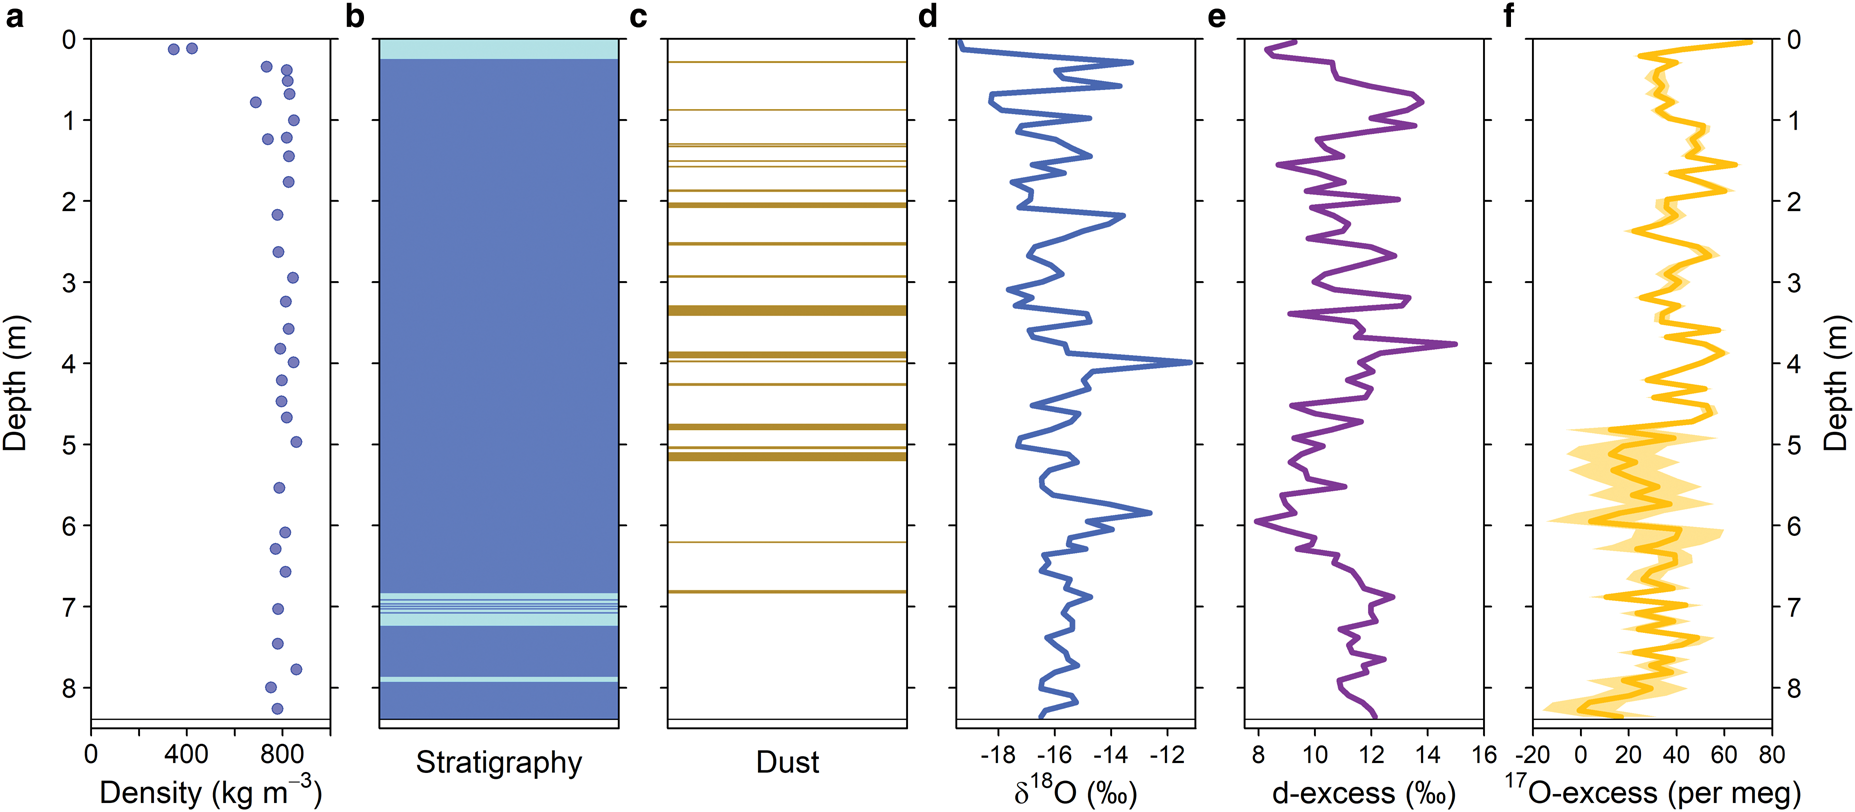
Fig. 5. Profiles of (a) density, (b) stratigraphy, (c) dust layers, (d) δ18O, (e) d-excess and (f) 17O-excess in the ice core from Trambau Glacier, Nepalese Himalaya, drilled in 2018. Light blue and blue shaded areas in (b) denote firn and refrozen ice, respectively.
Previous studies have reported that water stable isotopes in the ice cores drilled at 6450 m a.s.l. on the East Rongbuk Glacier vary from ~−26 to −10‰ for δ18O (Kang and others, Reference Kang2002) and ~−160 to −60‰ for δD (Zhang and others, Reference Zhang2009). Because the stratigraphy and ice temperatures indicate that the drill sites in 2018 and 2019 had been affected by melting and refreezing, we cannot expect that the water stable isotopes preserve seasonal cycles while the water stable isotopes in the 2018 ice core show similar fluctuations to those at the nearby site of Mount Everest (Kang and others, Reference Kang2002; Hou and others, Reference Hou2003).
In the monsoon-affected regions, including the Himalayas, precipitation isotopic minima tend to be observed in summer due to the ‘amount effect’ on water stable isotopes (e.g. Thompson and others, Reference Thompson2000). Although we find some degree of amplitude in the fluctuation of water stable isotope in the 2018 core (Fig. 5d), the melting and refreezing at the drilling site could have disturbed the seasonal cycle so that it is not clear whether this profile preserves the original seasonality. Therefore, it would be difficult to identify annual layers based on the isotope profile. Instead, dust and/or pollen grain can be used for counting annual layers of melt-affected ice cores because large insoluble are less affected by percolating meltwater (e.g. Nakazawa and others, Reference Nakazawa2004, Reference Nakazawa2005; Nakazawa and Fujita, Reference Nakazawa and Fujita2006; Uetake and others, Reference Uetake2006; Takeuchi and others, Reference Takeuchi2009b, Reference Takeuchi, Sera, Fujita, Aizen and Kubota2019; Okamoto and others, Reference Okamoto2011). Snow algae is also a possible marker in melt affected snow for identifying annual layer boundary (Yoshimura and others, Reference Yoshimura, Kohshima, Takeuchi, Seko and Fujita2000; Kohshima and others, Reference Kohshima2007). For dating the 2019 ice core, therefore, we need to obtain the data of dust, pollen and algae as well as water stable isotopes and chemical components.
Sunako and others (Reference Sunako, Fujita, Sakai and Kayastha2019) estimated the annual accumulation rate on Trambau Glacier was 0.73 ± 0.11 m w.e. for the period 1980–2018, using a mass-balance model validated with observational data. Assuming that the similar accumulation rates and a continuous record (this is questionable although), the 80-m long ice core is expected to preserve an environmental record for 100–130 years.
6. Conclusions and future plans
We conducted an ice core drilling expedition from 12 October to 14 November 2019 on the Trambau Glacier, Rolwaling region, Nepalese Himalaya. An 81.2-m-long ice core was extracted from an accumulation area at 5860 m a.s.l. Although our helicopter operations were finally successful, it should be noted that the Rolwaling region is a flight restricted area, unlike the Khumbu and Langtang regions, and thus the flight operations were challenging.
Because the drilling site could have been affected by melting and refreezing, we will estimate ice core age by analysing dust, pollen and algae. To reconstruct the annual accumulation rate at the site, we have to carefully evaluate missing layers by melting. Through comparison with oxygen isotopic data for tree rings, which have been sampled from a lower elevation in the Rolwaling region, we will evaluate spatial variations in precipitation in this region. We are also planning to analyse anthropogenic tracers in the ice core, such as lead and sulphur isotopes and black carbon. These anthropogenic aerosols will allow us to better understand the atmospheric circulation and history of the monsoon over the Himalayas, as well as socioeconomic growth in south Asia.
Supplementary material
The supplementary material for this article can be found at https://doi.org/10.1017/aog.2021.15.
Acknowledgements
We deeply thank Sherpa guides and porters for their dedicated logistic support during the 2019 ice core drilling. We also thank A. Sakai, S. Sunako, R. Kayastha and H. Inoue for their support during the field observations. We are indebted to S.P. Dahal (Starlight Express Pvt. Ltd.) for the transportation of ice core between Nepal and Japan. We acknowledge S. Matoba, Y. Iizuka, K. Kawamura, N. Takeuchi, K. Fukui, H. Motoyama, F. Nakazawa and K. Higuchi for their valuable suggestions for planning the drilling operation and transportation. Measurement of water stable isotopes was supported by K. Goto-Azuma, V. Gkinis and S. Yabusaki. This study was supported financially by JSPS-KAKENHI grant number 17H01621, 16K16184, and 18KK0098, and JSPS and SNSF under the Joint Research Projects (JRPs grant number 20191503).
Author contributions
A. T., M. S. and K. F. designed the study. A. T., M. M., T. Y., N. E., Y. S. and K. F. conducted the ice core drilling with the support of R. B. K. A. J. B. L. S. and M. S. supported the helicopter operations. A. T. and K. F. analysed the data and wrote the manuscript. All authors commented on the manuscript.


 Open access