


INTRODUCTION
The sea surface at the northern end of Baffin Bay between Hayes Peninsula in northwestern Greenland and Ellesmere and Devon Island in the Queen Elizabeth Islands, NWT, (Figure 1) has been reported to lack substantial sea ice concentration or even to be open during winter, and is called North Water
The main objectives and the scope of operation of the North Water Project have been described by Müller and others (1973) The unusually mild climate of the region of North Water was described by Ohmura (1975, 1976a, 1978) Sea ice conditions were evaluated by Ito (1982) for light half-years based on LANDSAT imageries Comprehensive work on the sea ice conditions during winter was recently presented by Steffen (1984)
The objectives of the present article are to report on (1) the surface conditions of North Water (distribution of sea ice and open water, surface characteristics of sea ice) and (2) the surface heat budget
SURFACE CONDITIONS
Method
To cover the area of about 80,000 km’ in dark winter required thermal channel measurements either from satellites or from an aircraft Thermal measurements from satellites were considered inappropriate, as their acuracy and resolution were not compatible for the present purposes A low-flying aircraft was chosen as an instrument platform
The thermal radiation from the sea surface was measured with a Precision Radiation Thermometer (PRT-5)
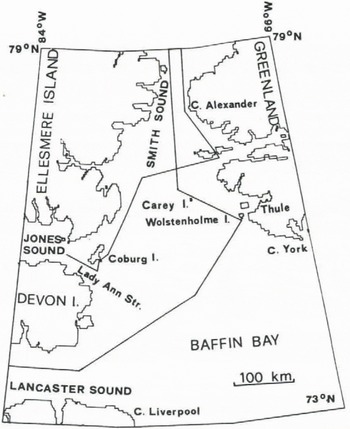
Fig. 1. Map of North Water region and flight profiles
in the spectral range from 9 5 to 11 5 μιη from a flight altitude of 300 m The 20°angle-of-view was chosen which gave a circular field-of-view with a 100 m diameter At the same time, the ground along the flight path was filmed on Ektachrome Videonews High Speed film to obtain pictorial information on the surface characteristics of sea ice and open water and also to aid locating the aircraft’s position A Spectrolamp SX-16 searchlight with an average beam power of 25,000 Lumen served as a source of illumination The instruments were installed vertically through a hatch in the bottom of a Twin Otter aircraft, which was flown at an average airspeed of 220 km/h Air temperature at flight level was continuously measured for the subsequent atmospheric correction
The raw brightness temperatures require a number of corrections, for the emissivities of water, snow and ice surfaces, for the absorption and emission by the atmospheric water vapour and for the multiple reflection of radiation between the cloud bottom and the ground The accuracy of the corrected temperature is estimated at ±0 15 °C (Steffen 1982)
The flight path had a total length of 2300 km of which 2000 km were over North Water (Figure 1) NOAA-VHRR infrared satellite images were used for interpolation of the surface temperature between the flight profiles Their grey-scale was calibrated with the aid of the low level infrared thermometry From November 1978 until March 1979 and from December 1980 until March 1981, a total of fourteen low level remote sensing flights were carried out The flight dates were chosen so that different
meteorological circulation patterns over North Water and its sourroundings were represented
Surface temperature distribution
Based on the surface temperature averaged over 20 km and with the aid of NOAA-VHRR infrared-images, fourteen surface isothermal maps were drawn, of which two are presented in Figure 2
The isothermal maps indicate a temperature increase of 10 °C to 15 °C from west to east in the northern Baffin Bay and in Smith Sound The highest sea surface temperatures are located in Smith Sound, west of Cape Alexander Their range of -1°C to -15QC for the 20 km means is 20 °C warmer than the surrounding fast ice areas This temperature anomaly was observed on all flight missions for the two winters 1978/79 and 1980/81 The area

Fig. 2. Isothermal maps of the North Water region base on low level infrared thermometry and NOAA-VHRR satellite interpretation, of the temperature anomaly for values higher than -5°C varied up to 5000 km-2, whereas no systematic decrease in areas was noticed during the winter (Table 1)
Table 1. Area Of The Temperature Anomaly West Of Cape Alexander During Winter 1978/79 And 1980/81 For Values Higher Than -5°C

Another, but less pronounced, temperature anomaly is found in the vicinity of the Carey Islands During the winter 1978/79 this anomaly occurred only sporadically A third temperature anomaly is situated in the Lady Ann Strait, south of Coburg Island Its dimension was less than 20 km in diameter and is therefore not clearly seen on the isothermal maps
Ice conditions
A method was developed for calculating ice thickness based on the radiometrie surface temperature and air temperature (Steffen 1984) This method enables one to estimate the ice thickness up to 50 cm Based on this method, the classification of these ice types was made along the flight profile - ice free, dark nilas, light nitas, grey ice, grey-white ice and white ice Comparison of the thermal ice classification with the visual evaluation which was based on grey-tones of the aerial images, showed a deviation of only 3% From the profile measurements of the two winters 1978/79 and 1980/81, the following conclusion can be made: young ice, nilas and the ice free areas covered more than 50% of North Water in the months November to February During this period, grey-white ice with an ice thickness of 15 to 30 cm was dominant A large ice free area of 17% of the entire profile length was recorded only once, whereas on all the other flights only a few percent of ice free area was measured In March, the last month of the investigation, white ice was dominant
Warm water ceils
The existence of warm water cells was discovered along the flight profile The water surfaces with temperatures ranging from -1 5°C to -0 1 °C were located in North Water mainly along the Greenland coast, in the vicinity of Wolstenholme Island, the Carey Islands and in Smith Sound On the Canadian side these were found in Lady Ann Strait The diameter of the warm water cells varied from a few hundred meters to 30 km The frequency distribution showed a maximum occurrence in the temperature range from -1 0°C to -0 8 °C for December and January Frequency of occurrence of warm water cells decreased towards spring A detailed analysis of the regional distribution and the seasonal variation of the warm water cells is given in Steffen (1984) These measurements are evidence of upwelling warmer water, presumably of Atlantic origin, brought from the depth to the surface
HEAT EXCHANGE
The method for heat exchange calculation for North Water is described in detail in Ohmura (1976b) Seasonal change in global radiation on North Water follows the common trend for the Arctic, in that global radiation is larger in spring than in autumn, when the months of similar solar elevation are compared This is due to the higher surface albedo in spring The albedo of the surface of North Water in February, the month of the return of
TABLE 2 SUMMARY OF MONTHLY AND ANNUAL RADIATION COMPONENTS FOR NORTH WATER (MJM2,MO-1, MJM-2’YR -1) (DATA FROM OHMURA I976B)
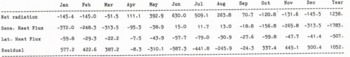
Table 2. Monthly And Annual Heat Balance On The Surface Of North Water(Mjm-2Mo-1, Mjm-2Yr-L ) (Data From Ohmura 1976B)
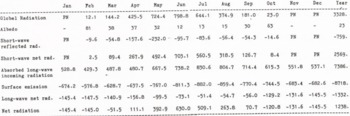
Table 3. Monthly And Annual Heat Balance On The Surface Of North Water (MJM2 MO1, MJM2 YR1) (DATA FROM OHMURA 1976B)
the sun, is so high that it is not much different from other regions in the Arctic This is not only due to the higher sea ice concentration, but also due to the higher albedo of the open water surface for lower solar elevation Although the sea ice concentration does not change significantly in the following two months, in March and April, the increase in solar elevation alone causes the substantial decrease in the albedo of the open water surfaces, resulting in a mean albedo of approximately 38% for the entire polynya This value is about half of the surface albedo in the Central Polar Ocean and becomes the main reason for the positive net radiation already in April
Long-wave radiation shows two distinctive regimes in the year During the winter period between October and April, it is, on an average, -5 MJm2 d1 The long-wave net radiation increases rapidly in May and keeps a relatively high value of -2 MJm2 d2 until September The winter value is mainly due to the large energy loss through the emission from the warm surface and the summer value is mainly caused by the large incoming radiation due to the larger cloud amount
Because of the low surface albedo and the larger long-wave net radiation in summer, net radiation in this region ranges between two and three times that for the Central Polar Ocean During the winter, however, larger cloud amount keeps the effective radiation loss of the surface only slightly higher than the pack ice regions The total radiative energy gain of the surface between April and September amounts to 1978 MJm2, whereas the total loss between October and March is only 740 MJm2 Consequently, an annual net radiation of 1238 MJm2 was received at the surface This is the largest annual net radiation within the Arctic Circle and comparable to that for the Norwegian Sea between Iceland and southern Norway
The surface energy balance on the North Water is characterized by distinct winter and summer regimes In winter a large amount of energy is carried by the sea water, more than half of which is used for direct heating of the overlying atmosphere Since the polynya is a seasonal phenomenon prevailing in cold months, the energy exchange in the winter regime is described below
The supply of heat from the sea water begins in October The supply increases steadily and reaches its maximum in January During the six months between
October and March the subsurface heat supply runs at 15 MJm2 d1 At the height of the winter in January, the rate peaks at 19 MJm2 d1 These values are slightly higher than those for the Norwegian Barents Sea evaluated by Vowinckel and Orvig (1966)
The rate of the sea ice formation in the region of North Water is being investigated through remote sensing missions and sea ice thickness measurements The supply of heat by refreezing is estimated at most at 3 MJm2 d1 The remaining 12 MJm2 d1 or more must be withdrawn from the enthalpy in the sea water During the same period, the release of enthalpy from the sea water is estimated at 3 0 to 3 3 MJm2 d1 for the pack ice region in the Central Polar Ocean (Vowinckel and Orvig 1966) and also for most of Baffin Bay (Walmsley 1966) Therefore, the difference in heat release by the sea water between the North Water and other ice-covered sea surfaces in the Arctic is in the order of 9 MJm2 d1
CONCLUSIONS
In contradiction to earlier reports, the surface of North Water is very rarely open in winter The surface is covered by new and young ice and lacks first year ice until March The average sea surface temperature is about 20 °C higher than that of the surrounding fast ice The warmer, hence ice-poor areas were found in Smith Sound, Lady Ann Strait and around the Carey Islands The temperature in Smith Sound tends to be warmer on its eastern half, ie nearer to Greenland Open water cells at above freezing temperature were often found in the new ice rich area and located most frequently along the Greenland coast The surface temperature of such cells ranged from -1 5 C to -0 1 °C with the highest frequency between -1 0°C and -0 8 °C
The surface of North Water receives heat from the sea water during the six winter months between October and March at the rate of 15 MJm-2 d-1 The heat flux reaches the years maximum of 19 MJm-2 d-3 in January Twenty percent of the oceanic heat flux is due to the freezing of sea water and the remaining 80% is due to supply of enthalpy from the warmer sea water The latter is therefore, the main heat source and is about 9 MJm-2 d-1 larger than in ice covered arctic seas Because of this supply of oceanic heat, the surface of North Water is kept from becoming solidly frozen over The exact océanographie
mechanism of the heat supply is still unknown The discovery of warm water cells, however, suggests the existence of a number of convective cells at least in the layer near the surface
ACKNOWLEDGEMENTS
Generous logistic support was provided by Polar Continental Shelf Project of Department of Energy, Mines and Resources of Canada through Dr G Hobson Financial support for this work was provided by Government of Canada (Contract No OSU76-00151), US National Science Foundation (Contract No DPP-7826132), Swiss National Science Foundation (Contract No 2 807-0 77) and Petro Canada, LDT, Calgary, Canada


