


INTRODUCTION
Antarctic is the strongest heat sink on earth. Although radiational cooling occurs in the free atmosphere the main sink is at the snow surface. The primary process is the negative net radiation balance which consists of shortwave and longwave radiation, and the sensible heat flux compensating it. Terrestrial longwave radiation depends on the surface temperature which is determined by the heat balance.
In this paper, the characteristics of the heat balance in summer and winter season on the snow surface at Mizuho Station will be reported. Mizuho Station (70°42’S, 44°20’E; 2230 m a.s.1.) is located in the katabatic wind ione in East Antarctica. During the year 1979-1981, micrometeorological and radiation observations were made continuously under the Japanese POLEX-South project. Two periods were selected for analysis; 27 June to 20 July for winter, and 12 to 19 December for summer in 1980.
THE SYSTEM AND SITE OF OBSERVATION
Observations were made at Mizuho Station (Figure 1). In the analysis aerological data taken at Syowa Station were used. The data reported here were obtained as follows. Profiles of wind speed and air temperature were measured on a 30 m tower. Radiative components were measured at a surface away from the tower and also at the tower top. Snow temperatures were measured down to 10 m depth. Dew point temperature was measured at a height of 1.5 m. Details of the observation systems can be found in previous papers (Mae and others 1981; Kobayashi and others 1982). The

Fig. 1. The positions of Mizuho Station and Syowa Station.
data presented in the present paper are those obtained in 1980 (Ishikawa and others 1982; Ohata and others 1981; Ohata and others 1983).
METHOD OF CALCULATION
Heat balance at the snow surface without melting can be written as follows:

where Q NR - net radiation; Q SW? Q SW↟ g’obal and reflected shortwave radiation; Q LW,Q L = atmospheric and terrestrial radiation; Q C = sensible heat flux; Q SW, = latent heat flux; QC = heat conduction to sub-surface snow layer; a = albedo. QSW? was zero in the two
months centered at the summer solstice. All components excluding QSW↟ T were calculated independently for every hour. Heat flow towards the surface is taken as positive.
Sensible and latent heat flux
QS and QL were calculated from the vertical profiles of wind speed u, potential temperature Θ and specific humidity s. In determining the diffusion coefficient, log-linear profiles were assumed, and applied to the profiles, i.e.


where u = wind speed; θ = potential temperature; u*= friction velocity; k = Karman constant; L Monin-Obhukov length; α α = coefficents; z : height.
Table 1. Maximum Height Of The Measured Level Used For Log-Linear Profile Application, Classified By Ri Number.


Fig. 2. Dailv and mean values of heat balance components QNR, QS, QLL and QC in winter (27 June - 20 July 1980).
When the bulk Ri number between 2 and 30 m exceeds 0.10, the wind speed profiles failed to follow the log-linear profile (Ohata and others 1982). The maximum heights for obtaining u*, Q*,α, α and L in Equations 2 and 3 were determined from the Ri number of the whole layer, that is between 2 and 30 m, as is shown in Table I. Diffusion coefficient of sensible heat

The diffusion coefficient for water vapor K E was taken equal to K H Q S and Q L were obtained from the gradient of potential temperature θ at 4 m level, and specific humidity s at two levels, 1.5 m and surface, ie


where p, C and ι are density of air, specific heat at constant pressure and heat of sublimation respectively, α and α in Equations 2 and 3 appeared to vary widely. They were frequently larger than the values obtained by Businger and others (1971) and other workers.
Shortwave and longwave radiations
Values for Q SW ? Q LW and QLW↟ were obtained directly. Measurements of QSW↟ were also made, but due to snow drift deposition nearby the observation site, the value QSW showed irregular variation and could not be judged to be representative of this area. In the present analysis, QSW↟ was calculated by adapting a = 0.770, which is the mean value of December 1979 (Yamanouchi and others 1981) and December 1980 (Ishikawa and others 1982).
Conduction into snow
Snow temperatures were measured at 8 levels down to 10 m. The change in the temperatures were used for the calculation of QC The density of the snow was assumed to be 400 Kg/m-3.
HEAT BALANCE IN WINTER AND SUMMER
Winter
Figure 2 shows the daily heat balance for 27 June to 20 July. For the whole period Q NR was -77.96 MJ/m-2 (-37.6 W/m-2), and this was compensated mainly by

Fig. 3. Three-hourly variation in heat balance components for 7-14 July. Surface meteorological elements (wind speed, air temperature, cloud amount) at Mizuho Station and 600 mb wind and air temperature data at Syowa Station are also shown.
QS, which was 76.17 MJ/m-2 (36.7 W/m2). QC was 5.38 MJ/m(2.5 W/m-2). The net flow of water vapor was positive, that is downwards, but QL was three order of magnitude smaller than QS. Radiation loss QNR was compensated almost completely by sensible heat. The variation from day to day show that QNR was negative and QS was positive throughout the period, but QC took both signs.
Factors which determine the variation of the heat fluxes at the surface will be discussed now. The variation of the heat balance in winter is said to be determined by cloud amount, upper air and air temperature conditions. The monthly average cloud amount in tenths was low as 3.4 for June and 2.5 for July. In Figure 3 the variation of each heat balance component and meteorological element at Mizuho and also the 600 mb level wind and air temperature at Syowa are shown. During this period it was overcast only on the 7th, The highest QNR was realized on 7th when there was cloud cover, and on other days it varied from 0.20 to -0.60 MJ/m2 while the cloud amount was small. QS varied according to the wind speed but on the 7th it followed the variation in the net radiation term effected by the cloud cover. It seems that the general trends in Q NR, Q S and Q C were realized through variation in the strength of the katabatic wind. This wind is mainly determined by the synoptic scale pressure pattern and strength of the temperature inversion. The upper air at Syowa showed a cyclic change. When the wind at 600 mb is considered as geostrophic wind, it can be said that there was strong SE to NW pressure gradient from 6th to 9th and strong NW to SE gradient from 11th to 12th. The former was in the direction of the katabatic force and strong surface winds were realized. The latter was opposite and surface wind decreased, causing Q to decrease. As a result the air temperature lowered. The absolute value of Q NR was smallest when wind was weak and air temperature was low. Q C seemed to follow these variations.
Summer
In summer, Q SW? is large. The heat balance is mainly determined by this component. In Figure 4, the daily balance of the components is shown for the period of 12 to 19 December. These days were selected because of the good precision in the data. For the whole
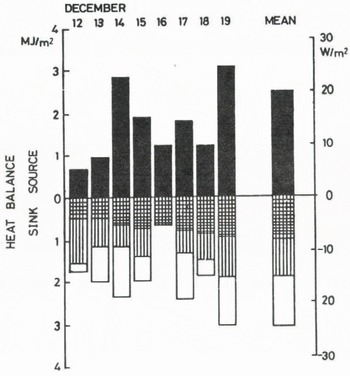
Fig. 4. As Fig.2, but for summer (12-19 December).
period, Q NR was 13.76 MJ/m2 (19.9W/m-2), Q S; -5.09 MJ/m2’(-7.4W/m2), Q L; -5.36 MJ/m2 (-7.8 W/m2) and Q C; -6.35 Ml/mî(‘635V//m2). Q NR varied from 0.60 to 3.11 MJ/m2 according to the weather. The only heat source was Q NR having a lower absolute value than the heat sink components. The three terms Q S, Q L and Q C were negative and of nearly the same value. QNR is sensitive to a little change in albedo of the surface, as Q SW? was high as 35 MJ/m2 per day.
DISCUSSION
In the present calculation, winter heat budget showed a good balance between sources and sinks. The method of calculation of the diffusion coefficient seemed to work reasonably well at this site. However, the summer budget was not in good balance which may be due to the delicate balance of radiation and the
176
small air temperature gradient which gave rise to errors in QS and QL
The amount of condensation and sublimation shown by QL in the heat budget is important in the mass balance of the ice sheet. In the winter, it was 0.049 MJ/m2 for 24 days and in summer it was -5.36 MJ/m2 for S days. This means 0.001 kg/m2 of condensation per day in winter and 0.25 kg /m2 of sublimation per day in summer. Fujii (1979) had measured the actual condensation and sublimation on the snow surface at Mizuho Station in 1977. His values for the corresponding seasons were 0.02 kg /m2 of condensation and 0.65 kg/ m2 of sublimation per day respectively. The direction of the flow of water vapor is the same, but the absolute values are different. In winter, the amount of condensation in the present work is one order smaller than Fujii’s. Although QL, was one order more, it will not change the whole characteristics of the heat balance as this term will not be more than 1% of QS This low value of QL is due to the low water vapor content under low temperature. The difference in summer is probably due to the fact that Fujii’s measurement was made on a glazed surface where albedo a is a little smaller.
In the past many studies have been made on the heat balance of the Antarctic surface. Weiler (1981) made a summary. At Mizuho QNR was -38 W/m2, QS was +37 W/m2, QC was +2 W/m2 QC is about the same as other sites, but QNR and QS were large. Much radiation is lost and much sensible heat is supplied from the air. This balance is interesting. Much is due to the strong katabatic wind here, because it maintains a heat flux to the surface, and keeps temperature relatively high. QL is small in the present case, although Mizuho is warmer and the air layer could contain more water vapor. At Mizuho, there is a strong thermocline between 30 and 100 m above surface under katabatic wind condition (Ohata and others 1985). When it reduces, in some cases much hoar frost formed at the top of the tower, but little on the surface. There is a possibility that much latent heat is generated in the lower air layer but not at the surface. For the katabatic wind region there were observation at Charcot (Lorius 1963) at 2400 m, and Pionerskaya (Rusin 1961) at 2740 m. Each component is shown in Table 2. These three stations lie in nearly the
Table 2. Comparison Of Heat Balance Components For Charcot, Pionerskaya And Mizuho In Winter.

same altitude and a relatively strong wind region. Amongst these three, QNR and QS is largest at Mizuho, nearly twice the value of Charcot. This situation seems to occur due to the difference in the surface meteorological elements. The cloud amount is low and also the average wind speed is high. Mizuho is a station where the surface wind is most strongly confined to one single direction. This means that the stability of the katabatic wind is highest here.
The existence of cloud has a significant effect on the variation of heat balance components at Mizuho in winter, but the variation seems to be largely controlled by the behavior of the katabatic wind in relation with the large scale pressure pattern. This should be investigated further.
ACKNOWLEDGEMENTS
The authors would like to thank Mr M Wada of the National Institute of Polar Research, and Mr K Akaeda of Nagoya University for their help in the computer processing of the data. They also thank Mrs M Iwahashi for the arrangement of data and the preparation of the manuscripts.


