


Introduction
Dynamics models are used when the speed of avalanches must be estimated for calculations of impact pressures, and when the runout distances of avalanches are required. Such applications require a knowledge of the friction coefficients in the drag terms of the models.
Centre-of-mass avalanche dynamics models describe the speed V of the centre-of-mass of the avalanche along the incline. The first such model, introduced by Reference VoellmyVoellmy (1955), was extended by K_rner (1976) and Perla and others (1980). The latter, referred to here as the PCM (Perla, Cheng, McClung) model, is a particularly important extension. It enables one to follow the progress of the avalanche over geometrically complex paths between defined reference points (start and stop positions) rather than over a simplistic two-segment avalanche path with its need to estimate the mid-path point of the beginning of deceleration, as prescribed hy Voellmy. Other potential extensions introduced by PCM include the possibility of handling snow entrai notent, centripetal forces, and momentum corrections for abrupt changes in terrain, although these extensions are mainly in advance of any known data on these effects.
The actual drag terms for the Voellmy and PCM models are mathematically identical and coupled similarly so that, although the PCM model is used in the present paper, the general conclusions will apply to Voellmy_s model and K_rner_s work also. Unfortunately, it is not possible to determine values of the friction coefficients for these centre-of-mass models without speed data. When avalanche speed maxima are introduced, however, along with measured avalanche start and stop positions, the solution over the terrain profile gives the friction coefficients uniquely for the PCM model. This not only provides friction coefficients for actual avalanches, but illustrates some important properties of the basic modelling that must be understood before applications are attempted.
THEORETICAL CONSIDERATIONS
The PCM model describes the motion of the centre-of-mass of an avalanche along the avalanche path from start to stop positions. The model contains two friction terms: (1) a speed-independent term which represents the average value μ of sliding friction over the length of the path S0 from start to stop positions, and (2) a term proportional to V2 representing the average value of the turbulent drag over the path length. This term is defined by a coefficient written as a constant ratio of drag D, to mass M, or D/M.
The differential equation governing the motion of the centre-of-mass for the PCM model is:
where dS is an element of path length, g is acceleration due to gravity, and ?(S) is the local slope angle (Fig.l). Since path radius-of-curvature effects are proportional to V2, these may be included in the overall specification of D/M. From Equation (1) it is clear that μ is dimensioni ess whereas D/M is proportional to an analogous turbulent drag coefficient but has dimensions of (length)−1.
The general solution to Equation (1) is:
where C0 is a constant determined by initial conditions.
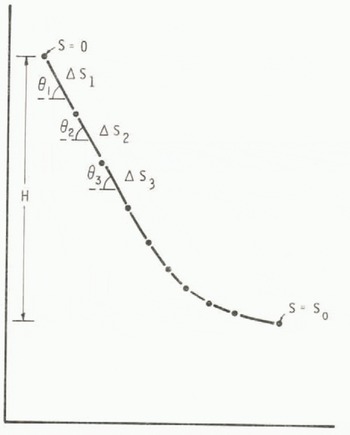
Fig. 1. Schematic of avalanche path broken into segments. The segments are of length ?Sj with a total path length S0 = Si ?Si and the total vertical drop is denoted by H. Each segment (i) is specified by its length and slope angle ?.
To illustrate the properties of the model in relation to some effects found with speed data on geometrically complex avalanche paths, Equation (2) is solved here along the arc of a circular path. The circular path has the advantage that the analytic solution is of simple form. Reference KozikKozik (1962) also studied this problem. Other profiles, such as the parabola, are perhaps better theoretical models of actual avalanche terrain, but no simple analytic solutions are available.
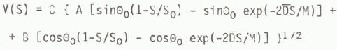
Consider the circular path ?(S) = To (1 - S/So) where ?o is the initial or starting zone angle, and So is the total length of arc along the incline until the valley floor is reached where ?(So) = 0. With V(0) = 0, the solution of Equation (2) is then:
where
and
Now consider stop positions on the incline. Application of the boundary condition V(KSo) = 0 where 0<K<1 gives from Equation (3),
where
Equation (4) gives a relationship between μ, D/M and path parameters where each pair μ, D/M implies a maximum speed. Figure 2 depicts such a relationship for K = l, ?0 = 40° and D/M scaled inversely proportional to total path length S0. K_rner (1981) and Bakkeh_i and others (1981) determined similar relationships for actual avalanche paths.
This analysis indicates that to determine μ and D/M for a given avalanche, an estimate of maximum speed or a similar estimate of speed somewhere along the incline is needed. Otherwise no values can be attached to μ and D/M because an infinite number of pairs is generated by application of the boundary conditions V = 0 at the start and stop positions.
An added result from Equation (4) is that when ![]() and for 0<K<1 and ?0 in the range typical for avalanche paths,
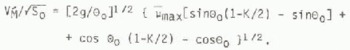
and for 0<K<1 and ?0 in the range typical for avalanche paths, ![]() approaches a maximum value given by
approaches a maximum value given by ![]() where the argument [?0(2-?)/2] represents the average angle along the incline between S = 0 and the stop position S = KS0. Also, sensitivity to D/M is lost in the equations and the expression for maximum speed VM becomes an upper limit value or model speed limit VM, which occurs at S = KS0/2 and is given by:
where the argument [?0(2-?)/2] represents the average angle along the incline between S = 0 and the stop position S = KS0. Also, sensitivity to D/M is lost in the equations and the expression for maximum speed VM becomes an upper limit value or model speed limit VM, which occurs at S = KS0/2 and is given by:
For example, if K = 1, then for the usual range of avalanche starting-zone angles, 30_< 0<65_, the speed limit is in the range ![]() . Similarly, VM can be expressed in terms of vertical drop, H, since for these profiles S0 = 1.45H for T0 = 65_ and S0 = 3.27H for ?0 = 30_ so that
. Similarly, VM can be expressed in terms of vertical drop, H, since for these profiles S0 = 1.45H for T0 = 65_ and S0 = 3.27H for ?0 = 30_ so that ![]() = 2.16 for T0 = 65_ and
= 2.16 for T0 = 65_ and ![]() = 2.08 for ?0 = 30_.
= 2.08 for ?0 = 30_.
Given V(0) _ V(KS0) = 0 and ![]() both constant, _ must be increased as D/M is decreased as Equation (4) and Figure 2 depict. The model speed limit corresponds to the case where sensitivity to the V2 or turbulent drag is lost in the equations and the avalanche must have all of its drag as sliding friction. This is not physically realistic and is forced toward higher values as the maximum speed increases toward VM.
both constant, _ must be increased as D/M is decreased as Equation (4) and Figure 2 depict. The model speed limit corresponds to the case where sensitivity to the V2 or turbulent drag is lost in the equations and the avalanche must have all of its drag as sliding friction. This is not physically realistic and is forced toward higher values as the maximum speed increases toward VM.

Fig. 2. The relation between μ and D/M implied by the conditions V(0) = V(S0) = 0 for a circular path with ?0 = 40_. Maximum speed increases as D/M increases and D/M decreases. The values as D/M → 0 correspond to the high speed limit where ![]() .
.
Another result _from Equation (4) is that given a value of D/M, then _ is very sensitive to the slone angle ?f where the avalanche stops. For example, if D/M = 3/S0 and T0 = 45_, then _ = 0.13 for ?f = 0_, _ = 0.29 for ?f = 9_, and _ = 0.64 for θ f = 18_.
The model speed limits VM are also sensitive to the stop position. Table I gives examples of the model limits as a function of the stop position angle. This table shows that ![]() decline rapidly as the stop angle increases. This is important as many avalanches for which speed measurements were available stopped on relatively steep slopes, and the model speed limits are exceeded in a number of cases by this effect.
decline rapidly as the stop angle increases. This is important as many avalanches for which speed measurements were available stopped on relatively steep slopes, and the model speed limits are exceeded in a number of cases by this effect.
Table 1. Illustration Of The Decrease In VM AND Increase In ![]() WITH INCREASING STOPPING ANGLE FOR A CIRCULAR PATH WITH ?0 = 45_
WITH INCREASING STOPPING ANGLE FOR A CIRCULAR PATH WITH ?0 = 45_

Speed Measurements Of Avalanches
During the winters between 1966 and 1972, avalanche speeds and runout distances were measured on paths with known profiles at Rogers Pass, British Columbia, Canada. The speed measurements were described by Reference SchaererSchaerer (1975) and they represent near maximum speed in the middle portion of the path. The speed data, together with start and stop positions at the tip of the debris and the profile of the entire avalanche path, are sufficient to determine the model friction coefficients of the observed avalanches.
In the model the speeds represent centre-of-mass speeds whereas the observations are actually frontal speeds. It is assumed, however, that the frontal speed is a good approximation of the centre-of-mass speed. Reference SalwaySalway (1978) provided data from Rogers Pass which indicate that this is true in some instances, and later measurements there confirm his conclusions.
The stop position for the model corresponds to that for the centre-of-mass, whereas the field data correspond to the rest position of the tip of the avalanche. This, with the previous theoretical analysis, means that the actual _ values obtained will normally be less than the actual values for centre-of-mass stop positions as the centre-of-mass of the actual avalanche is usually on a steeper slope. Also, this procedure will produce values of D/M slightly higher than those for actual avalanche centre-of-mass positions. These considerations actually enhance the major conclusions of this paper, as shown later.
Determination Of Friction Coefficients
Since the avalanche paths are complex, the velocity profiles have been solved numerically by breaking the paths into segments of length Si and slope angles ?i (Fig.l), as described by PCM. Using this procedure, the solution that best matches the start position, the stop position within _5 m, and the speed measurement at its position along the profile, was found by a trial and error iteration procedure to give the values of _ and D/M. Normally, about ten computer runs were needed to match these data and yield the values of the friction coefficients for each avalanche.
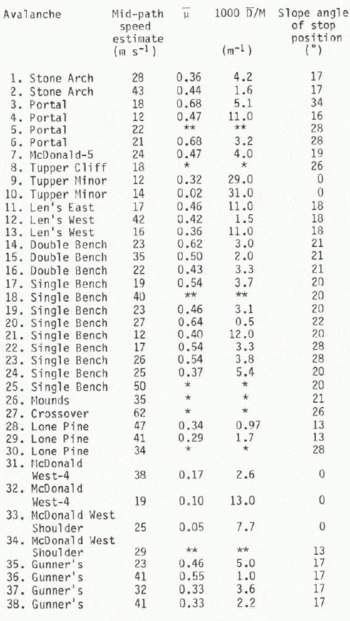
Table II gives the friction coefficients _ and D/M, determined by the procedure outlined above. Some points of note from Table II are: (1) there are a number of events (8, 25, 26, 27, 30) in which the measured speed exceeds the model speed limit, and another group for which the solutions are essentially insensitive to variations in D/M (5, 13, 34), (2) many of the values of u are very high and they often approach expected static values of sliding friction. Given that slab avalanches start on slopes as low as 25_, static values near 0.5 are implied. In the model, _ should depend on the properties of flowing snow and should represent an average value over the entire path. The data in Table II, however, as well as the analytic solutions show that the constraints introduced make u strongly dependent on the stopping angle as well as path characteristics.
Table 2. Friction Parameters For Avalanches
Discussion
The results in Table II can be interpreted, along with the analytic solutions obtained previously, in terms of some conclusions. (1) A number of avalanches, for which measured speeds are presented, were observed to stop on steep slopes with angles higher than 10_. With the model, the speed limit declines rapidly with increasing stopping angle whereas, in actual avalanches, it apparently does not. (2) Specification of the boundary conditions V = 0 at the path end points, implies a relationship between _ and D/M, e.g. Equation (4) (for the circular path) which indicates that as D/M is decreased _ must be increased in order to match the stop position for higher values of maximum speed. Expressions such as this are no doubt unrealistic at the high speed limit when D/M<1/2S0 and many of the data approach or exceed this high speed limit. Relationships like Equation(4) imply that _ increases with increasing maximum speed, which is contrary to the views of some researchers. Reference Voellmyvoellmy (1955) and Reference SchaererSchaerer (1975) imply that _ decreases rather than increases with speed.
Without further data and theoretical work it is difficult to resolve this question but it is possible that expressions such as shown in Equation (4) are physically unrealistic in general, not just at the high speed limit. If so, it is essential that speed data be used to determine the coefficients in the model because application of start and stop boundary conditions al?ng will generate an infinite number of pairs of _ and D/M, of which one pair at most may have meaning. Simply stated, the differential equation implies that _ and D/M are average values for the entire path dependent on the properties of flowing snow, whereas application of V = 0 at the path end points, implies that these drag coefficients are coupled in a specific way and depend sensitively on stopping angle and other terrain parameters. This procedure can produce coefficients different than might be expected from properties of flowing snow.
There are several options available, at present, to deal with these problems. If the restriction of constant _ and D/M is relaxed, it may well be possible to explain the measured field data and produce physically realistic parameter relationships. For example, if _ and D/M were to decrease and increase together as speed increases and decreases then local values of high speed would be possible with perhaps enough friction to stop the avalanche on steep slopes once deceleration begins. This approach, however, complicates the problem. Although it may seem easy to postulate constitutive equations between _ and D/M as functions of speed or path parameters, at present there are not enough data, nor has theoretical work advanced far enough, to know the form of such equations.
Similarly, introduction of a more complex model, such as inclusion of a drag term linear in V to account for viscous drag (Reference SalmSalm 1966), would give a more flexible algorithm. Such a formulation, however, would make it impossible to determine the parameters, uniquely in the model, from existing avalanche speed data and the characteristics of flowing snow. As PCM have indicated, even if the full velocity profile were known all along the incline, it would not be possible to determine the parameters uniquely for models with more than two constant parameters if velocity boundary conditions are adhered to.
Collectively the data, calculations and theory point to some inconsistencies regarding properties of the model when _ and D/M are assumed constant, and what is expected and what actually occurs. If friction is assumed constant over the path, as available data demand, there are at least two options available. One of these was outlined by PCM in terms of a one-parameter model. Another is that with a knowledge of the properties of the two-parameter model and an understanding of actual behaviour, it may still be possible to apply the model for restricted classes of problems in a way that will avoid the pitfalls and inconsistencies. That is, by keeping the properties of the model clearly in mind and separate from the expected properties of flowing snow, it may be possible to use the model judiciously and provide engineering estimates of run-out for certain eventualities. This latter option appears to be a promising approach and will be reported in a future publication. Clearly, this class of two-parameter models cannot be used for all types of avalanches, terrain, and stopping angles as normally applied. The basic simplicity of the models dictates that there are limitations on their validity.
Acknowledgements
Many of the ideas presented are the results of discussions with R Perla, Environment Canada. This paper is a contribution from the Division of Building Research, National Research Council of Canada, and is published with the approval of the Director of the Division.


