


Introduction
Between 1983 and 2012, average global temperature has risen 0.85 ± 0.2°C and future projections anticipate further warming, regardless of actions to mitigate CO2 emission (IPCC, Reference Pachauri and Meyer2014). The rise in global temperature has resulted in significant global ice shrinkage since 1961 (Berthier and others, Reference Berthier, Schiefer, Clarke, Menounos and Rémy2010; IPCC, Reference Pachauri and Meyer2014). As global temperatures continue to rise, with few exceptions, glaciers will continue to retreat, and some will disappear altogether (Radić and Hock, Reference Radić and Hock2011; Marzeion and others, Reference Marzeion, Cogley, Richter and Parkes2014; Radić and others, Reference Radić2014). The impacts of climate change and glacier shrinkage pose a critical threat to mountain and coastal communities worldwide as freshwater resources dwindle, oversteepened slopes and proglacial basins destabilize and fail catastrophically, and sea levels rise. Identifying the signatures of how glaciers and landscapes respond to rapid climate change is therefore critical to predicting the magnitude of these hazards in the coming century.
It is generally accepted that glaciers melt faster and speed up when in contact with warm, salty, subsurface ocean water (IPCC, Reference Pachauri and Meyer2014). Submerged ice in ocean waters melts at rates up to 1 km a−1 at the termini of temperate tidewater glaciers (e.g. Motyka and others, Reference Motyka, Dryer, Amundson, Truffer and Fahnestock2013), depending on the water temperature, the water depth at the ice front, and the discharge of subglacial runoff at the terminus. As a tidewater glacier begins to retreat and thin, the ice accelerates, and sliding rates increase (e.g. Rignot and Kanagaratnam, Reference Rignot and Kanagaratnam2006, Bevan and others, Reference Bevan, Luckman and Murray2012), thereby doing more erosive work on the bed and increasing yields (Koppes and Hallet, Reference Koppes and Hallet2006; Koppes and others, Reference Koppes2015). Where glaciers slide, they produce large volumes of sediments and transport them to the ice margin where they accumulate (Koppes and Hallet, Reference Koppes and Hallet2006; Cowan and others, Reference Cowan2010; Nick and others, Reference Nick, Van der Veen, Vieli and Benn2010; Koppes and others, Reference Koppes2015). As glacial erosion generally scales with basal sliding speeds (e.g. Hallet, Reference Hallet1979; Hallet and others, Reference Hallet, Hunter and Bogen1996; Humphrey and Raymond, Reference Humphrey and Raymond1994; Iverson, Reference Iverson2012; Herman and others, Reference Herman2015; Koppes and others, Reference Koppes2015), the rates of basin-averaged erosion, sediment production and accumulation at ice margins will vary as the rate of glacier shrinkage and retreat varies.
It is now well documented that both terminus retreat rates and sliding velocities of Alaska's tidewater glaciers, much like outlet glaciers in Greenland and Patagonia, have increased in response to regional warming (e.g. Arendt and others, Reference Arendt, Echelmeyer, Harrison, Lingle and Valentine2002; Kienholz and others, Reference Kienholz2015; Altena and others, Reference Altena, Scambos, Fahnestock and Kääb2019), mostly due to changes in force balance at the calving front driven by thinning and melting (e.g. O'Neel and others, Reference O'Neel, Pfeffer, Krimmel and Meier2005; Rignot and others, Reference Rignot, Koppes and Velicogna2010), both of which are controlled by climate. It has also long been recognized that the production of sediments by glacial erosion are primarily driven by basal sliding speeds and the effectiveness of the subglacial hydrologic system to transport and evacuate the debris, the fluxes of which can be very large and can far outpace fluvial erosion rates from basins of similar size (e.g. Hallet and others, Reference Hallet, Hunter and Bogen1996; Koppes and Montgomery, Reference Koppes and Montgomery2009; Beaud and others, Reference Beaud, Venditti, Flowers and Koppes2018).
Rapid ice loss not only has a marked effect on glacier dynamics, it also drives changes in in sediment connectivity in landscapes exposed during retreat. As a glacier thins, base level falls for tributary streams, which triggers an incisional response in their lowest reaches as transport capacity exceeds the sediment supply rate, lowering the gradient between the headwaters and river mouth. In many glaciated watersheds, unconsolidated tills and glaciofluvial deposits that have accumulated along the lateral margins of the glacier provide large sources of easily mobilized sediment, resulting in rapid incision rates and elevated sediment yields from tributary valleys. Unconsolidated deposits in the glacier forefield may also be easily mobilized by proglacial streams; they may also lower stream gradients in the foreland and result in infilling and emergence of submerged termini (e.g. Marren, Reference Marren2005; Jansen and others, Reference Jansen2011). The sudden shift in regime from glacial to ‘paraglacial’, i.e. those processes, landforms and sediments conditioned by glaciation, has been hypothesized to result in elevated sediment yields from landscapes undergoing and following rapid deglaciation (Church and Ryder, Reference Church and Ryder1972; Harbor and Warburton, Reference Harbor and Warburton1993; Ballantyne, Reference Ballantyne2002; Knight and Harrison, Reference Knight and Harrison2014, Reference Knight and Harrison2018), and has been demonstrated to produce significantly higher yields than from denudation of landscapes with no history of glaciation (Church and Ryder, Reference Church and Ryder1972; Church and Slaymaker, Reference Church and Slaymaker1989; Hallet and others, Reference Hallet, Hunter and Bogen1996; Ballantyne, Reference Ballantyne2002; Koppes and Montgomery, Reference Koppes and Montgomery2009).
Sediment yields to the glacier forefield are presumed to decrease as the paraglacial period progresses, but intermittent, episodic pulses of sediment can temporarily increase sediment fluxes due to transient processes which increase sediment connectivity (Ballantyne, Reference Ballantyne2002; Meigs and others, Reference Meigs, Krugh, Davis and Bank2006; Heckmann and others, Reference Heckmann2012; Lane and others, Reference Lane, Bakker, Gabbud, Micheletti and Saugy2017; Knight and Harrison, Reference Knight and Harrison2018). These pulses of sediment can be sourced from stochastic processes, such as the triggering of a landslide due to changes in internal stresses of bedrock and debuttressing of valley walls as ice thins and retreats (e.g. McColl, Reference McColl2012; Uhlmann an others, Reference Uhlmann, Korup, Huggel, Fischer and Kargel2012; Higman and others, Reference Higman2018), or increases in headward erosion of sidewall tributaries as base levels fall (Bishop and others, Reference Bishop, Hoey, Jansen and Artza2005; Schiefer and Gilbert, Reference Schiefer and Gilbert2007). They can also be due to episodic increases in meltwater discharge, such as due to a jökulhlaup or glacial lake outburst flood (e.g. Milner and others, Reference Milner2017; Knight and Harrison, Reference Knight and Harrison2018). Increased sediment yields in a deglaciating basin can have a variety of effects on downstream watersheds, both positive and negative. Larger sediment loads in rivers can have potentially damaging effects on water quality and aquatic habitat (Huss and others, Reference Huss2017). Conversely, retreating ice masses may also play a crucial role in providing bio-essential nutrients to ecosystems downstream (Hawkings and others, Reference Hawkings2017). River morphology is also intricately tied to sediment load and character, with any changes in sediment inputs leading to vertical and/or lateral adjustment in river channels (Marren, Reference Marren2005; Church, Reference Church, Rowiński and Radecki-Pawlik2015). These changes can also lead to an increase in the size and frequency of flood events (Curran and others, Reference Curran, Loso and Williams2017; Huss and others, Reference Huss2017).
The shrinkage of glaciers worldwide provides a unique opportunity to observe and quantify the changing fluxes of sediment and the development and early evolution of paraglacial landscapes in real time. The impacts of retreating glaciers on the new landscapes exposed as a result of their retreat has not been explored in much quantitative detail to date, with the exception of a few studies that have looked at sediment connectivity in an alpine landsystem (Jansen and others, Reference Jansen2011; Heckmann and others, Reference Heckmann2012; Lane and others, Reference Lane, Bakker, Gabbud, Micheletti and Saugy2017). This study aims to quantify and document the evolution of a landscape at the onset of rapid deglaciation, in the hopes of shedding more light on the geomorphic impacts of contemporary climate change. Here, we present a comparison of the temporal evolution of sediment yields, and hence erosion rates, from both a rapidly retreating tidewater glacier and the adjacent, glacially conditioned watersheds. We document and quantify the time-varying sediment yields and basin-averaged erosion rates from Tyndall Glacier, a retreating tidewater glacier in Taan Fjord, Icy Bay, SE Alaska, and from tributary watersheds that have delivered sediment to the recently exposed fjord, in order to produce a complete picture of the magnitude of relative contributions from fluvial, glacial and mass wasting processes in the evolution of an actively deglaciating landscape. We characterize the retreat history of Tyndall Glacier since 1957, and the resulting glacial sediment yields and erosion rates, previously published for the glacier from 1961 to 1999 (Koppes and Hallet, Reference Koppes and Hallet2006) and updated until 2014 here. The shrinkage of the glacier triggered the unraveling of tributary watersheds, as well as a major landslide and resultant tsunami at the glacier terminus in 2015 (Dufresne and others, Reference Dufresne2017; Higman and others, Reference Higman2018). The growth history of the fan-deltas and the landslide, and the time-varying sediment yields and erosion rates for each tributary basin as the terminus of Tyndall Glacier retreated past their outlets, are estimated and compared to that produced by the glacier itself. These tasks were undertaken to determine the magnitude of the various denudation processes during the early stages of the paraglacial era in a landscape undergoing rapid glacier retreat.
Study area and background
The Icy Bay region includes high relief with the highest coastal mountain in the world, Mount St. Elias (elevation 5488 m). The high relief and immense precipitation from the Gulf of Alaska results in some of the largest temperate glaciers in the world found in this region. Mean annual temperatures in the region have increased 1.4°C since 1949 (SNAP, 2019), resulting in rapid retreat of most of the ice masses in the past half century (Arendt and others, Reference Arendt, Echelmeyer, Harrison, Lingle and Valentine2002; Kienholz and others, Reference Kienholz2015).
Tyndall Glacier originates off the southwestern face of Mount St. Elias and currently extends just 19 km to terminate in Taan Fjord (Koppes and Hallet, Reference Koppes and Hallet2006; Enkelmann and others, Reference Enkelmann2015) (Fig. 1). Tyndall Glacier retreated a total of 17.25 km in just 30 years (1961–1991) following its initial separation from the main trunk glacier in Icy Bay in 1961 (Koppes and Hallet, Reference Koppes and Hallet2006; Meigs and others, Reference Meigs, Krugh, Davis and Bank2006). Retreat began at a rate of ~600 m a−1 between 1961 and 1969 and slowed to 150 m a−1 from 1969 to 1983 after encountering a shallow bedrock sill (Koppes and Hallet, Reference Koppes and Hallet2006). The glacier then entered the deeper northern basin of the upper fjord and retreated at an increased rate of up to 1.6 km a−1 until 1991 where the terminus stalled at a sharp bedrock constriction associated with the Chaix Hills thrust fault (Koppes and Hallet, Reference Koppes and Hallet2006; Meigs and others, Reference Meigs, Krugh, Davis and Bank2006). Since 1991, the terminus has stabilized at this topographic constriction, fluctuating within several hundred meters of its current position.

Fig. 1. Overview of Tyndall Glacier and Taan Fjord in Icy Bay, SE Alaska (base image from Copernicus Sentinel Data (2018)). Bathymetry in the fjord (in gray shading) from Hauessler and others (Reference Haeussler2018). Past annual termini positions of Tyndall Glacier are indicated by the black lines and labels. The tributary basins to Taan Fjord are outlined in red. The terrestrial extent of the October 2015 landslide is outlined in light yellow.
Taan Fjord has grown since its initial emergence in 1961 to include eight non-glacial tributary watersheds that terminate in the fjord (Fig. 1). The rapid retreat of Tyndall Glacier caused base-level to fall at each of the basin outlets, triggering incision in their lower reaches. The volume of sediment contained within the fan-deltas at their outlets therefore provides a record of the minimum amount of sediment evacuated from each tributary basin since fan-delta formation began.
The surficial geology in this region consists of weakly lithified sedimentary rock derived from the ongoing collision of the Yakutat microplate with North America (Plafker and others, Reference Plafker, Moore, Winkler, Plafker and Berg1994; Chapman and others, Reference Chapman2012). Taan Fjord, the eastern arm of Icy Bay, is in the hanging wall of the Malaspina thrust fault system (Chapman and others, Reference Chapman2012). The majority of the recently deglaciated fjord south of the current terminus has been cut into the Yakataga Formation, a tectonically uplifted, massive glacimarine sedimentary sequence dating as far back as 5.5 Ma (Lagoe and others, Reference Lagoe, Eyles, Eyles and Hale1993). The bedrock constriction at the current terminus of Tyndall Glacier marks the east-west trending contact between the Yakataga Formation to the south, and the Poul Creek and Kulthieth Formations to the north, metasedimentary lithologies that form the Mount St. Elias massif, along the Chaix Hills Thrust fault (Fig. 3b). The Chaix-Hills Thrust has a GPS-determined slip rate of ~17 mm a−1 and the St. Elias Orogen experiences an astonishing ~33 mm a−1 of convergence (Elliott and others, Reference Elliott, Freymueller and Larsen2013). These high strain rates lead to uplift rates in the region that rival that of the western Himalaya (Bruhn and others, Reference Bruhn, Pavlis, Plafker and Serpa2004), with recent thermochronological data showing that rocks in Taan Fjord have been uplifting rapidly at a rate of 2–5 mm a−1 for at least the last few million years (Enkelmann and others, Reference Enkelmann, Zeitler, Pavlis, Garver and Ridgway2009; Reference Enkelmann2015).
In October 2015, a 76 M m3 section of unstable rock from the Daisy tributary catchment collapsed into Taan Fjord and partially onto the terminus of Tyndall Glacier (Fig. 2), triggering a tsunami wave that was documented to be 192 m high at its maximum, and exceeded 50 m at the mouth of the fjord (Higman and others, Reference Higman2018). The tsunami stripped the vegetation and some of the alluvial deposits from almost all of the low-lying fans in the fjord, as well as along the fjord walls to within several tens of meters of sea level.

Fig. 2. Photo of the October 2015 landslide scarp and subaerial deposits. The terminus of Tyndall Glacier, partially covered in landslide debris, is visible in the foreground. (Photo credit: Ruedi Homberger.)
The recent retreat of Tyndall Glacier, combined with relatively weak sedimentary rock outcrops, high relief and rapid tectonic deformation, all preconditioned the slope for failure (Higman and others, Reference Higman2018). One of the key triggering mechanisms for the 2015 landslide and induced tsunami was glacial debuttressing on the failure slope following the retreat of Tyndall Glacier and one of its western tributaries, Daisy Glacier (Grämiger and others, Reference Grämiger, Moore, Gischig, Ivy-Ochs and Loew2017; Higman and others, Reference Higman2018). This buttressing effect was lost with the loss of ice volume in the fjord, further weakening the weak sedimentary bedrock along the Chaix Hills Thrust at the head of the fjord.
Methods
Sediment yields and basin-averaged erosion rates for the eight tributary basins, Tyndall Glacier, and the October 2015 landslide were sought to compare and assess the magnitude of geomorphic change attributable to fluvial, glacial and mass-wasting processes in the rapidly deglaciating environment of Taan Fjord. Quantifying the landscape response involved capturing the terminus retreat and surface thinning of Tyndall Glacier, and estimating the amount of sediment evacuated from both the glacier and from each of the non-glaciated tributary basins exposed during retreat. The contribution of sediment to the fjord by the landslide has been previously described (Dufresne, and others, Reference Dufresne2017; Haeussler and others, Reference Haeussler2018; Higman, and others, Reference Higman2018), as have the sediment yields from Tyndall Glacier between 1961 and 1999 (Koppes and Hallet, Reference Koppes and Hallet2006), during its active phase of retreat. Here, we focus on the methods used to determine glacier elevation changes during retreat, update the erosion rates and sediment yields from the glacier to 2014 during a period of relative terminus stability, and determine the rate and amount of sediments contributed from each of the tributary basins following the rapid retreat of Tyndall Glacier.
Change in base level
In this study, large-scale aerial photographs taken of Tyndall Glacier and Taan Fjord by the US Geological Survey (USGS) in 1957, 1969, 1973 and 1986 were compared with a 5m IfSAR digital elevation model (ArcticDEM) and 2016 LiDAR imagery (from University of Alaska Fairbanks) of Taan Fjord to gage the ice elevation at the outlet of each tributary basin at various times over the past 50 years. Information on the historical photos and how they were used to interpret changes in the glacier surface and terminus position since 1957 are presented in the Supplementary Materials. We assume that the ice surface at the outlet at each time step represents base-level for each tributary stream until the glacier terminus retreated completely past the tributary outlet and base-level became sea level. The changes in the base level over time were used to estimate the rate of base level fall for each tributary.
Glacier erosion rates
To calculate the annual sediment yields and basin-averaged erosion rates from Tyndall Glacier between 1961 and 2014 (prior to the landslide and tsunami), we follow the methods described in Koppes and Hallet (Reference Koppes and Hallet2006), with updated parameters estimating the seismic velocities and bulk densities of glacimarine sediments and bedrock following Love and others (Reference Love, Hallet, Pratt and O'Neel2016) and Haeussler and others (Reference Haeussler2018) (see Supplementary Materials for more details regarding the methods and error analysis). To determine the total volume of glacimarine sediment deposited in the fjord since 1961, we use the thickness of the fjord bottom sediments imaged using acoustic radio-echo sounding from a 750 Hz bubble pulser in 1999, and again in 2016 using a 500-J DuraSpark sparker collected by the US Geological Survey (USGS) research vessel Alaskan Gyre in August 2016 (Haeussler and others, Reference Haeussler2018). The velocity of sound in sea water (1500 m s−1) was used to approximate unconsolidated glacimarine sediments, in order to convert the top and bottom of the post-retreat sediment package into depth and calculate sediment thickness from the seismic profiles (Cowan and others, Reference Cowan2010; Love and others, Reference Love, Hallet, Pratt and O'Neel2016). The total sediment volume was converted to annual sediment yields (Q s), using the model of glacimarine sedimentation as a function of sediment delivery and glacial retreat described in Koppes and Hallet (Reference Koppes and Hallet2002) and modified by Love and others (Reference Love, Hallet, Pratt and O'Neel2016). Finally, basin-averaged effective erosion rates for the glacier and its supraglacial catchment were determined using the following equation:

where $\dot{\!E}$ is the basin-averaged erosion rate, ρ R is the density of bedrock, ρ S is the density of the unconsolidated glacimarine sediments, Q s is the annual basin sediment yield and A is the glacier basin area. For the 154 km2 catchment, we used the bedrock density ρ R of 2350 kg m−3 assumed for the metasedimentary rocks typical of the region, including the Yakataga Formation (Mankemthong and others, Reference Mankhemthong, Doser and Pavlis2013; Haeussler and others, Reference Haeussler2018), and an average dry bulk density ρ S of 1300 kg m−3, representative of glacimarine sediment collected in fjord settings (Love and others, Reference Love, Hallet, Pratt and O'Neel2016).
We note that in calculating erosion rates from annual sediment yields into the fjord, we are assuming that sediment connectivity is high and hence storage effects are negligible, in both the glaciated catchment (i.e. subglacial, lateral and supraglacial storage in the trunk glacier and in its tributaries are short-lived) as well as in the tributary watersheds. We acknowledge that transient storage may play a confounding role in many source-to-sink sedimentary systems, decreasing or delaying the signal between the geomorphic driver (in this case, subglacial and headwall erosion by the glacier) and the resultant sediment fluxes at the glacier snout (e.g. Jaeger and Koppes, Reference Jaeger and Koppes2016). However, for Tyndall Glacier, we argue that storage effects cannot be playing a significant role, given the volume of sediment delivered to the fjord. From the historical imagery, we estimate that the catchment above the terminus of Tyndall Glacier including tributaries that have become detached from the main trunk was ~79 % glacierized in 2017, and over 90 % glacierized in 1957, and that slopes in the parts of the catchment that are no longer ice-covered are relatively steep, averaging 26°. Hence, there is little opportunity for significant stores of supraglacial sediment to be retained on the landscape, and subsequently added ‘into’ the glacier to be delivered to the terminus. To attribute the increase in sediment yields that accompanied the retreat of Tyndall Glacier solely to enhanced evacuation of stored sediments from under or lateral to the glacier would require the erosion and transfer of a uniform layer of sediment >9 m-thick that had been stored under the entire ablation area of the glacier as well as from the newly exposed ice-marginal slopes in the upper catchment, which far exceeds the characteristic till thickness of <1 m that has been documented from boreholes that have penetrated to the base of other coastal Alaskan glaciers. Any rapid evacuation of debris stores during this period could only be sustained, however, if they were offset by rapid erosion; a thick blanket of basal debris would preclude bedrock erosion as it would tend to prevent sliding ice from having direct access to the underlying bedrock. Moreover, the catchment upstream of the current terminus has experienced contiguous ice cover since the onset of the Little Ice Age, as can been seen for example in an 1897 panorama photo taken during the Bryant expedition to climb Mount St. Elias (see Fig. 3 in Haeussler and others, Reference Haeussler2018), leaving very little part of the basin where significant supraglacial sediment stores would have been maintained, to be re-mobilized during the most recent episode of thinning.
Evolution of fan-deltas from tributary basins
The incremental opening of the Taan Fjord basin associated with the retreat of Tyndall Glacier connected the eight non-glaciated tributary watersheds with sea level at different points in time. For this study, these tributaries were named according to the year base-level fell to sea-level following the retreat of the glacier terminus past their outlets (Fig. 3). These years are also assumed to represent the onset of fan-delta progradation into the fjord for each tributary mouth. The fan-deltas and their contributing basin areas were delineated using the 5m IfSAR digital elevation model (ArcticDEM), 2016 LiDAR imagery (from University of Alaska Fairbanks) and multibeam bathymetry collected by the Alaskan Gyre in August 2016 (Haeussler and others, Reference Haeussler2018).

Fig. 3. (a) The tributary basins to Taan Fjord (outlined in red) and associated fan-deltas (subaerial surface outlined in yellow and submarine extent in black dashes) and labeled according the year the glacier terminus retreated past the tributary outlet. (b) The dominant geologic units and active faults underlying the tributary watersheds (basins outlined in black dashes and labeled in white). Modified from Chapman and others (Reference Chapman2012).
Fan-delta volumes are assumed to share a constant proportionality with their surface area, as suggested by Giles (Reference Giles2010). In Taan Fjord, it was therefore assumed that the volume of the individual fan-deltas grew in specific proportion to their growth in surface area. High resolution subaerial and subaqueous DEMs created in 2016 (UAF; USGS) were used to create one of three simplified volumetric models that were applied to each of the fan-deltas (see Supplementary Materials). The 2016 volumes were assumed to represent minimum estimates of the total sediment evacuated from each tributary basin following base-level fall to sea-level and thus the magnitude of the paraglacial response in the tributary basins. The original surface area-to-volume ratio was determined for the fan-deltas in 2016 and then applied to previous years with available subaerial imagery using the workflow outlined in the Supplementary Materials to determine total fan-delta volume in the year of interest.
We compared the volume estimates for each fan-delta to the timeline of progradation to obtain annual sediment yields for the tributary basins using the equation:

where Q s is the annual basin sediment yield, dV is the change in volume since the previous year of measurement and dt is the amount of time passed since the previous year of measurement.
Basin-averaged erosion rates for each tributary were then determined using the same Eqn (1), with ρ R = 2350 kg m−3, the density of the Yakataga bedrock (Mankemthong and others, Reference Mankhemthong, Doser and Pavlis2013; Haeussler and others, Reference Haeussler2018), and ρ S in this instance = 1600 kg m−3, the density of saturated glaciofluvial fan-delta sediments found in the Coast Mountains of British Columbia, a similar geologic environment (Pelpola and Hickin, Reference Pelpola and Hickin2004; Tunnicliffe and others, Reference Tunnicliffe, Church and Enkin2011). The basin areas for each watershed A were determined from the 2016 DEM (Fig. 3).
Results
The retreat of Tyndall Glacier was accompanied by rapid surface thinning, resulting in substantial drops in base-level for all eight of the tributary streams in Taan Fjord. Since 1957, base level fall was most pronounced for tributaries at the current head of the fjord where the glacier thinned over 550 m. Average base-level fall in the fjord since 1957 for all of the tributaries was over 350 m. It should be noted that total thinning and base-level fall was likely greater, as our analysis was constrained by the earliest available imagery (1957), however Tyndall Glacier has likely undergone additional thinning since it first started to retreat from the mouth of Icy Bay at the end of the Little Ice Age in 1905 (Porter, Reference Porter1989; Koppes and Hallet, Reference Koppes and Hallet2006).
Base-level fall following the significant drawdown in ice volume of Tyndall Glacier manifested as large-scale morphological changes in the tributary basins. The gradient on the lower reaches of the tributary streams increased dramatically, causing the development of rapidly migrating knickpoints in six of the eight tributaries, as observed in the aerial photos (see examples in the Supplementary Materials). The increase in gradient also triggered morphological changes in the streams, with braided channels abandoned in favor of single-thread channels as processes of aggradation transitioned to incision.
In total, the combined volume of sediment stored within the fan-deltas of Taan Fjord in 2014 (pre-tsunami) was 165.7 ± 16.7 × 10⁶ m3 (Table 1). The greatest volume of sediment was stored within Fan-Delta 1973 (56.3 ± 4.4 × 10⁶ m3), and the least volume of sediment was contained within Fan-Delta 1983 (0.11 ± 0.06 × 10⁶ m3). The volume of sediment stored within an individual fan-delta did not correlate with length of time since exposure, as the size of the youngest fan-delta at the head of the fjord (1988) was similar to that of the oldest at the entrance of the fjord (1967), suggesting that other variables including bedrock lithology and tectonics are influencing sediment yields from the watersheds.
Table 1. Total volume, sediment yields and basin-averaged erosion rates for Tyndall Glacier, the tributary basins and the October 2015 landslide

The combined average sediment yield from all the tributary basins to the fjord between 1967 and 2014 was 7.2 ± 0.7 × 10⁶ m3 a−1, with annual yields varying between 1.8 and 16 × 106 m3 a−1 (Fig. 4). The watershed contributing the highest average annual sediment yield was Tributary 1973 (2.6 ± 0.2 × 10⁶ m3 a−1), which drains the Samovar Hills to the southeast, whereas watershed 1983, which drains a small plateau in the Yakataga Formation, contributed the least sediment yield (0.003 ± 0.002 × 10⁶ m3 a−1). Erosion rates followed the same general trend, with Watersheds 1973 and 1983 showing the most rapid (146 ± 11 mm a−1) and least rapid (0.5 ± 0.1 mm a−1) basin-averaged erosion rates, respectively. The sediment yields and erosion rates for each tributary basin are presented in Table 1 for comparison.

Fig. 4. Annual sediment yields from Tyndall Glacier (red) and tributary basins (gold) from 1962 to 2014, prior to the landslide. The cumulative retreat of Tyndall Glacier from its position at the head of the fjord in 1961 is in (blue). Note the terminus stabilized at a bedrock constriction along the Chaix Hills thrust in 1991.
The total volume of sediment delivered by Tyndall Glacier between 1961 and 2014 was 442 million m3, with an average sediment flux of 8.6 × 10⁶ m3 a−1. Glacial sediment yields increased at a rate proportional the rate of retreat, as expected if we presume that the ice accelerated commensurate with retreat, thereby enhancing subglacial erosion as well as sub- and supra-glacial sediment evacuation (Fig. 4). Unfortunately, we do not have any measurements of changes in glacier sliding speeds for much of the study period (prior to 1985) to make a direct comparison between erosion rates and ice velocities; however, a survey of regional glacier velocity maps suggest that mean annual surface velocities at the ELA for Tyndall Glacier averaged ~400 m a−1 between 1985 and 2013 (McNabb and others, Reference McNabb, Hock and Huss2015) slowed to ~260 m a−1 in the period 2007–2010 (Burgess and others, Reference Burgess, Forster and Larsen2013), and subsequently increased to 600 m a−1 between 2013 and 2018 (Altena and others, Reference Altena, Scambos, Fahnestock and Kääb2019), suggesting a deceleration as the terminus stabilized, and subsequent increase during the most recent period of retreat and readvance (Fig. 5). Converted to basin-averaged glacier erosion rates, erosion over the 53-year-period averaged 26 ± 5 mm a−1, increasing to over 53 mm a−1 during the more rapid phase of retreat in the 1980s, and decreasing to 11 mm a−1 when the terminus became stable in the 1990s (Fig. 5).

Fig. 5. Annual basin-averaged erosion rates between 1962 and 2014 from Tyndall Glacier (red) and tributary basins (gold) in mm a−1 plotted against the annual retreat rate of Tyndall Glacier in km a−1 (blue).
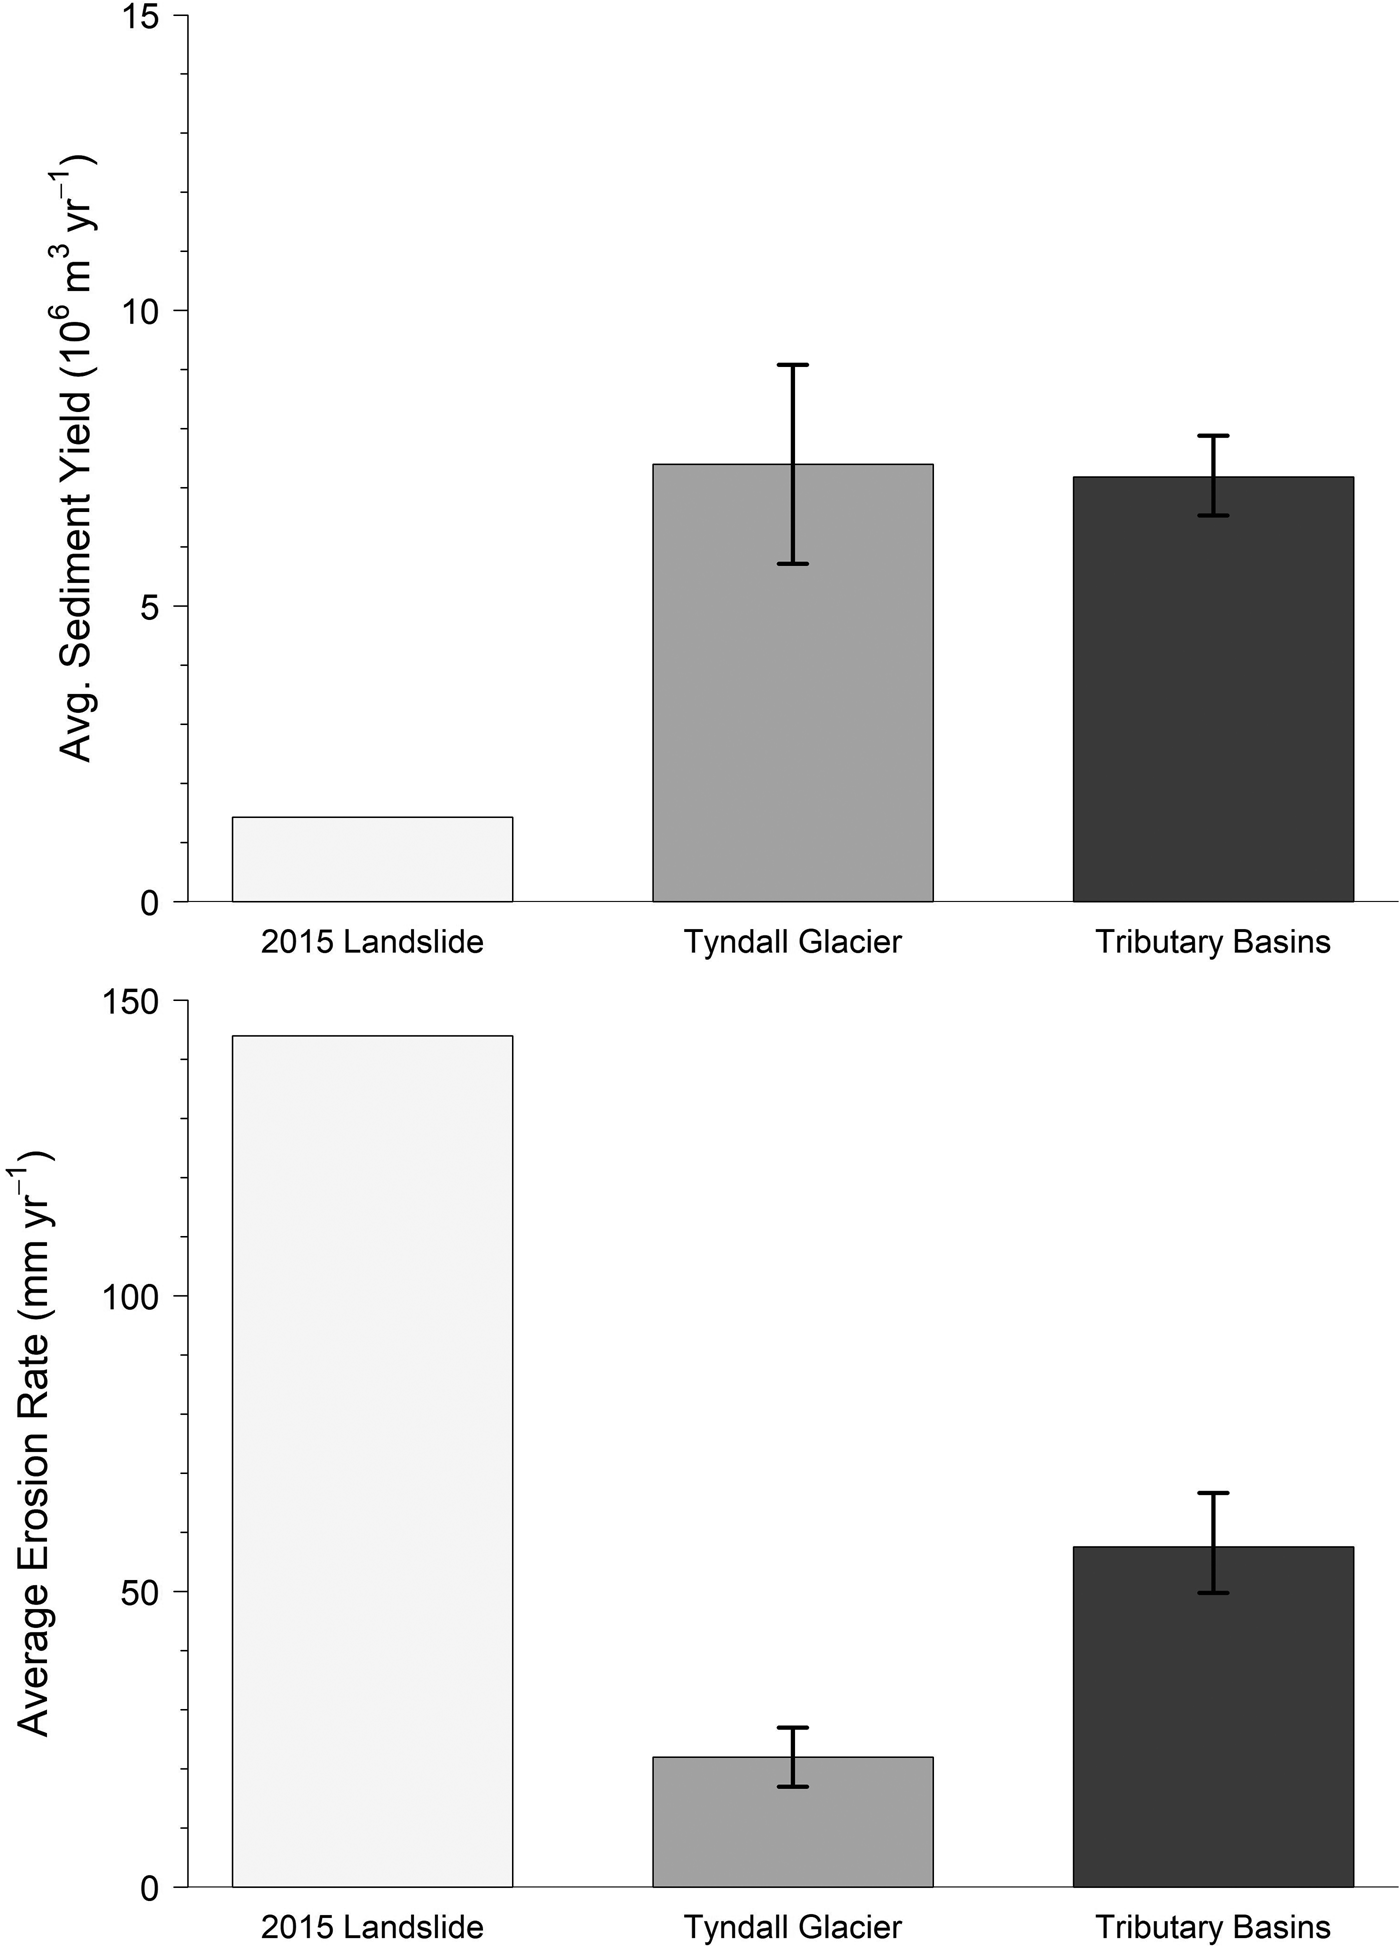
Based on projected errors for both the glacier and the tributaries, the tributary streams hence have been a factor of two more erosive than Tyndall Glacier during its most active phase of retreat (Fig. 6). The landslide had an instantaneous yield that far exceeded that of both the glacier and the tributaries at 76 million m3 (Higman and others, Reference Higman2018), resulting in an instantaneous erosion rate averaged over the Daisy catchment of 7.65 m. However if, for the purposes of comparison, we average this yield over the same length of time (53 years) as for the glacier and the non-glaciated tributaries, and over (a) the area of the contributing catchment (9.89 km2) or (b) the total non-glaciated catchment (85 km2), this results in a basin-averaged landslide erosion rate of 144 and 16 mm a−1 over the study period, respectively. By either measure, the combined paraglacial erosion rates from the landslide and tributaries far exceed glacial erosion rates during this period of retreat. It should be noted that our volume estimates and hence erosion rates from all three geomorphic processes are considered minimum estimates as they only account for sediment accumulated in the fan-deltas, landslide and submarine deposits and not any finer sediments that bypass the landforms and exit the fjord altogether.

Fig. 6. Comparison of sediment yields (top panel) and corresponding basin-averaged erosion rates (bottom panel) averaged over a period of 54 years (1961–2015) from the October 2015 landslide (light gray), from Tyndall Glacier (medium gray) and from the combined tributaries between 1967 and 2014 (dark gray).
As seen in the historical photos, ice-impounded marginal lakes of varying size were present at the mouths of six of the eight tributary watersheds in 1957. The largest ice-marginal lake was located in the 1980 watershed (Fig. 7). There is evidence of partial lake drainage prior to 1957 in the form of stranded icebergs above the 1957 lake shoreline.

Fig. 7. Tributary 1980, in the center of the fjord, in 1957 (top panel) and 2013 (bottom panel). An ice-marginal lake with stranded icebergs can be seen in the lower reaches of the watershed in the 1957 USGS airphoto, which drained as the terminus retreated past the outlet in the early 1980s. The remnant glaciolacustrine deposit was deeply dissected by the tributary stream following base-level fall, as seen in the 2013 ESRI image.
Rapid incision into ice-marginal glaciolacustrine deposits commenced following lake drainage and base-level fall as the terminus retreated past the tributary outlet. This led to the formation of deeply incised valleys in the lower reaches of the tributary streams with remnants of abandoned glaciofluvial terraces several hundred meters above the modern day stream. Glaciolacustrine and glaciofluvial deposits are much more easily erodible than bedrock, resulting extremely high sediment yields and erosion rates from these watersheds immediately following retreat of the calving front past their outlets (Fig. 7).
Uncertainties
There are several sources of uncertainty in our quantification of the sediment yields and erosion rates from the tributary basins and from Tyndall Glacier into Taan Fjord. First, the 2015 landslide and tsunami had a dramatic impact on existing deposits in the fjord. The total fan-delta volumes, and hence sediment yields and erosion rates that we calculated were estimated from the multibeam bathymetry and LiDAR imagery of the fjord collected in summer 2016 after the landslide and tsunami. Hence, any effects of the 2015 event on the model parameters we used would have an impact on our estimates of fan-delta volume and thereby on any estimates of sediment yield and erosion rate from the tributaries. As reported by Bloom and others (Reference Bloom2017), the landslide and tsunami had the greatest impact on the fan-deltas at the head of the fjord and closest to the landslide (i.e. FD 1988, 1987 and 1985). Scour depths on subaerial fan-delta surfaces during the event were estimated to be <10 m in localized areas, whereas >8 m of slope wash was redeposited on other surfaces (Higman and others, Reference Higman2018). Thus, redistribution of the subaerial deposits on the fans was locally significant. If any sediment was lost from the fan surfaces due to the tsunami, this would result in an underestimation of the total volumes, sediment yields and erosion rates for each of the tributary watersheds.
The 2015 landslide also likely resulted in an underestimate of the sediment yields from Tyndall Glacier between 1999 and 2016. As the landslide runout traversed the fjord in the first few kilometers of fjord in front of the terminus, the energy of the flow scoured and remobilized the glacimarine deposits in front of the glacier to a depth of at least 25 m (Dufresne and others, Reference Dufresne2017; Haeussler and others, Reference Haeussler2018), and therefore any direct record of sediment yields from the glacier since 1999 has been lost. Any sediment that was produced by the glacier was incorporated into distal landslide and tsunami deposits during the 2015 event, and hence impossible to tease out of the record. We therefore assume that sediment yields from the glacier were relatively constant as the terminus stabilized after 1991, and hence sediment fluxes from the glacier since 1999 are similar to the yields measured from 1991 to 1999, when terminus first stabilized. This is likely an underestimate of the total sediment yields, as the surface lowering of the glacier from Muskett and others (Reference Muskett, Lingle, Sauber, Rabus and Tangborn2008) suggest instead that the glacier was steadily thinning along flow and accelerating, especially between 1999 and 2002 when Tyndall experienced a modest surge (with terminus advance of 400 m), and hence erosion and sediment production should have accelerated as well over this period (Koppes and others, Reference Koppes2015). Moreover, continued surface lowering of the glacier has exposed more of the supraglacial valley walls upstream of the terminus, which are predominantly mantled by till and glaciofluvial deposits that are prone to unraveling. Paraglacial denudation of the supraglacial catchment likely contributed some quantity of debris that has been advected to the terminus on or under the glacier, however the magnitude of this flux is unknown.
An additional source of uncertainty lies with any fine-grained sediment evacuated from the glacier and the tributary basins. Fine-grained sediments bypass the fan-deltas and are deposited distally in the fjord, making them indistinguishable from glacigenic sediments. Moreover, significant volumes of both glacigenic and fluvial sediment bypass the fjords altogether and are deposited on the continental shelf (Jaeger and Nittrouer, Reference Jaeger and Nittrouer1999), also resulting in underestimates of the total volume of sediment evacuated from the watersheds (including the glacier catchment).
Moreover, basin-averaged erosion rates for the glaciated and non-glaciated basins were determined by using the relative densities of the primary bedrock lithologies in Taan Fjord and of saturated glacimarine and fan-delta sediments, respectively. The bulk density used for the fan-delta sediments (1600 kg m−3) was chosen based on similar studies done on fan-deltas in paraglacial landscapes in British Columbia (Pelpola and Hickin, Reference Pelpola and Hickin2004; Tunnicliffe and others, Reference Tunnicliffe, Church and Enkin2011). The density of the primary bedrock in Taan Fjord, the Yakataga Formation, was assumed to be similar to those in the Cook Inlet region (Haeussler and others, Reference Haeussler2018; Mankemthong and others, Reference Mankhemthong, Doser and Pavlis2013). However, a few of tributary watersheds, as well as the glacier, overlie multiple bedrock units, including the Yakataga, Kulthieth and Poul Creek Formations, which have varying densities ranging from 2100 to 2500 kg m−3 (Mankemthong and others, Reference Mankhemthong, Doser and Pavlis2013, Table 1). For this study, only the density of the Yakataga Formation (2350 kg m−3) was used. By using the density of the dominant bedrock lithology to determine erosion rates, we are assuming that erosion by the glacier and in the tributary basins was predominantly of bedrock. In reality, the most rapid erosion rates were found where streams incised through unconsolidated deposits such as ice-marginal glaciolacustrine and glaciofluvial sediments, with much lower bulk densities more closely resembling that of the fan-delta deposits (1600 kg m−3), resulting in an underestimation of the total erosion rate from some of the tributary streams. Additional discussion of these uncertainties can be found in the Supplementary Materials.
Discussion
Rapid warming in the region over the past 50 years spurred the retreat and consequent acceleration of Tyndall Glacier (Burgess and others, Reference Burgess, Forster and Larsen2013; McNabb and others, Reference McNabb, Hock and Huss2015; Altena and others, Reference Altena, Scambos, Fahnestock and Kääb2019) leading to enhanced erosion and evacuation of sediments from the glacier catchment. As we have found in Taan Fjord, this rapid ice loss and terminus retreat has cascading effects on the landscape, resulting in an increase in sediment yields from a multitude of geomorphic processes, including changes in the erosive power of the glacier, of the tributary streams and of the surrounding hillslopes. As the glacier thinned and retreated, sediment yields from the glacier increased, and base level began to fall for the tributary systems. The tributary streams started to incise and erode at a rate on par with that of the glacier. For those tributaries with ice-marginal lake deposits, accessible glaciofluvial deposits and along active faults, rates of sediment excavation far exceeded subglacial bedrock erosion. We note that rapid retreat not only drives increases in bedrock erosion from both subglacial and fluvial processes, but it also promotes the evacuation of glacigenic sediments that were stored in the proglacial and ice-marginal basins. Concurrently, continued debuttressing of the valley walls as the ice thinned led to weakening of oversteepened slopes, culminating in mass-wasting events. Hence, incremental sediment inputs from the glacier and paraglacial basins steadily increased until a large tsunamigenic landslide delivered a significant pulse of sediment to the fjord. The steps in the evolution of the fjord over the last 50 years are depicted in Figure 8.
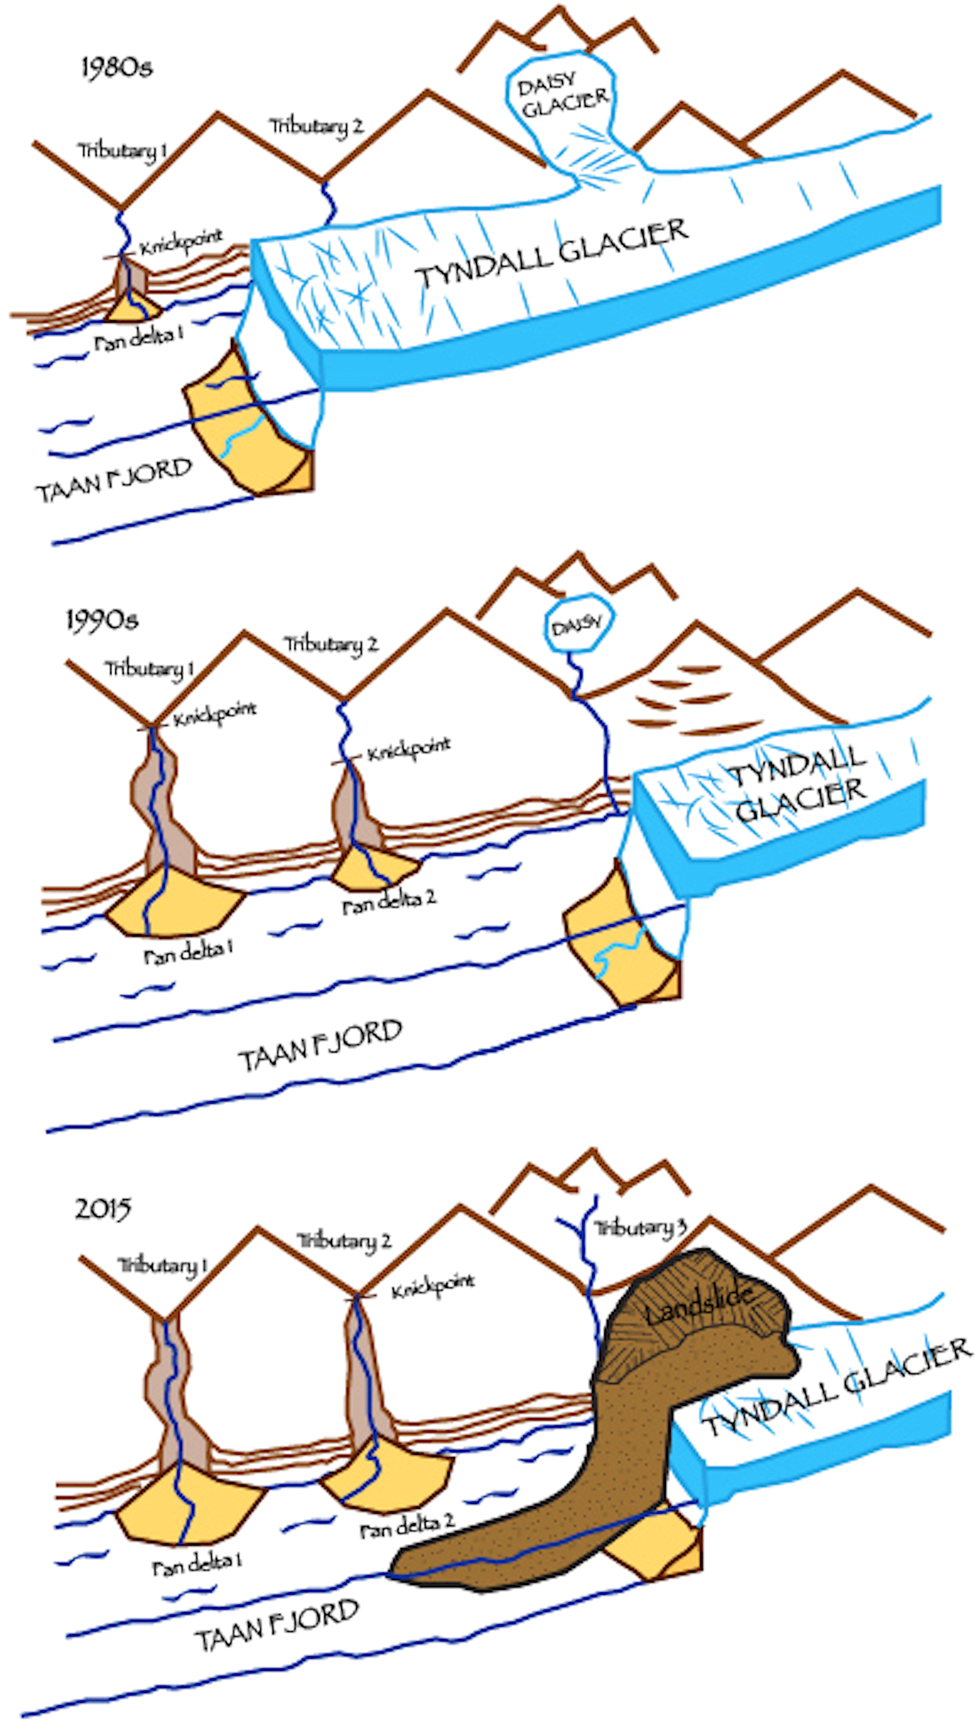
Fig. 8. Conceptual cartoon of the paraglacial evolution of Taan Fjord.
The rate at which the tributary streams have been eroding their watersheds and contributing sediment to the fjord is primarily a function of (1) the availability of non-cohesive sediment in the watershed, (2) the length of time since the watershed outlet experienced a sharp drop in base-level and (3) the lithology and structure of the bedrock in the watershed. Basins with large stores of loose sediment in the form of ice-marginal outwash and/or till deposits from the glacier tended to have the highest yields at the beginning phase of fan-delta formation. This indicated that these glacially derived deposits were effectively flushed from the tributary systems immediately following the retreat of the terminus past their outlets. Those basins with little to no glacial sediment storage produced much smaller yields, suggesting the dominance of slower bedrock erosion in these watersheds. Surprisingly, the size of the contributing basin area seemed to have little effect on the rate at which sediment was evacuated from the basins, with some of the smallest basins being the most erosive. This could be attributable to increased connectivity in the smaller catchments, which in addition to having less capacity for sediment storage due to their reduced basin area, also had steeper stream gradients and were generally unvegetated.
The high rates of erosion and pulses of sediment from the basins at the head of the fjord (Tributaries 1985, 1987, 1988) also partially stem from activity along the Chaix-Hills thrust fault that bisects these basins (Fig. 3). In this region, the fault has a right-lateral slip rate of 8.3 ± 8.7 mm a−1 and reverse slip rate of 14.3 ± 1.8 mm a−1 (Elliot and others, Reference Elliott, Freymueller and Larsen2013). Fault mechanics have been documented to increase erosion rates due to mechanical breakdown of rocks surrounding the fault plane (Tucker and Slingerland, Reference Tucker and Slingerland1996; Dadson and others, Reference Dadson2003), suggesting that the high erosion rates we found in the watersheds that intersect the Chaix-Hills Thrust are likely due in part to movement along the fault. Additionally, the lithologies present along this fault are relatively weak (Kulthieth, Poul Creek and Yakataga Formations), thereby allowing for increased erosion at the fault boundary.
The rates and processes of landscape denudation following glacier shrinkage are varied in Taan Fjord but they are all demonstrably rapid. Tyndall Glacier and its surrounding non-glaciated basins are particularly erosive and yields are up to an order of magnitude higher than measured for other temperate glaciers elsewhere due to the rapid convergence and uplift rates in the region. Intriguingly, erosion rates from Tyndall Glacier during the active phase of retreat, which averaged 26.2 mm a−1, exceeded maximum tectonic uplift rates of 17 mm a−1 (Elliot and others, Reference Elliott, Freymueller and Larsen2013); however, extrapolating a longer-term glacial erosion rate of 13 mm a−1 from the period when the terminus was relatively stable between 1991 and 2015, suggests that the longer pace of glacial erosion is on par with regional uplift. That the initial paraglacial response rate from the tributary watersheds is on par with that of the glacier during its most active phase of retreat, also highlights that during onset of deglaciation, the landscape is in significant disequilibrium with regional uplift rates.
Given sufficient time and in the absence of other tectonic or climatic forcing, the replacement of glacial erosion with non-glacial erosion and fluvial transport should lead to a progressive decline in sediment export rates. However, the geomorphic complexity of most basins, including the sequential arrangement of landsystems with different sediment flux rates, and progressive sediment deposition and reworking in the proglacial zone (Orwin and Smart, Reference Orwin and Smart2004; Heckmann and others, Reference Heckmann2012) can make comparison of the relative contributions of glacial and non-glacial erosion to sediment yields difficult to establish (cf. Harbor and Warburton, Reference Harbor and Warburton1993). Notwithstanding these complexities, our findings suggest that during the onset of deglaciation, the lateral, ice-free, paraglacial components of the landscape (the tributary basins) were on average more erosive and delivered as much sediment to the fjord as from glaciation, and that both significantly outpace tectonic uplift rates. That fluvial, paraglacial denudation rates in this particular setting are on par with glacial denudation rates is especially significant here, as the temperate tidewater glaciers of Alaska are known for being exceptionally erosive during phases of retreat (Hallet and others, Reference Hallet, Hunter and Bogen1996; Koppes and Hallet, Reference Koppes and Hallet2002) and have been found to have erosion rates that are orders of magnitude larger than from other glaciers worldwide (Hallet and others, Reference Hallet, Hunter and Bogen1996; Koppes and others, Reference Koppes2015). With this in mind, our results demonstrate that in fact, paraglacial processes within a watershed can be more erosive and produce higher sediment yields than from active tidewater glaciers, over decadal timescales following the onset of retreat (Fig. 9).

Fig. 9. Conceptual model of variation in sediment yields over time in upland environments during and following deglaciation, based on yields in Taan Fjord. Modified from Church and Slaymaker (Reference Church and Slaymaker1989).
Implications
Recent studies of regions experiencing rapid warming and deglaciation often focus on the loss of ice masses and the effects of glacial retreat on sediment yields and meltwater discharge (e.g. Huss and others, Reference Huss2017), with a few focusing on the effects on glacial recession on the frequency and magnitude of glacier-related hazards (e.g. McColl, Reference McColl2012; Milner and others, Reference Milner2017). To date, with the exception of a few studies that have attempted to conceptualize and quantify transience and longitudinal connectivity in deglaciating landscapes (Knight and Harrison, Reference Knight and Harrison2014; Carrivick and Heckmann, Reference Carrivick and Heckmann2017; Lane and others, Reference Lane, Bakker, Gabbud, Micheletti and Saugy2017) sparse consideration has been given to the balance between longitudinal fluxes from glacier and meltwater sources and lateral fluxes from hillslope and fluvial geomorphic processes occurring in the proglacial zone at a landsystem scale that may also contribute to evolving sediment budgets (Schiefer and Gilbert, Reference Schiefer and Gilbert2007; Heckmann and others, Reference Heckmann2012; Cavalli and others, Reference Cavalli, Trevisani, Comiti and Marchi2013). Our findings show that, where large tributary catchments exist in a landscape experiencing rapid deglaciation, both longitudinal glacial denudation fluxes and lateral paraglacial denudation fluxes can act in concert and with similar magnitudes, and can occur at faster rates than is compensated by regional uplift rates; all are critical to the evolution of the deglaciating landscape (Carrivick and Heckmann, Reference Carrivick and Heckmann2017). Thus, the paraglacial contributions to sediment budgets early in the deglacial period are significant, and sometimes catastrophic, and need to be included in any quantification of the geomorphic responses to rapid climate change.
We note, however, that this trend might not be applicable to all glacierized areas across the globe. For example, a recent study by Nelson and others (Reference Nelson, Bierman, Shakun and Rood2014) using cosmogenic 10Be to trace glacierized and non-glacierized sediment in Greenland found the opposite to be true, wherein the majority of sediment yields were sourced from bedrock eroded beneath the Greenland ice sheet, and not from the non-glacierized foreland. We postulate that these differences are largely attributable to climatic conditions in areas experiencing rapid ice loss. The warmer temperatures coupled with higher annual precipitation that we see in coastal Alaska, as compared to Greenland, results in highly dynamic paraglacial landscapes capable of yielding significant amounts of sediment, as demonstrated in Taan Fjord.
As first conceptualized by Church and Ryder (Reference Church and Ryder1972) and Harbor and Warburton (Reference Harbor and Warburton1993), rapid glacier retreat spurs a dramatic change in the surrounding landsystem (glacier inclusive) as adjustments are made to reach a new paraglacial equilibrium. These adjustments manifest as an increase in incremental sediment yields from all geomorphic sources in the landscape, including from the glacier, from tributary watersheds, from releases of ice-marginal sediment stores and from increases in stochastic mass wasting events (see Fig. 9). In Taan Fjord, we find that paraglacial processes are in some cases more proficient agents of change in the landscape than the shrinking glacier itself. Hence, when incorporating the impact of glaciation into numerical landscape evolution models (e.g. Herman and others, Reference Herman, Beaud, Champagnac, Lemieux and Sternai2011; Egholm and others, Reference Egholm, Pedersen, Knudsen and Larsen2012), one must acknowledge that rates of paraglacial landscape adjustment due to glacial retreat are also significant forces of geomorphic change, beyond that which is driven by (sub)glacial erosion alone. Our findings emphasize the need to account for potentially high sediment yields from dynamic tributary basins when investigating landsystems currently experiencing rapid glacier retreat, particular in temperate, tectonically active regions.
Populations living downstream of shrinking glaciers face increasing risks as a result of large paraglacial mass wasting events, as the frequency of major rock mass movements on formerly ice-covered hillslopes increases during the early paraglacial period (e.g. Ballantyne, Reference Ballantyne2002; Arsenault and Meigs, Reference Arsenault and Meigs2005; Hewitt and others, Reference Hewitt, Clague and Orwin2008; McColl, Reference McColl2012; Uhlmann and others, Reference Uhlmann, Korup, Huggel, Fischer and Kargel2012; Ballantyne and Stone, Reference Ballantyne and Stone2013). Paraglacial mass wasting events also create secondary hazards when they enter bodies of water, such as large tsunamis or glacier lake outburst floods (e.g. Wieczorek and others, Reference Wieczorek, Geist, Motyka and Jakob2007; Dufresne and others, Reference Dufresne2017; Higman and others, Reference Higman2018) that can transfer significant pulses of sediment far downstream. We find that in Taan Fjord, the rapid exposure and debuttressing of valley walls as the glacier surface lowered by over 400 m resulted in a massive, stochastic influx of sediment into the proglacial system, that far exceeded, in mere moments, the incremental, denudational work done by the tributaries and the glacier over decades (Fig. 6).
The evolution of the landscape of Taan Fjord provides an excellent example of the consequences of rapid glacier retreat. As most glaciers worldwide continue to shrink due to ongoing climate change, new paraglacial landscapes will continue to be exposed. Our observations from Taan Fjord are therefore useful in understanding the geomorphic processes likely to accompany rapid deglaciation in other regions. As an example, communities living downstream of dams in glaciated landscapes may face future problems related to the infilling of reservoirs if upstream rivers exhibit similar behaviors. Increases in sediment yield may change the course of rivers and/or result in more frequent and severe flooding events, thereby threatening lives and infrastructure in downstream communities. It is important to note that our study area is unpopulated; had a similar sequence of events occurred in a more populated watershed undergoing rapid glacier shrinkage, such as in some of the other bays and fjords of coastal Alaska, the Coast Mountains of British Columbia or Patagonia, dramatic loss of life would have been more likely.
Conclusions
We analyzed the geomorphic and sediment accumulation history of Taan Fjord over the last 50+ years of retreat of Tyndall Glacier, to explore the factors driving the evolution of a landscape during rapid deglaciation. The main findings of this study were as follows:
(1) Tyndall Glacier has retreated a total of 17 km since 1961 due to regional warming, with concomitant thinning. At the head of the fjord, the change in glacier surface elevation exceeded 550 m between 1961 and 2016, resulting in an average base-level fall of ~350 m at the fjord entrance and over 500 m for the tributary basins at the head of the fjord.
(2) Sediment yields and erosion rates from the glacier are strongly correlated with the rate of retreat, as concomitant ice acceleration enhanced subglacial erosion and sediment evacuation. The basin-averaged erosion rate during this period exceeded 26 ± 5 mm a−1.
(3) The tributary streams responded to the onset of base-level fall by incising into their lower reaches, triggering the formation of rapidly migrating knickpoints. Sediment yields from all the tributary basins were rapid and dynamic, and tapered off after the first decade of exposure.
(4) Rapid thinning of the glacier also exposed oversteepened, unstable slopes, resulting in a massive landslide and tsunami.
(5) Incremental erosion rates from the paraglacial tributaries were twice that of the glacier during the phase of active retreat.
(6) When considering sediment yields from episodic paraglacial mass-wasting events such as the landslide as well, the magnitude of paraglacial denudation rates may far outpace the enhanced erosion from the shrinking glacier, highlighting the sharp increase in landscape response during the early period of deglaciation.
The paraglacial response to recent glacial retreat has been extreme in both ‘small-scale’ unraveling of the landscape and the large-scale stochastic landslide event of 2015. We hesitate to use the phrase ‘small-scale’ when referring to the paraglacial processes acting in the tributary basins of Taan Fjord because the sediment excavated from these watersheds is on par with that of the retreating Tyndall Glacier. While the landslide mobilized a massive amount of sediment at the head of the fjord, it was the processes active in the tributary basins that have led to the most significant changes during the rapid retreat of Tyndall Glacier. As the landscape began to relax following the onset of deglaciation, these paraglacial processes have been more effective in the erosion and delivery of sediment to fjord than that of the retreating tidewater glacier.
Supplementary material
The supplementary material for this article can be found at https://doi.org/10.1017/aog.2020.1
Acknowledgements
We acknowledge the following funding sources for support of this work: US National Science Foundation grant NSF-GLD-1638898 and the Canadian National Science and Engineering Research Council Discovery Grant 402225-11. This manuscript grew out of an invited presentation to the International Glaciological Society (IGS) Symposium on Glacial Erosion and Sedimentation, Madison, Wisconsin, USA, 12–17 May 2019. The manuscript benefitted from helpful comments by Sam McColl and an anonymous reviewer.


 Open access