Introduction
The central part of the Filchner-Ronne Ice Shelf (FRIS) consists of an upper layer of fresh ice from snow precipitation (meteoric ice) and a basal layer of ice formed by freezing of ice from the sea below the ice shelf (marine ice). The latter was found in 1984 during aerogeophvsical measurements by Reference Thyssen and KohnenThyssen (1986, 1988). The Münster group confirmed the predicted thickness of the marine ice by hot-water drilling in 1986 (Reference Engelhardt and DetermannEngelhardt and Determann, 1987). From airborne measurements, we found that the area with a basal layer of marine ice extends to about 110000 km2, with a maximum marine-ice thickness of more than 400 m (Thyssen and others, in press). Core drillings (Oerter and others, 1992a) confirmed the marine origin of the basal layer. Hot- water drilling with borehole instrumentation (Grosfeld, 1993) gave the temperature distribution to the bottom and also in the sea. Measurements of the dielectric properties of the marine ice on core samples, recovered by Gross and Blindow (first results in Reference Blindow and MillerBlindow (1990)), showed that the propagation velocity is the same as in fresh-water ice. The absorption in marine ice at -28°C is 18 dB 100 m 1 at the top of the layer and 14 dB 100 m 1 50 m below, whereas the absorption in the meteoric ice is 1.8 dB 100 m -1. At -5°C, the absorption in the marine ice increases to the range of 25-30 dB 100 m 1.
For a closer look at structural features in this unique regime, 40 MHz monopulse radio-echo soundings with high resolution were performed on an over snow traverse during the German Filchner Expedition 1989-90 (pre-ceded by minor investigations in 1983-84 and 1985-86). The location of the profiles is shown in Figure 1. The total length of measured profiles is 1200 km and some of them are closely parallel and measured with different RF set-ups. The Münster monopulse sounder has been developed for the profiling of glaciological and geological structures, offering a good compromise between resolution, range and processing; of measurements. For the data processing, techniques adopted from reflection seismics are used. From the results of the measurements, three major points have been chosen for this paper: the determination of velocity-travel-time functions on the FRIS, the structural interpretation of profiles and the investigation of reflection amplitudes.
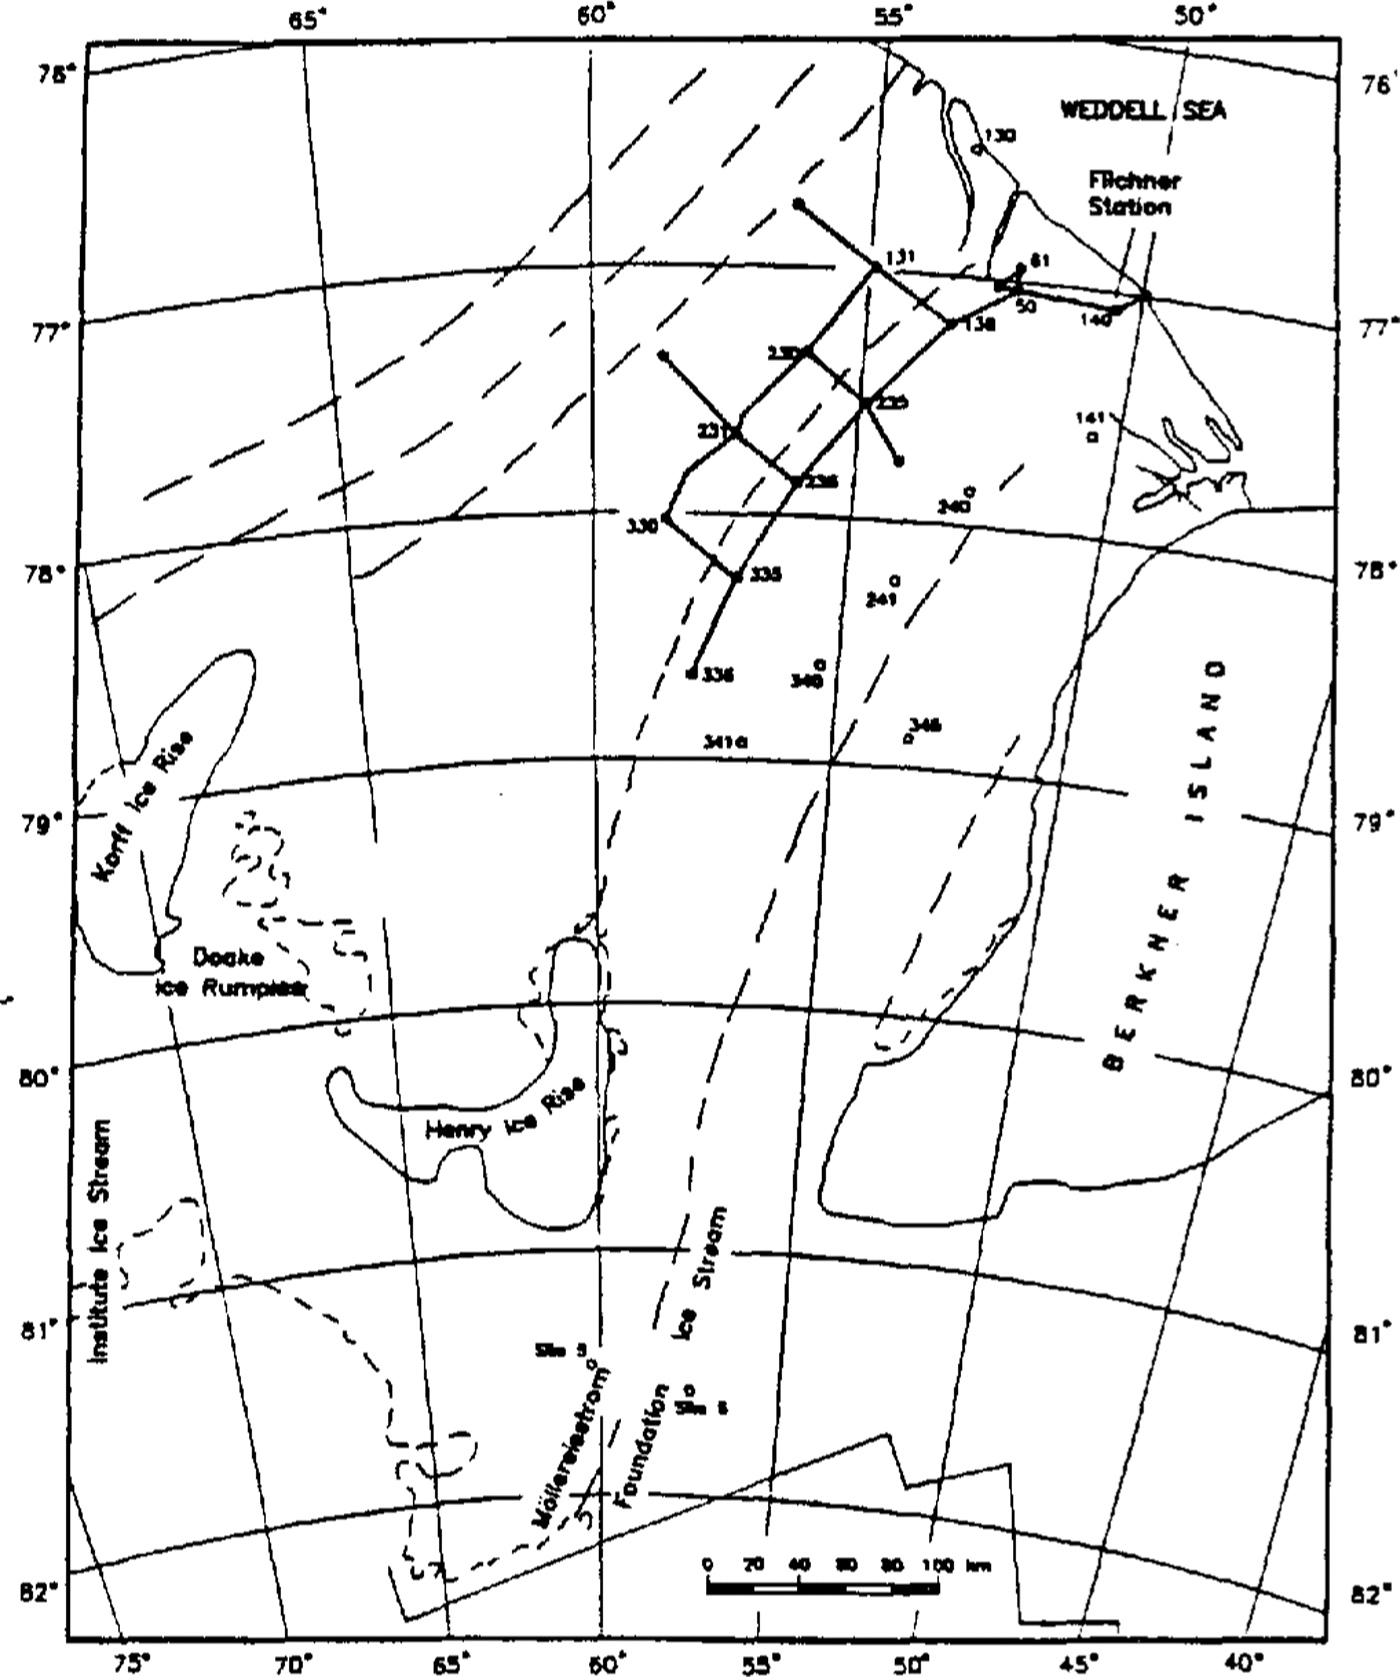
Location 40 MHz monopulse RES profiles in the central part of the FRIS. (Map reproduced from Reference Swithinbank, Brunk and SieversSwithinbank and others, 1988.)
Instruments And Data Processing
The Münster monopulse RES system
Our standard system consists of an avalanche-pulse generator, broad-band dipole antennas, a sampling scope and a digital tape recorder. A careful choice of broad-band components has led to sounding depths of more than 1000 m in normal ice: the 18 stage avalanche generator has a peak amplitude of 2000 V into 100 Ω. It is triggered via a fiber-optic cable. Resistively loaded transmitting and receiving dipole antennas (Wu and King, 1965) are used to obtain short pulses; they contribute a loss of 20 dB compared with simple dipoles. Other broad-band structures with slightly longer pulses lose only 10 dB. Proper matching of the input circuitry avoids ringing and unwanted reflections.
The sampling scope is a modified Tektronix 1503 TDR cable tester with more than 86 dB dynamic range and a sensitivity of 20 μ V pp at 100 MHz band width with a sampling frequency of 20 kHz. Additional features for time-base calibration, triggering and stacking are provided. The data are recorded on a Sony digital audio tape (DAT) system offering 16 bit resolution and oversampling. Event marks and spoken commentary arc recorded on an extra track
The accuracy of references in the text and in this list is the responsibility of the author, to whom queries should be addressed. For continuous profiling purposes with constant offset (normally 10 m), the system is triggered by an odometer at adjustable space intervals (1 -2 m for measuring from a Skidoo) with four tracks per second maximum scan rate. Direct print-out of the constant offset gathers (COG) on an EPC 1600 gray-scale printer serves as a field record of the profiles. For common midpoint (CMP) measurements, 450 m maximum offset is typical on ice shelves with offset increments of 5 or 10m. For our profiling measurements in the Antarctic and in Greenland, the system is mounted on a Nansen sledge, together with a 500 W generator, a satellite-navigation system and communication headsets for operator and Skidoo driver. The antennas are part of light-weight sleds consisting of fiberglass rods and metal-free skis towed behind the Nansen sledge.
Data processing
Continuous profiling data and CMP data are read out digitally from the DAT recorder on an AT personal computer. After reduction of oversampling, stacking and resampling to obtain the proper sampling intervals, trigger-time delays are removed. CMP or COG sections measured with monopulse RES appear almost like seismic sections. They can be treated with a set of programs applying seismic processing techniques, such as band-pass filtering in the time or frequency domain, amplitude regulation, static and dynamic correction, migration and velocity analysis. The latter is of special interest for the evaluation of CMP data. Our approach is to use the amplitude-stacking method of Reference Garotta and MichonGarotta and Michon (1967), which has proved to be a simple and reliable technique. The error in velocity determination with CMPs measured on ice shelves has he en estimated to about ±1 m μs-1.
Cmp Measurements
CMP measurements were made in the vicinity of Filchner Station (point 140), point 61 (three measurements near drill site BI3 and the hot-water drillings of 1990), point 236 (drill site BI5), and points 131, 136,231 and 335. An example for CMP data is shown in Figure 2. It shows signals of internal layers, the meteoric/marine interface reflection (MMR) at 2.1 μs zero offset time and the ice-shelf bottom at3.2μs. The latter reflection is not a common feature for RES in the central part of the FRIS, as pointed out above.
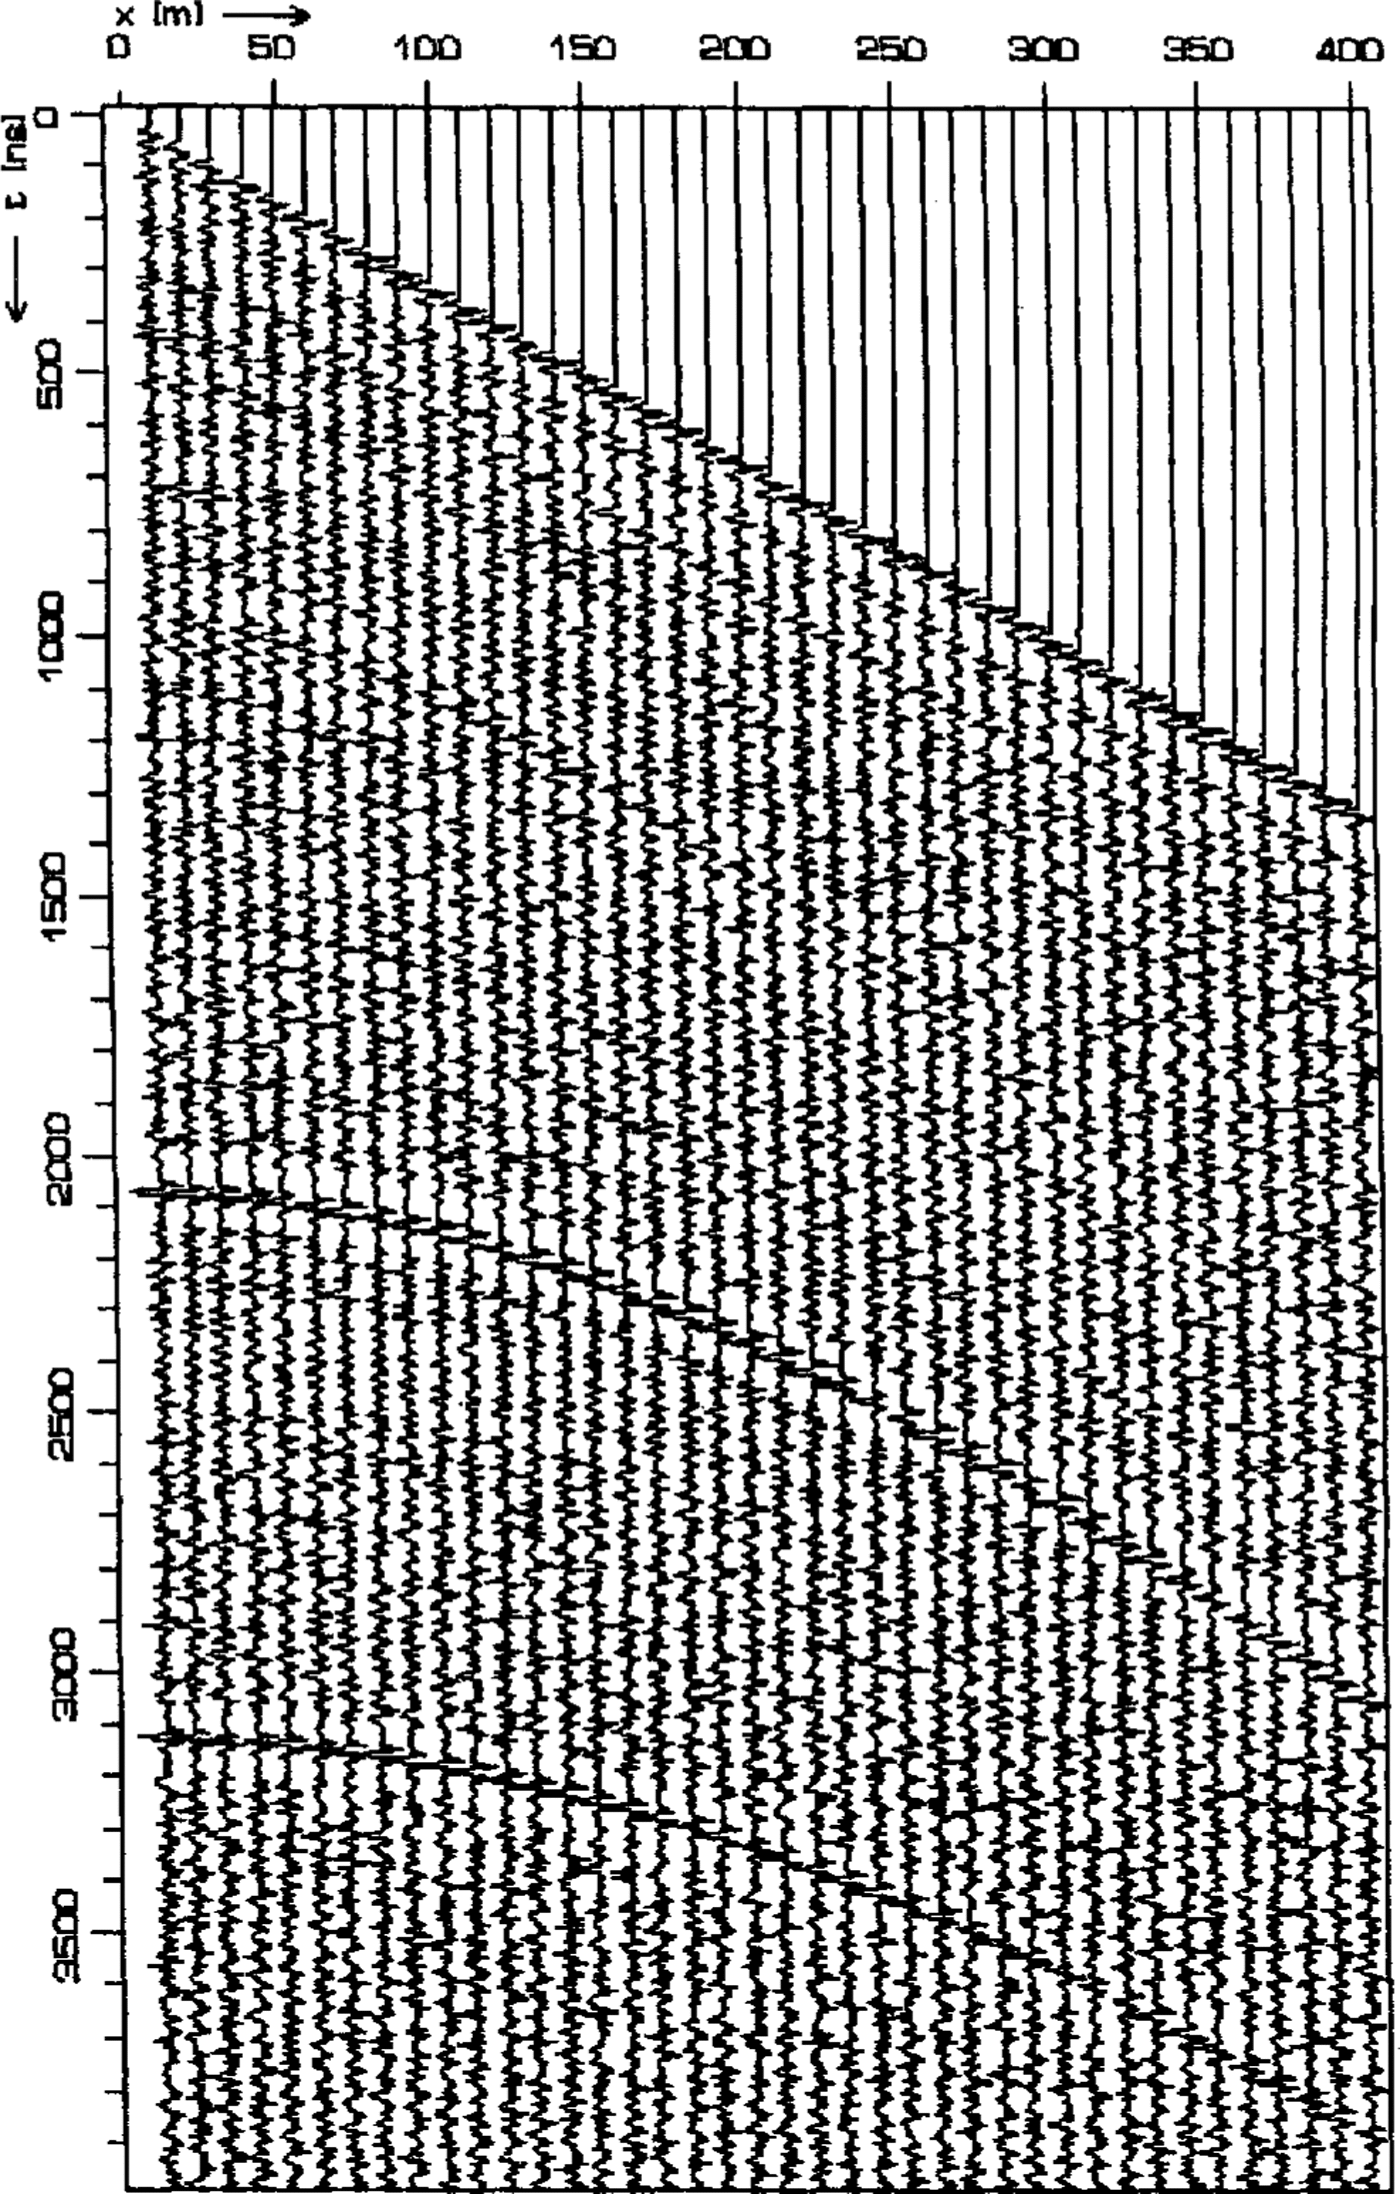
. CMP measured at point 50. MMR at 2.1 μs.Ice-shelf bottom at3.2μs zero offset time.
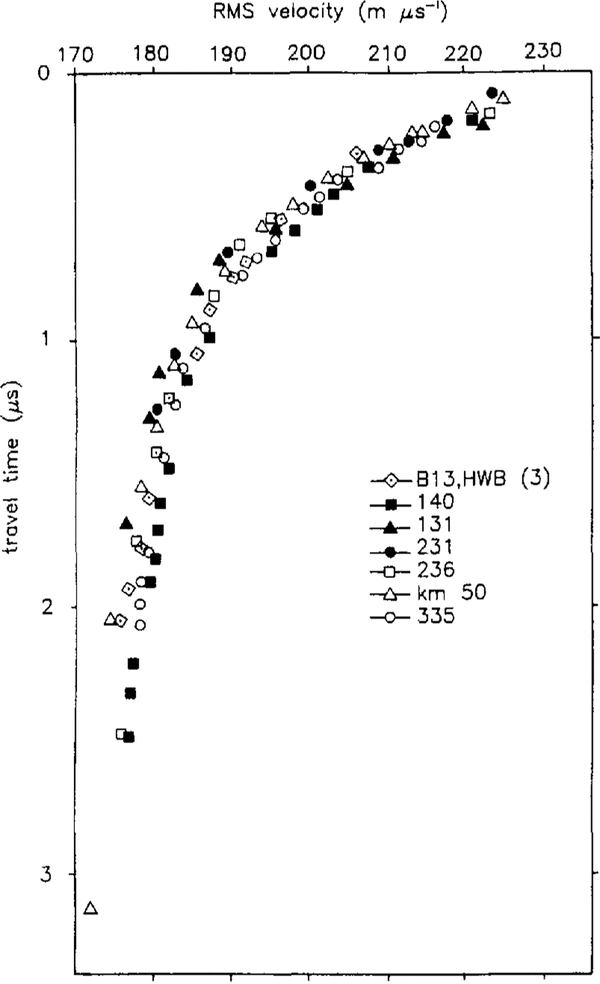
On the whole, nine CMP gathers were obtained in the central part of the Filchner-Ronne Ice Shelf which only show small variations in the velocity depth function. Velocity vs travel-time plots obtained from the Filchner Ice Shelf CMPs are summarized in Figure 3. The in-situ propagation velocity for electromagnetic waves at about 40 MHz in the basal marine-ice layer has been determined as 168 ±1mμs-1, which is the same as in the densified meteoric ice. From the measured velocity-travel-time relations, an expression for the calculation of depth H (in m) from the two-way travel time t (in μs) has been derived. They give the proper total thickness of the ice shelf for the evaluation of small offset ground-based and airborne soundings. An interval velocity of 168 mμs1can be used with an error in depth determination of less than ±1 m below a depth of 100 m. Using the mean values for the nine CMPs, the following relation for the conversion of travel times into depths in the central part of the FRIS holds:
where t is the two-way travel time in ice given in μs and 168 mμs1 is the propagation velocity in pure ice. The value 8.8 m is the "stripping correction" which accounts for the air content of the firn. It is at the low end of possible corrections quoted by Reference Bogorodskiy, Bentley and GudmandsenBogorodskiy and others (1985), indicating a quick densification process influenced by strain thinning of the ice shelf.

rms velocity vs travel time obtained from velocity analysis of CMPs measured on the FRIS.
The CMP results at the drill sites give the thickness of the meteoric ice and the marine ice at B13 with a maximum deviation of 0.5 m. The evaluation of CMP-reflection amplitudes will be the subject of a separate paper.
Cog Measurements (Continuous Profiling)
Structural interpretation
Figure 4 shows a profile near the core and hot-water drill site B13 with MMR at 153 m depth and the bottom reflection at 239 m depth. The firn layering, a zone with remnants of crevasses at 80-100 m depth and deeper layers are visible in the meteoric ice. The reflection coefficient of the meteoric/marine boundary (approx. -34 dB) is weak compared with an ice/water boundary but distinct in most cases. There is no continuous layering within the marine ice on this flowline. For comparison, the electrolytical conductivity profile published by Oerter and others (1992a) is shown. Bands of internal layers in the RES profile correlate well with zones of increased conductivity with the most prominent peak and reflection at the top of the marine ice.
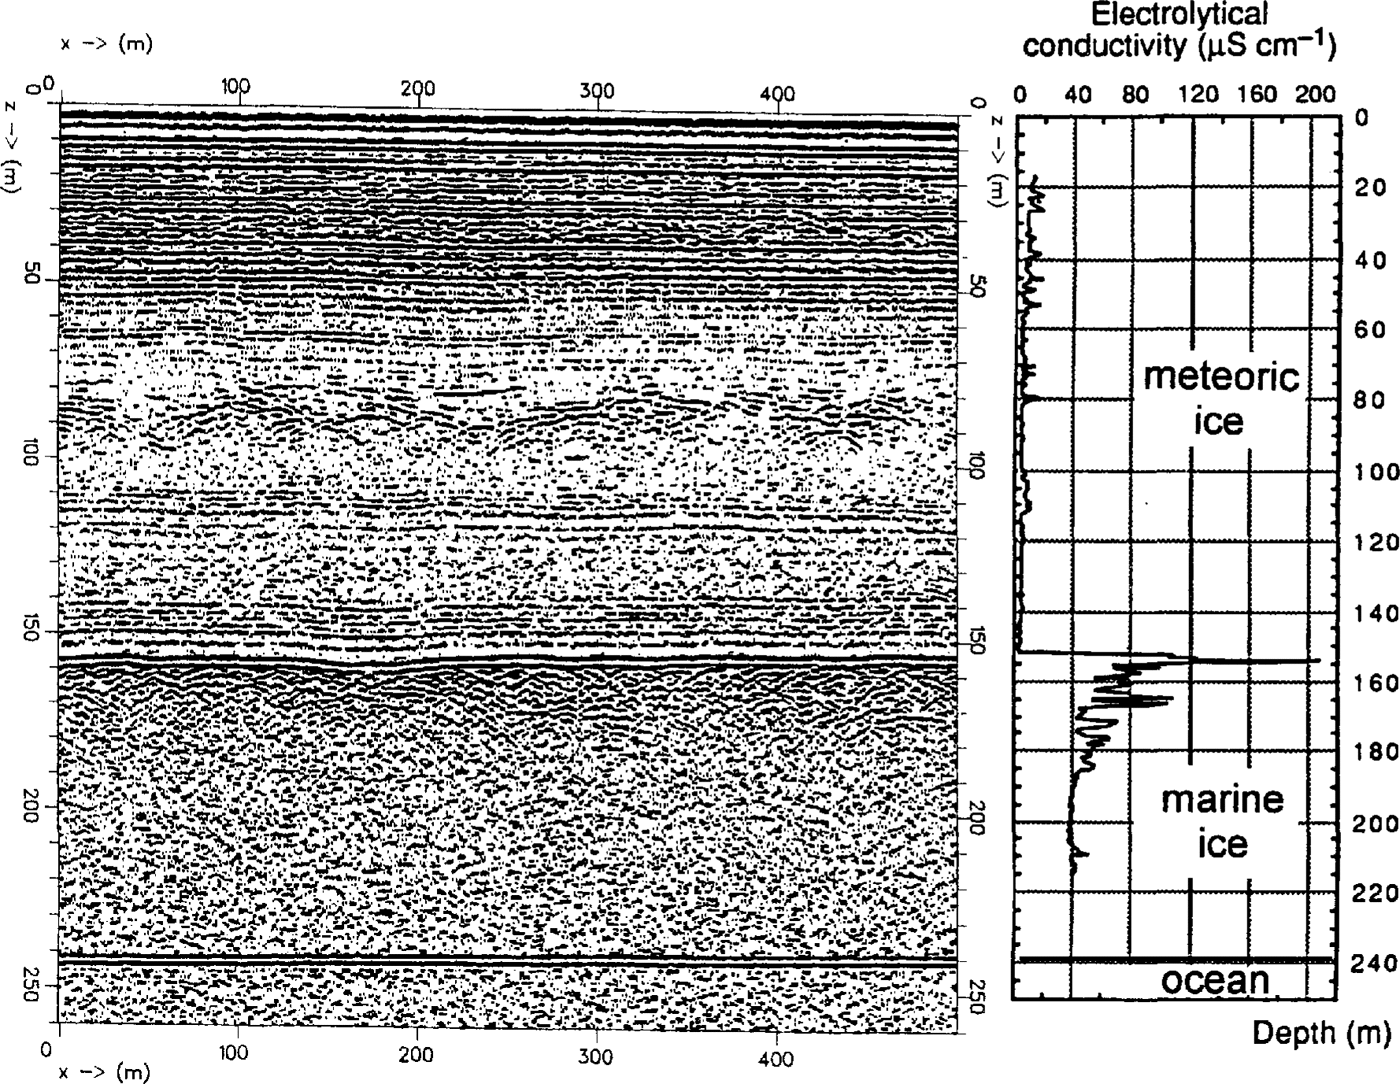
RES profile near the core and hot-water drill site B13. The reflections are correlated with the electrolytical conductivity profile (modified from Oerter and others (1992a)). MMR
Further to the south, the bottom reflection vanishes, partly due to the relatively high absorption in the marine ice, and partly due to a decrease in reflection coefficient which could be explained by a slushy layer at the bottom (Reference Engelhardt and DetermannEngelhardt and Determann, 1987). So the MMR is the most significant internal RES horizon in this area of the FRIS and the lowest detectable reflector in most cases.
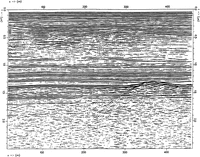
An exception is the area around a line connecting points 330, 235 and 131. Here, continuous stratification of the marine ice is discernible up to 0.5 μs two-way travel time below the MMR corresponding to a depth of 42 m in the marine ice (Fig. 5).
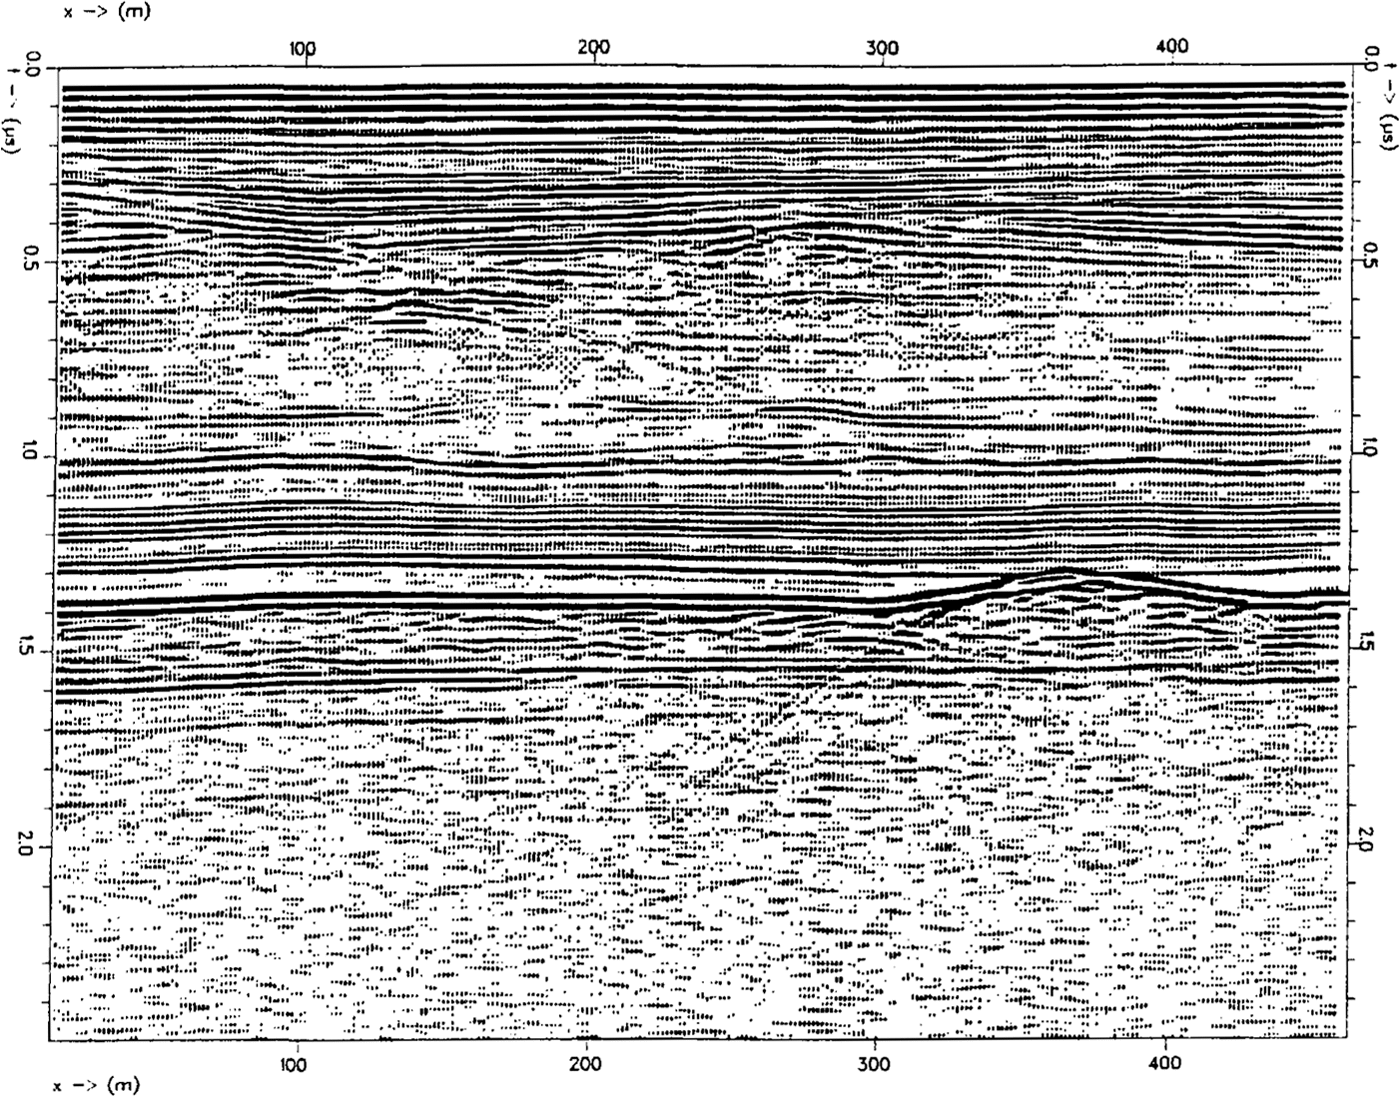
Processed RES profile near point 330. MMR at 1.4μs, continuous strata in the marine ice from 1.4 to 1.9μs.
In general, the RES results show a variety of internal features related to the flow history (bottom melting, grounding, folding, crevassing, bottom freezing) mainly of the meteoric ice. These features correlate well on parallel profiles perpendicular to the flowlines. There is a distinct pattern of undisturbed-slightly disturbed heavily disturbed MMR. This pattern can be extrapolated upstream by following flowlines interpreted on satellite images (Reference Swithinbank, Brunk and SieversSwithinbank and others, 1988) which coincide with changes of MMR signatures. It seems obvious that the most disturbed internal reflections originate in the grounding areas at each side of Henry Ice Rise and in some parts of Doake Ice Rumples. The irregular bottom topography of the ice shelf imposed by the movements of grounded parts is presented from the freezing of a thick marine-ice layer. The appearance of structures at the previous bottom of the meteoric ice is influenced only by strain effects until they are melted out near the ice edge. The distribution of measured and, outside the profile grid, extrapolated MMR features is shown in Figure 6.
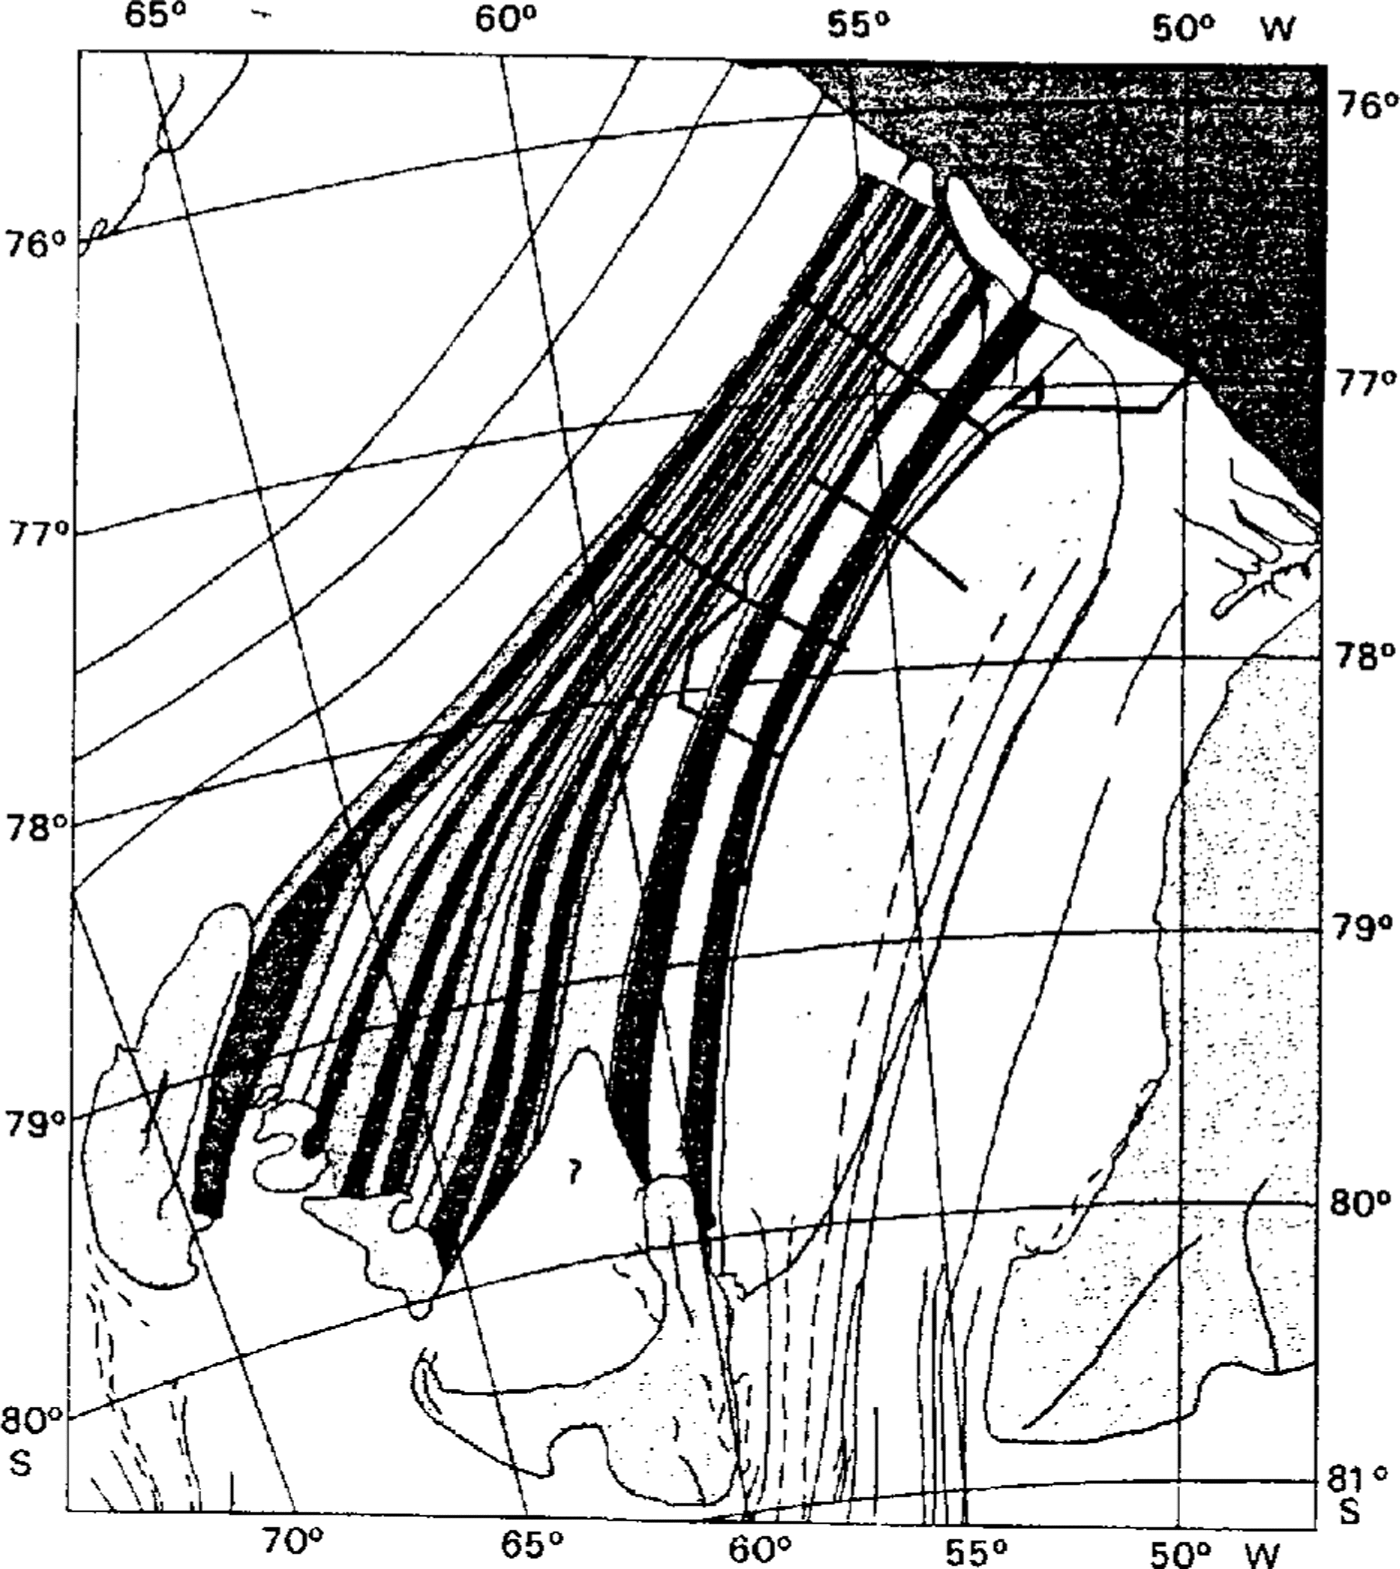
Pattern of MMR characteristics. Degree of shading denotes degree of disturbance, lightest shading meaning an almost smooth interface. Shading and lines outside the profile grid are extrapolated.
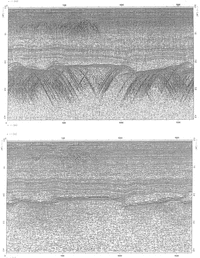
The complicated structure of some high-resolution RES sections can be clarified by applying migration techniques which focus diffracted energy to the sources (Fig. 7). The sample profile measured perpendicular to the flow direction displays folding of internal layers due to lateral compression and step-like features in the deepest reflector (MMR). From the correlation of such internal structures, flowlines can be constructed.

Part of Processed 40 MHz monopulse RES profile downstream of Doake Ice Rumples (77° 30′S58°30′ W). Top. Filtering, Kirchoff migration, time-variable gain.
Amplitudes
The MMR amplitudes are not constant at constant depths. Even in areas where the reflector is smooth, they can vary by a factor of 2. Up to now, MMR amplitudes were investigated in parts of the flowline through the drill-site points 236 (B15) and 61 (B13). The results of two almost perpendicular profiles in the vicinity of B15 (flow direction: 033° Reference Möller, Riedel, Ritter and OerterMöller and others, 1992) are compiled in Figure 8. The MMR amplitudes were picked along the COG sections and the spectra of spatial variation (inverse wavelength in profile direction) were calculated.

.Variations of MMR amplitudes near point 236 (B15). Flow direction is 033°; left: results almost perpendicular to the flow: right: results almost parallel to the .flow. Top: RES profiles showing, rather smooth, MMR with some diffractions; middle: MMR peak-to-peak amplitudes picked from the profile data (arbitrary units): bottom: spectra of spatial variation (amplitudes in arbitrary units) perpendicular and parallel to the flow direction.
Perpendicular to the flow, the spectrum shows strong components between 20 and 50 m and a slight decay for longer periods. The profile almost parallel to the now is dominated by long-period components. Variations in MMR amplitudes are most likely due to changes in salinity and/or interface roughness. Salinity changes are indicated by the different electrolytical conductivities observed at the top of the marine ice measured on ice cores B13 with 210μs cm1 and B15 with 310μs cm1, while the thicknesses of the high-salinity layers are about the same (Oerter and others, 1992a, b).
From the rise time of the reflections and the trailing signals, no evidence for a roughness of the reflecting horizon less than a wavelength can be inferred. However, the grounding history of the meteoric ice could have caused scratch marks with longer periods at the ice-shelf bottom which could have influenced the freezing. The amplitudes and frequencies of the scratch marks decrease downstream towards the drill sites due to strain thinning.
The reason for the observed spatial periods of 20-50 m remains unexplained. From the experimental set-up using a RES wavelength in ice of 4 m, the width of the first Fresnel zone for the MMR at B15 is about 36m. Hence, the measured amplitude variations are possibly an integral of more small-scale effects.
Conclusions
Surface-based measurements with monopulse RES are a powerful tool in the investigation of ice-shelf glaciology, supplementing large-scale airborne RES. From the abundance of information about travel times and reflection amplitudes, only a part has been extracted for this paper.
Much interest in the Filchner-Ronne Ice Shelf project has been focused on sub-ice oceanography. Different internal reflection and diffraction signals measured with the monopulse RES show that the basal freezing conditions vary over the ice shelf. The selection of drill sites for oceanographic investigations could be supported by a knowledge of the different regimes. Vice versa, reflections related to layers found in core drillings can be traced over large parts of the ice shelf to specify boundary conditions for model calculations.
Acknowledgements
Funding of the work by the German Research Foundation (Deutsche Forschungsgemeinschaft) and logistic support by the Alfred-Wegener-Institut, Bremerhaven, are gratefully acknowledged. F. Thyssen initiated and focused the work on problems in the area investigated. Thanks are due to him and especially to K. Grosfeld and M. Jonas for many helpful discussions. Thanks are also due to W. Wilting for his expert electronic engineering, to (chronologically) M. Hoyer, A. Hungeling, K. Grosfeld, L. Hempel, S. Kipfstuhl and N. Rädlein for their help in the field, A. Hungeling and L. Hempel for computer programs used in the evaluation of the RES data, and M. Holthaus and D. Steinhage for their patience in handling gigabytes of data.


