1. Introduction
Measurements of energy fluxes and surface ablation are commonly carried out in temperate glacier settings, primarily for monitoring glacier surface mass balance and collecting data for numerical modelling of glacier response to past and future climate changes. However, melting at the ice/bed interface is not commonly included in calculations and models of glacier mass-balance change, despite Reference Alexander, Shulmeister and DaviesAlexander and others (2011) showing that it may also have considerable importance for the mass balance of some temperate glaciers. The two main mechanisms causing melting at the ice/bed interface are geothermal and frictional heat production. Geothermal flux is well recognized to cause basal melt beneath ice sheets (e.g. Reference Fahnestock, Abdalati, Joughin, Brozena and GogineniFahnestock and others, 2001), but elevated melt rates from this source are often localized and are a forcing external to the glacier itself. Basal melting due to friction at the ice/bed interface occurs in areas of fast basal ice motion and high shear stress (e.g. Reference Joughin, Tulaczyk and EngelhardtJoughin and others, 2003) and is an intrinsic forcing related to glacier thickness, slope and f low characteristics.
Basal melting due to friction has been recognized as an important component of glacier mass balance in polar settings, with melt rates typically increasing with distance from the ice-sheet interior to the ice tributaries and ice streams due to increasing ice velocities (Reference BellBell, 2008). For example, in Antarctica, very slow flow on the order of ∼1-20 m a- 1 yields basal melt of ∼1.4-1.8 mm a- 1 , while in ice-stream tributaries the increased ice velocities of 25-200 m a- 1 contribute to modelled melt rates of 5.56.7 mm a- 1 (Reference BellBell, 2008). Beneath Whillans, Kamb, Bind-schadler and MacAyeal ice streams, Antarctica, mean basal melting rates are ∼2-10mma–1 (Reference Joughin, Tulaczy, MacAyea and EngelhardtJoughin and others, 2004; Reference Beem, Jezek and Van der VeenBeem and others, 2010), increasingto 10-20 mm a - 1 beneath fast-flowing ice-stream tributaries (Reference Joughin, Tulaczyk and EngelhardtJoughin and others, 2003). Slightly higher mean basal melting of 9.1 and 18.7 mm a-1 occurs at Pine Island and Thwaites Glaciers, Antarctica, respectively (Reference JoughinJoughin and others, 2009).
Although the theory of frictional melting is often considered in polar settings, it is rarely discussed for temperate glacier settings. We anticipate that basal melting due to friction may be important in some temperate glacier settings, especially where ice motion is dominated by basal sliding rather than ice deformation. Glaciers exhibiting fast sliding rates are present in places such as New Zealand, Patagonia and Alaska. In this paper, we present a two-dimensional (2-D) model of the basal melting for one of the most-studied temperate tidewater glaciers in Alaska, Columbia Glacier, both before and during its rapid retreat since the early 1980s. We aim to quantify the spatial distribution of frictional melting at the ice/bed interface, as well as the basal melt expressed as a proportion of total melt.
2. Columbia Glacier
Columbia Glacier is a large temperate tidewater glacier in Alaska, USA. It descends from ∼3000 m a.s.l. and terminates at sea level in Columbia Bay, an inlet of Prince William Sound, where ice is rapidly calving at the terminus and subject to melting beneath the surface. In 2011, its length was ∼49 km, with a surface area of ∼850km2 (Fig. 1). Precipitation is on the order of 2-4mw.e. a- 1 close to the terminus (Reference PeltoPelto, 1987), and ablation is 7-10 m w.e. a- 1 at the terminus (Reference Mayo, Trabant, March and HaeberliMayo and others, 1979; Reference Rasmussen, Conway, Krimmel and HockRasmussen and others, 2011). The equilibrium-line altitude of the glacier was ∼1000 m a.s.l. during the period 1950-96 (Reference TangbornTangborn, 1997), ∼30km from the head of the glacier.

Fig. 1. Location map of Columbia Glacier (CG) outlined in black (Landsat Enhanced Thematic Mapper Plus, September 2011). Dots on the map represent 1 km intervals along the centre flowline of the glacier used for calculating mean basal melt rates for the pre-retreat profile 67 km from the glacier head in 1980 and syn-retreat profile 53 km from the glacier head in 2005. As of 2011, the glacier was approximately 850 km2 and 49 km long.
The terminus of Columbia Glacier was relatively stable until ∼1981, when slow retreat began, and subsequently accelerated. The terminus retreated from a position ∼67km from the head of the glacier at a maximum retreat rate of close to 1 km a - 1 in the early 1990s (Reference Nick, Van der Veen and OerlemansNick and others, 2007; Reference Rasmussen, Conway, Krimmel and HockRasmussen and others, 2011). This has resulted in extensive thinning at rates of up to 20 m a- 1 over the lower to middle ablation zone (K. Echelmeyer, unpublished data in Reference O’Neel, Pfeffer, Krimmel and MeierO’Neel and others, 2005). Until the early 1980s, Columbia Glacier terminated on a shallow marine shoal up to 30 m deep; retreat of the glacier into water several hundred metres deep then began. Accelerated ice-flow velocities at the terminus (reaching a maximum of 25 m d–1 or 8000 m a- 1 ; Reference O’Neel, Pfeffer, Krimmel and MeierO’Neel and others, 2005) were not sufficient to keep pace with increased calving rates (Reference Van der VeenVan der Veen, 1995). The retreat of Columbia Glacier is expected to continue until the terminus reaches shallow water (Reference PfefferPfeffer, 2007). This may involve a further ∼-15km retreat from its 2005 terminus position (53 km from the glacier head) until the glacier base is above sea level (Reference O’Neel, Pfeffer, Krimmel and MeierO’Neel and others, 2005).
3. Calculating Basal Melt
The basal melt rate due to friction m can be calculated after Reference Price, Conway, Waddington and BindschadlerPrice and others (2008):
where Tb is the basal shear stress, ub is the basal sliding velocity, Li is the latent heat of fusion of ice (3.34 × 10⁵ J kg-1) and p i is the density of ice (917kgm–3). Using the shallow-ice approximation (SIA),
where g is the acceleration due to gravity (9.8 m s–2), H i is the ice thickness and α is the surface slope. The SIA relies on a small aspect ratio, e = (H)(L) <c 1, where H and L are the glacier depth and width respectively (e.g. Reference Schafer, Gagliardini, Pattyn and Le MeurSchafer and others, 2008). Columbia Glacier has an average width of ∼5000m and an average depth of ∼400m. Since subglacial water pressure is a substantial fraction of the ice overburden pressure in some parts of the glacier (Reference MeierMeier and others, 1994), the shear stress at the bed must instead be approximated using Eqn (3) rather than Eqn (2). The effective shear stress reff considers the presence of water:
where p w is the density of sea water (1027 kg m–3) when the depth of water Hw is below sea level and p w is the density of fresh water (1000kgm–3) when Hw is above sea level. In basal melt calculations for Columbia Glacier, reff is used instead of Tb in Eqn (1). The presence of water causes the effective shear stress to be up to 90% lower than the total basal shear stress in both pre-retreat and syn-retreat (i.e. during retreat) profiles due to buoyancy, leading to a substantial reduction in basal melt. Reference MeierMeier and others (1994) estimated water height in boreholes at two locations 5 and 13 km up-valley of the terminus in summer 1987, but the temporal and spatial variation in the water height for the entire glacier is unknown. Thus, we approximate the depth to water within the glacier for both pre- and syn-retreat profiles by collating available data on the water height within boreholes from Columbia (Reference MeierMeier and others, 1994), Perito Moreno (Patagonia; Reference SugiyamaSugiyama and others, 2011), South Cascade (North America; Reference FountainFountain, 1994) and Bench (Alaska; Reference Fudge, Humphrey, Harper and PfefferFudge and others, 2008) glaciers (Table 1). Borehole data from tidewater glaciers are rare, so glaciers were selected on similarities in their maritime climate regimes. The selection of glaciers was also based on the availability of borehole data from spatially different locations within the ablation and accumulation zones in order to obtain a reference value for the water height inside Columbia Glacier. Data collated from these glaciers yielded an average ratio of Hw/Hi = 0.7. We use this reference value to approximate the depth to water within the glacier. At the terminus of both the pre- and syn-retreat profiles, Hw/Hi>0.7, since the water height within the glacier would not be below mean sea level (Fig. 2).
Table 1. Borehole data from several glaciers used to prescribe the depth to water within Columbia Glacier. Hw/Hi refers to the ratio of water thickness to ice thickness from each borehole. The mean water thickness within the glacier is taken as 0.7 × ice thickness. Abl and Acc refer to the ablation and accumulation zones respectively
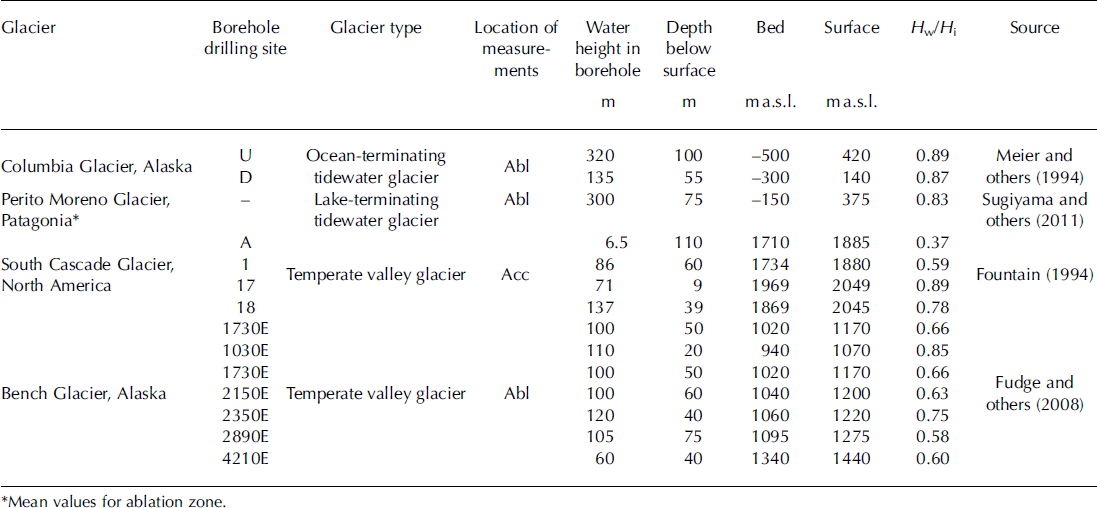
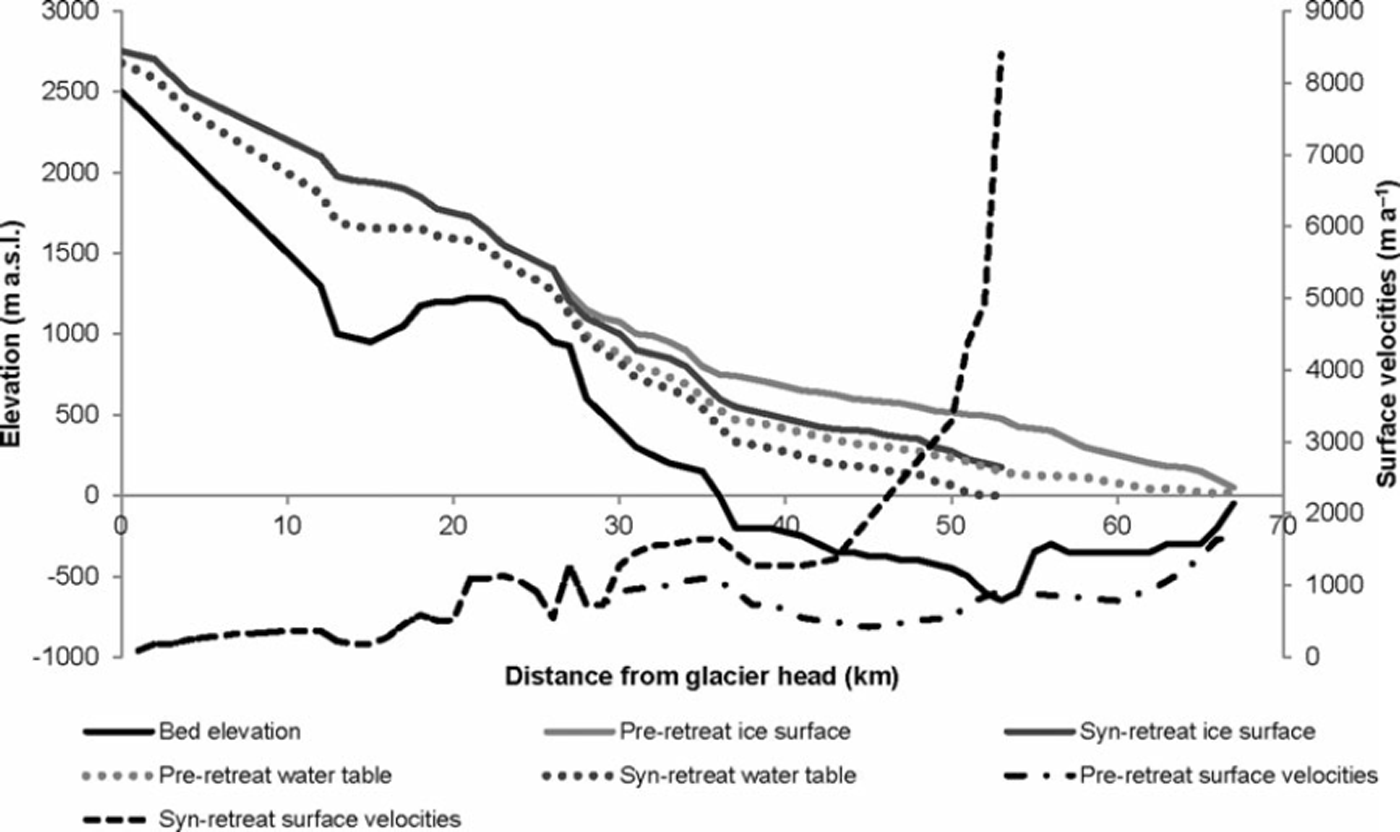
Fig. 2. Surface ice elevations, ice-flow velocities and depth to water elevations of Columbia Glacier pre- and syn-retreat (adapted from Reference KrimmelKrimmel, 2001). The water height within the glacier for both profiles is taken as 0.7 × total ice thickness (see Table 1), except when the water height reaches sea level and the relative thickness of water to ice increases. Note the substantial thinning in the profile during the retreat of up to ∼300m and the dramatic increase in surface velocities of up to 8000 ma-1.
Published data relevant to calculating basal melting rates were collated from a number of studies at Columbia Glacier to develop a 2-D basal melt model, in which melt is calculated at 1 km intervals for the entire length of the glacier (Fig. 1). At each 1 km interval, basal melt is calculated across the cross section of the glacier at 500 m intervals, and melt is averaged for each cross section. For the most part, the glacier ice thickness is less than the interval spacing of 500 m across the cross section. If we use a cross-section interval spacing of 1000 m, the SIA holds glacier-wide and the estimated basal melt rates are the same. Centre-line surface and bed elevations are taken from Reference KrimmelKrimmel (2001) for 1974 (pre-retreat) and 1999 (syn-retreat) as shown in Figure 2. We use the 2005 glacier length (53 km) for calculating basal melt during retreat. The surface elevation is assumed to be spatially constant across the glacier cross section and the bed profile of the glacier approximated by a parabola, where Hi (m) across the cross section is given as

where y is a location along the cross section determined by the distance from the glacier sides to y, Hmax is the maximum ice thickness and w is the glacier half-width.
Surface ice-flow velocities along the main Columbia Glacier centre line have been measured on the lower elevations and modelled elsewhere by Reference KrimmelKrimmel (2001) for 1978 and 1999 (Fig. 2). While there are several smaller branches feeding into the central flowline of the glacier, we only consider the main flowline (Fig. 1) since data for other branches are not sufficient to calculate basal melt rates for those regions. Surface ice-flow rates have increased dramatically in the lower ablation zone of Columbia Glacier (up to 8000 m a-1) since the onset of its rapid retreat in the early 1980s, although flow rates have remained relatively constant in the accumulation zone at ∼0-1000 m a-1 (Fig. 2). Surface velocities for each cross section are approximated by assuming an equal contribution of plug (uniform) flow and parabolic flow, which yields symmetrical, U-shaped flow whereby velocities are highest at the centre line of the glacier and lowest at the glacier sides (Fig. 3).
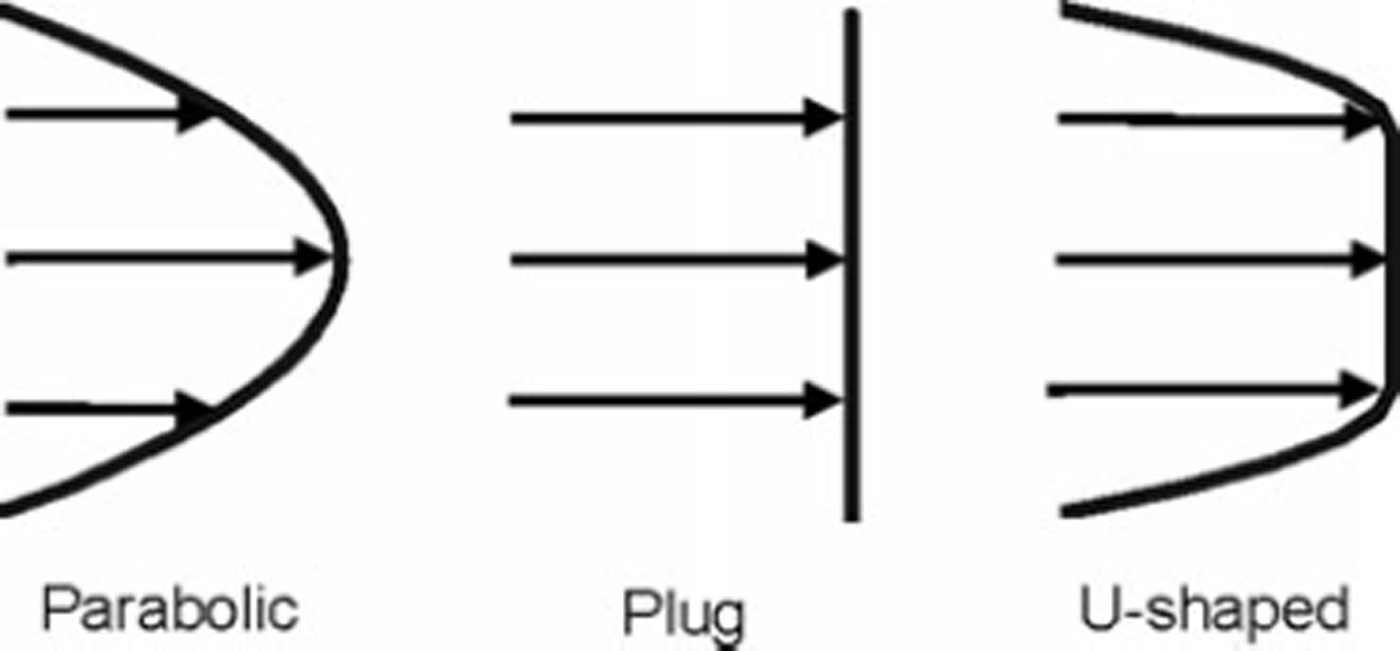
Fig. 3. Types of glacier flow used to determine surface velocities across each cross section of the glacier, because centre-line velocities are only available for the length of the glacier (Reference KrimmelKrimmel, 2001). We prescribe a U-shaped flow distribution, which is an intermediate distribution between parabolic and plug flow, wherein the central part of the glacier moves by uniform (plug) flow and transitions into much slower flow close to the glacier sides, which is approximated by parabolic flow. The sensitivity of the different flow distributions on basal melt production is provided in Table 2.
Fast basal sliding is thought to be a response to the high water pressures within Columbia Glacier (Reference MeierMeier and others, 1994). The basal sliding velocity ub across each cross section is calculated as a function of the water pressure (Reference Budd, Keage and BlundyBudd and others, 1979; Reference BindschadlerBindschadler, 1983):

where k is a sliding coefficient (9.2 × 10⁸ma–1 Pa0.5) and Neff is the effective pressure (pigHi-pwgHw). This value of k was chosen to yield a basal sliding rate 90% that of the surface velocities at the terminus, which matches the basal sliding velocities calculated by Reference Meier and PostMeier and Post (1987) for this region of the glacier. The constants in Eqn (5) take values obtained by Reference Nick, Van der Veen and OerlemansNick and others (2007) using multivariate analysis to find a best fit between modelled and observed velocities, yielding n=3 and p = 3.5. The internal deformation (ud) component of flow is calculated after Reference Cuffey and PatersonCuffey and Paterson (2010):
where A is the creep parameter of Glen’s flow law (Reference NyeNye, 1952). We use A = 2.4 x 10⁻¹⁶ Pa-3 a- 1 , which is reflective of temperate glacier ice (Reference PatersonPaterson, 1994). This yields internal deformation that is 10% of the total surface velocities at the terminus, which is consistent with calculations of Reference Meier and PostMeier and Post (1987). Instead of adjusting k and A to account for variation in bed roughness, basal ice properties and internal ice temperature, ub and ud are proportionally adjusted with respect to each other so that us= ub + ud. This process yields mean ub/us = 0.8 with a range of 0.4-1.0 over the glacier for both the pre- and syn-retreat profiles.
4. Results and Discussion
4.1. Sensitivity analysis
Analysis of model sensitivities was carried out on the parameters used to calculate basal melt (Table 2). The parameters analysed are those around which most variation lies, and thus the aim of the analysis is to provide an indication of the expected variation associated with the model outputs. Combining the minimum and maximum values for each parameter investigated in the sensitivity analysis allows us to obtain an estimated range of basal melting for Columbia Glacier. Mean basal melt over the entire glacier ranged from 23 to 86 mm a- 1 (‘best’ estimate 61 mm a-1) and 30 to 218 mm a- 1 (‘best’ estimate 129 mm a-1) for the pre- and syn-retreat profiles respectively. We judge the ‘best’ estimate of mean basal melt to be that obtained using the reference values for glacier characteristics outlined in Section 3 (i.e. water height in boreholes, surface velocities and bed geometry), which are based on available data. Basal melt values reported in the following subsections, unless otherwise stated, are for the ‘best’ estimate of basal melt.
Table 2. Sensitivity analysis of variables used to calculate basal melt for Columbia Glacier. The ‘best’ estimate of mean basal melt was 61 and 129 mm a–1 for the pre- and syn-retreat profiles respectively. Percentages given alongside the melt values indicate the difference from the calculated mean basal melt
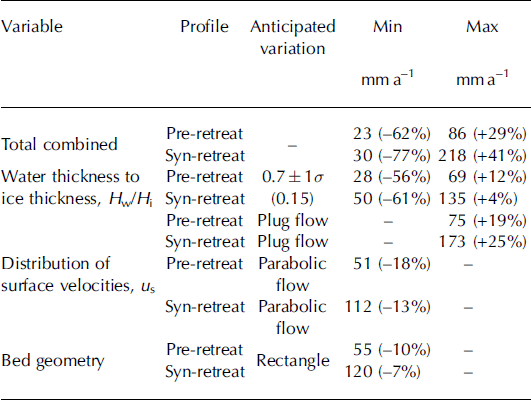
The variable for which there is most limited knowledge is the water height within Columbia Glacier. While Reference MeierMeier and others (1994) have estimated the depth of water within boreholes in several locations near the terminus, the temporal and spatial variation in the depth to water for the entire glacier is unknown. For this reason, we have used an anticipated variation of the water-thickness to ice-thickness ratio Hw/Hi ± 1 a to account for changes in the depth to water in boreholes from several glaciers with a similar climate regime to Columbia Glacier (Table 1). Basal melt production is most sensitive to the change in this parameter. The range of mean basal melt due to 1 a changes in the water height is 28-69 and 50-135 mm a- 1 for the pre- and synretreat profile respectively (Table 2). Basal melt reduces by 56% and 6 1 % for the pre- and syn-retreat profiles when Hw/ Hi is high (i.e. Hw/Hi = 0.86) since the high water height within the glacier reduces the effective shear stress significantly, in some places to close to zero.
Surface velocities of the glacier that are used to determine the ratio of basal sliding to internal deformation are expected to take on a U-shaped symmetrical pattern. U-shaped flow is an intermediate distribution between parabolic and plug flow, wherein the central portion of glacier moves by uniform (plug) flow and transitions into much slower flow close to the glacier sides, which is approximated by parabolic flow. A purely parabolic surface profile yields basal melt 18% and 13% less than the mean basal melt for the pre- and syn-retreat profiles (Table 2). In contrast, the presence of purely plug flow increases basal melt by 19% and 25% for the pre-and syn-retreat profiles. Plug flow typically occurs where basal sliding velocities are high and where it is the predominant mechanism of ice motion (Reference SharpSharp, 1988). We assume that the glacier bed is parabolic in shape, a common assumption in the absence of sufficient bed elevation data (e.g. Reference Cuffey and PatersonCuffey and Paterson, 2010). If the bed cross section is rectangular, basal melt reduces by only 10% and 7% for the pre- and syn-retreat profiles respectively.
4.2. Pre-retreat
The range of basal melt (averaged across the entire cross section) for each 1 km interval along the Columbia Glacier pre-retreat is shown in Figure 4a. Taking into account the anticipated maximum variation calculated from the sensitivity analysis, the model output indicates that the mean basal melt for the glacier was 61 mm a- 1 , with a range of 23-86 mm a- 1 . We calculate the highest basal melt rates 2 5 - 35 km from the glacier head (Fig. 4a) due to high effective shear stresses as a result of ice thicknesses greater than 700 m and steep surface slopes of ∼6° as well as estimated basal ice velocities reaching ∼500ma–1 . Within this zone, the mean basal melt rate was estimated as 120 mm a- 1, reaching a maximum of 210 mm a- 1 . Outside this region of the glacier, basal melting was considerably lower, with a mean of 50 mm a- 1 . Mean basal melting at the near-terminus (47-53 km from the glacier head) was 60 mm a- 1 . Since the glacier was close to flotation in this zone prior to and during retreat (i.e. Hw/Hi = 0.8-0.9), modelled basal melt rates are likely to be slightly overestimated.

Fig. 4. (a) Modelled basal melt averaged over each cross section at the bed of Columbia Glacier before the onset of retreat in the 1980s, and (b) modelled basal melt averaged over each cross section at the bed during retreat. Lowest basal melt is predicted in the upper accumulation zone (0–25 km) where ice thicknesses and basal sliding rates were low, while highest basal melt is predicted in the lower accumulation and upper ablation zones (25–35km from the glacier head). Error bars for each 1 km length indicate the expected range in basal melt (see Section 4.1 for further details). Note the increase in basal melt at the terminus during retreat.
4.3. Syn-retreat
The modelled basal melt rate during the retreat of Columbia Glacier was more than twice the modelled basal melt rate prior to retreat at 129 mm a- 1 , with a range of 30-218 mm a- 1. This is approximately an order of magnitude greater than typical mean basal melt rates for polar glaciers and ice streams (e.g. Whillans Ice Stream, Antarctica, 3-7 mm a-1 (Reference Beem, Jezek and Van der VeenBeem and others, 2010); MacAyeal Ice Stream, Antarctica, 9.6 mm a- 1 (Reference Joughin, Tulaczy, MacAyea and EngelhardtJoughin and others, 2004); Thwaites Glacier, Antarctica, 18.7 mm a- 1 (Reference JoughinJoughin and others, 2009)). The increase in basal ice-flow velocities from pre-retreat rates of ∼1000 m a- 1 to a maximum of ∼8000 m a- 1 at the terminus during the rapid retreat (Reference KrimmelKrimmel, 2001) likely resulted in an increase in basal melting at the glacier terminus (47-53 km from the glacier head; Fig. 4b). Within this zone, the modelled basal melt rate had a mean of 260 mm a- 1 and reached a maximum of 430 mm a- 1 . The basal melt estimate of 53 mm a- 1 in the upper 0-25 km of the accumulation zone during retreat is similar to the value of 48 mm a- 1 estimated prior to retreat in the same zone. The area 25-35 km from the glacier head had a small increase in ice-flow velocities from the 1980s, resulting in slightly higher mean calculated basal melt during retreat of 200 mm a- 1 up to a maximum of 410 mm a- 1 . The model predicts maximum basal melting at the terminus of Columbia Glacier, with a value of 830 mm a-1 at the centre line compared with only 160 mm a- 1 before the retreat of the glacier.
4.4. Glacier mass balance
If we assume the same climatic conditions before and during rapid retreat of the terminus of Columbia Glacier, allowing application of surface ablation rates calculated by Reference Rasmussen, Conway, Krimmel and HockRasmussen and others (2011) for 1948-2007, the contribution of the basal melt to total (surface plus basal) melt can be determined. Reference Rasmussen, Conway, Krimmel and HockRasmussen and others (2011) calculate surface ablation for the entire glacier from a surface mass-balance model calibrated with field data mostly from 1977-78. We find from the model output that basal melt due to friction contributed an estimated 3% and 5% to the total melt for the pre- and syn-retreat periods respectively. Taking into account the sensitivity of the model to water height in boreholes, surface velocities and bed geometry, the contribution of basal melt to total melt is 1-4% and 1-7% for pre-and syn-retreat profiles respectively. The proportion of basal melt to total melt, averaged for each cross section, as a function of distance from the glacier head, is shown for both pre- and syn-retreat profiles in Figure 5. For both cases, there are two distinct zones. The upper 40 km of the glacier maintains a high proportion of basal melt to surface melt for both pre- and syn-retreat profiles. In the lower zone of the glacier (beyond 40 km from the glacier head) the proportion is much lower for both profiles, reflective of the high assumed water height and high surface melt rates. High ice-flow rates yield a slightly higher fractional contribution from basal melt close to the terminus during retreat.
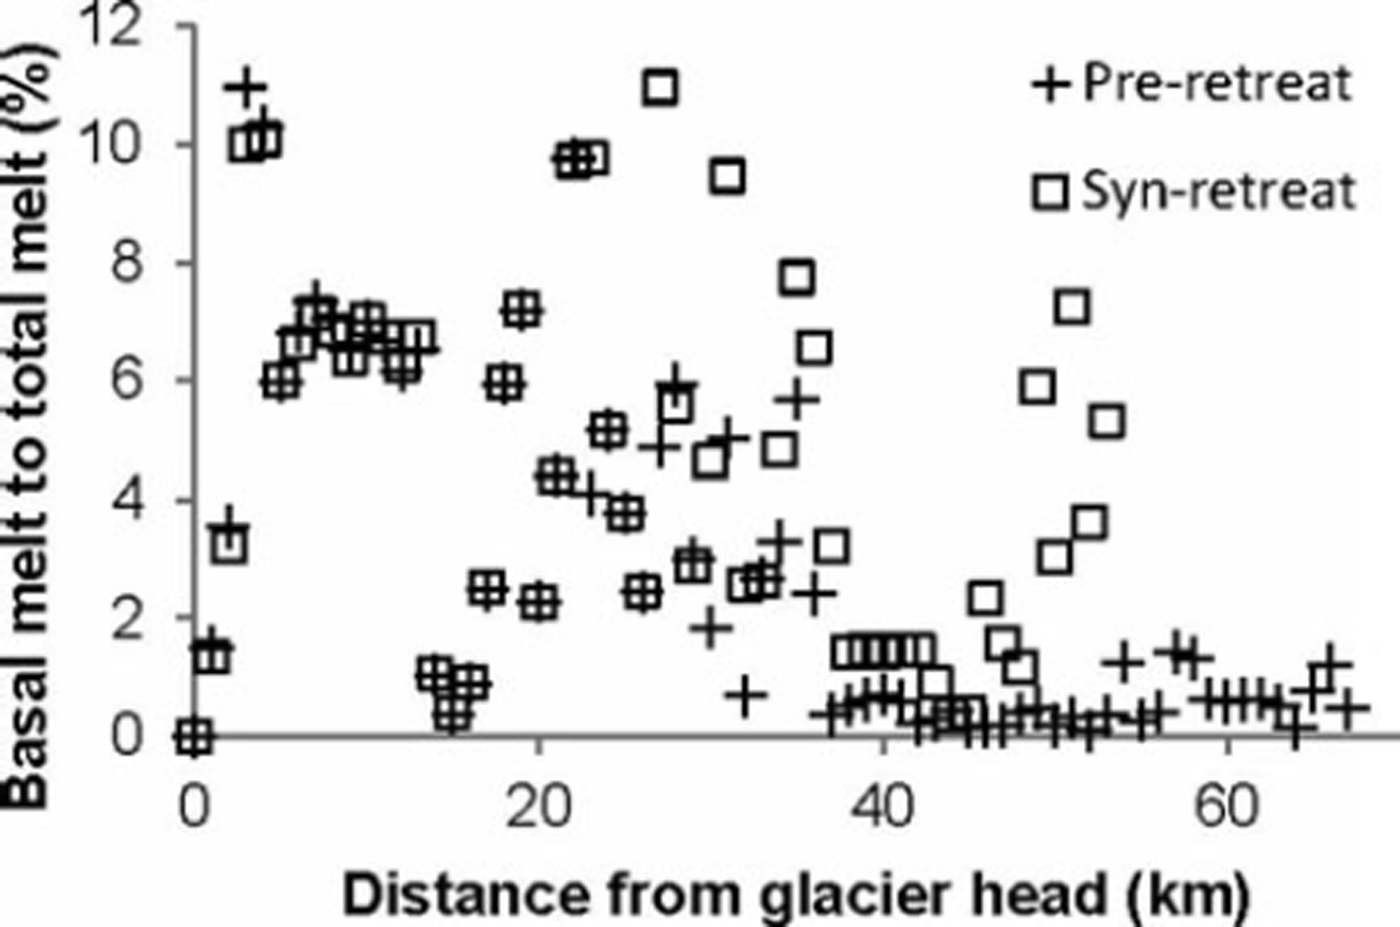
Fig. 5. Calculated percentage contribution of basal melt to total melt (surface plus basal) at Columbia Glacier as a function of distance from the glacier head for both the pre-retreat profile (pre-1980s) and the syn-retreat profile (post-1980s). In both cases, there are two distinct zones. The upper 40 km of the glacier maintains a high proportion of basal melt to surface melt for both pre- and syn-retreat profiles. Beyond 40 km from the glacier head, the proportion of melt that occurs basally is less for both profiles, indicative of high surface melt rates. Expected variation associated with the percentage of basal to total melt is not shown, for figure clarity.
For the period 1948-2007, Reference Rasmussen, Conway, Krimmel and HockRasmussen and others (2011) define three main periods for annual mass balance. These are 1948-69, 1970-94 and 1995-2007, with annual mass balance of +0.18, +0.92 and -0.86 m w.e. a- 1 respectively. If mean syn-retreat basal melting of ∼ 130 mm a- 1 (0.13 m a-1) for the glacier were included as part of the annual mass balance, then the net mass balance would have become more negative. While basal melting due to friction during retreat accounted for an estimated 5% of the total melt for the glacier, for the aforementioned three main periods identified by Reference Rasmussen, Conway, Krimmel and HockRasmussen and others (2011) it would have altered the net mass balance by 72%, 14% and 15% respectively. Therefore, in some temperate glacier settings it may be important to consider basal melting as a component of the annual mass balance. If basal melting is a significant component of the annual mass balance, it may result in non-negligible alterations in net mass balance and it may change interpretations of whether a glacier is in positive or negative balance.
5. Conclusions
We have developed a 2-D model to estimate the possible basal melt produced at the base of a fast-flowing temperate tidewater glacier, Columbia Glacier. This approach was based on the collation of published data on glacier surface and bed profiles, ice-flow velocities and surface melt, as well as borehole water height data from several other glaciers. Thus, the model is limited by the availability of data required to obtain reference values for calculating basal melt. Our model does not include additional basal melting sources at the ice/ocean interface through subaqueous melting or strain heating due to the deformation of basal ice. Despite the limitations of the model, the sensitivity analysis provides a useful indication of the expected variation in basal melt estimates from the reference values used. From our model estimates of basal melt, we can conclude the following:
Basal melting in temperate glaciers can be an order of magnitude greater than in polar glacier settings. Prior to the retreat of Columbia Glacier (pre-1980s), we estimate the mean basal melt due to friction as 61 mma–1, and during retreat (1980s onwards) this increased to 129mma–1.
For both pre- and syn-retreat profiles of Columbia Glacier, the estimated mean basal melt was 50 mma–1 in the upper accumulation zone (0–25 km) where ice thicknesses and basal sliding rates were low. In the lower accumulation and upper ablation zones (25-35 km from the glacier head), estimated mean basal melt increased to 120 and 200 mm a- 1 for the pre- and syn-retreat profiles, respectively. This is due to an increase in ice thickness from ∼300m to >700m, steep surface slopes of ∼ 2 - 5 ° and basal sliding velocities of ∼-1000ma–1.
Despite a reduction in basal resistance during glacier retreat in tidewater settings, basal melt can still increase if ice velocities are sufficiently high. Whereas we predict the stable pre-retreat Columbia Glacier terminus had mean basal melt of up to 60 mm a- 1 , mean basal melt of up to 200 mm a - 1 is modelled beneath the retreating lower glacier terminus due to a substantial increase in basal sliding velocities.
Basal melting is an unrecognized and potentially important component of glacier mass balance. At Columbia Glacier, 3% and 5% of the total melting may be attributed to basal melting for the pre- and syn-retreat glacier profiles respectively. This is the key finding of the paper.
Acknowledgements
We acknowledge the outstanding research done by previous authors on Columbia Glacier, without which this paper would not have been possible. We are grateful for constructive reviews by two anonymous reviewers, and the thoughtful comments of Scientific Editor Tavi Murray and Chief Editor Gwenn Flowers, which greatly helped improve the quality of the paper.


