Introduction
Satellite passive-microwave remote Sensing is the main Source of global information on Sea-ice concentration and extent (Reference Gloersen, Campbell, Cavalieri, Comiso, Parkinson and ZwallyGloersen and others, 1992), by virtue of its wide-swath coverage, ability to penetrate cloud cover and polar darkness, and its ability to distinguish Sea ice from open ocean. indeed, these data form the cornerstone of high-latitude process Studies, trend and climate-change/variability analyses. although critically important, the data products have never been adequately validated for east antarctic conditions. in September–october 2003, an australian-led international experiment dedicated to this task (the antarctic remote ice Sensing experiment (arise)) took place on board the icebreaker rsv Aurora Australis in the region 64–65.5˚ S, 112–119˚ e (fig. 1). the ice edge at this location and at this time of year is typically at 60–62˚ S. the main aim was to acquire data over a 3–4 week period in the early austral Spring with which to validate Standard Sea-ice geophysical products routinely retrieved from the advanced microwave Scanning radiometers (AMSRs) on board nasa’s aqua Satellite (2002–present) and the japanese advanced earth observing Satellite ii (adeos-ii) (2002–03). these are Sea-ice concentration and extent (at a Spatial resolution of 12.5 and 25 km) and two new products, Sea-ice temperature, T I, and Snow-cover thickness on Sea ice, h s (Reference Markus, Cavalieri and JeffriesMarkus and cavalieri, 1998).
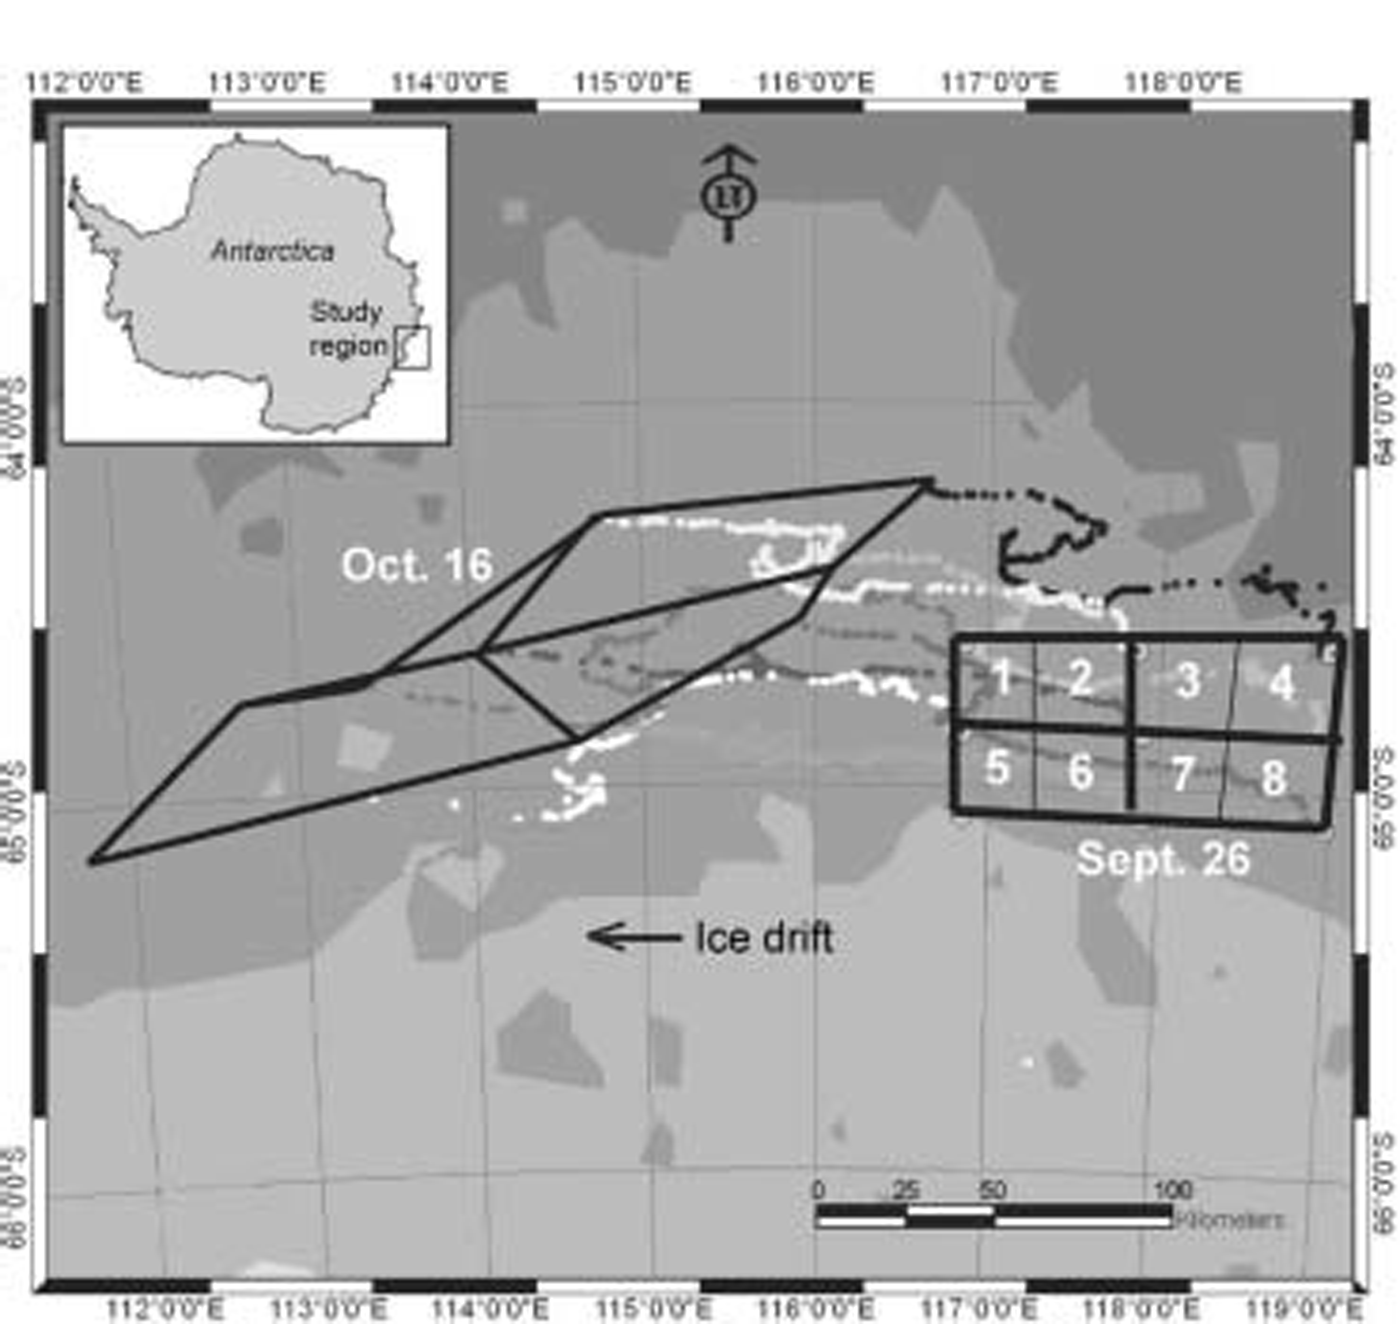
Fig. 1. Map of the Study area Showing experimental grid delineated by the array of Satellite-tracked ice beacons deployed on 26 September 2003 (numbered 1–8), and the drift tracks and array Shape on 16 October. The inset Shows the location of the Study region in East Antarctica.
The Standard AMSR-E algorithm computes h s from the Spectral gradient ratio of brightness-temperature (T B) data from the 18.7 and 36.5ghz channels, vertical (v) polarization (Reference Markus, Cavalieri and JeffriesMarkus and cavalieri, 1998; Reference Comiso, Cavalieri and MarkusComiso and others, 2003). the h s product is an average over the product pixel area (12.5×12.5 km) including thin ice but excluding open water. as Such, it relies on the accurate retrieval of ice concentration. the algorithm is only effective under dry-snow conditions, as the onset of melt Sends the Surface emissivity close to unity while melt-ponding causes it to drop to that of open water. the AMSR-E h s product is a 5 day running average, in order to minimize uncertainties due to variability in weather effects, Snow density and grain Size. the overall precision goal is ≤±5 cm (Reference Comiso, Cavalieri and MarkusComiso and others, 2003; j.c. comiso and others, http://eospso.gsfc.nasa.gov/validation/index.php). the value of T I represents the physical temperature of the Sea-ice layer emitting most of the radiation at 6.925ghz (at a product resolution of 25 km). this formulation is based on the assumption that for dry-snow conditions the Snow cover is transparent at this frequency and T I represents the Snow–ice interface temperature for first-year (FY) antarctic ice, the Surface of which is opaque due to its relatively high Salinity. please See Reference Comiso, Cavalieri and MarkusComiso and others (2003) for more information on the theoretical and empirical foundations of the AMSR-E algorithms. all products are archived at the us national Snow and ice data center (NsIDC), boulder, co, UsA (d.j. cavalieri and j. comiso, http://nsidc.org/data/nsidc-0002.html).
Arise represents the first focused effort at validating important Satellite data collected over east antarctic Sea ice, and forms a component of the nasa AMSR for earth observing System (eos) (AMSR-E) validation program (Reference steffenSteffen, 2003; d.j. cavalieri and j.c. comiso, http://eospso.gsfc.nasa.gov/ftp_atbd/review/amsr/atbd-amsr-seaice.pdf; j.c. comiso and others, http://eospso.gsfc.nasa.gov/validation/index.php). the overall aim of this program is to improve algorithm performance and reduce data product uncertainty by (a) establishing algorithm retrieval accuracies based on Statistical relationships between AMSR-E Sea-ice parameters and those Same parameters derived from independent data, and (b) quantifying error characteristics as a function of a range of atmospheric and Surface conditions. in this paper, we describe the data collection Strategy, datasets acquired and initial results from arise.
Data and Techniques
Sampling took place within an area defined by an array of nine Satellite-tracked global positioning System (GPs) beacons deployed on ice floes by helicopter (on 26 September 2003), and South of the antarctic divergence to ensure westward drift. the beacons initially delineated a 100×50km region divided into eight 25 ×25 km gridcells equivalent to AMSR-product pixels (fig. 1). the main challenge was to acquire data over a wide area (representative of AMSR pixels), but over periods Short enough to counteract the effects of temporal variability. this was addressed by a hierarchical Strategy involving the following measurements to characterize ice and Snow conditions over local to regional Scales:
Detailed in Situ measurements collected on floes adjacent to the Ship (13 ice Stations), including Snow and ice thickness and temperature, ice Structure and Salinity (cores), and Snow Stratigraphy, grain Size, density, Salinity and wetness along 50–500m transects. temperature was measured using an omega 44033 thermistor (precision ±0.2˚c) attached to an omega 866c reader. ice conditions Sampled in the experimental boxes (see fig. 1) ranged from thin (<40.0cm thick) level floes with a thin Snow cover to thick highly deformed first-year floes with a blocky Surface on the 1–2m vertical Scale and a deep Snow cover dominated by drift. more extensive measurements were collected at ice Station 4, which lasted from 1 to 5 october and was revisited on 14 october.
Additional in Situ point measurements of ice temperature (T I) and Snow thickness (h s), and Snow Surface temperature, were collected at mini-stations by helicopter, with a view to Sampling as many floes as possible within a given gridcell in as Short a time as possible on a given day. at each Site, h s was measured at up to 40 different locations, and Snow/ice interface temperatures at up to 8 locations, at about 1m intervals along each transect. air and Snow Surface temperature were also measured. in total, 181 mini-stations were conducted at randomly chosen locations on 24 flights in Six of the eight cells (from 26 September through 12 october). as the ice was often very rough, the helicopters landed on the closest ‘smooth’ area. data were collected on these Smooth regions, and on a rough area nearby.
Underway Surface temperature and ice-/snow-thickness measurements from instruments attached to the Ship (thermal infrared (ir) radiometers and digital videos), plus Standard hourly observations of ice thickness, concentration and Snow-cover thickness from the bridge (Reference Worby and I. AllisonWorby and allison, 1999). results from the radiometer data are given in Reference scambos, Haran and R. MassomScambos and others (2006) and Reference Tamura, Ohshima, Enomoto, Tateyama, Ushio and MassomTamura and others (2006).
Aerial photography and coincident Surface (skin) temperature measurements, using a Six-megapixel nikon d1x digital aerial camera and a heitronics kt-19.85-ii thermal ir radiometer (spectral range 9.6–11.0 μm) mounted in the helicopter fuselage. aerial photos were acquired over eight transects on Six Separate days, with flights circumnavigating the gridcells, covering a cell, and providing a meridional characterization of the ice north of casey Station (at about 110˚ e). these data form a cornerstone of the validation, extending the in Situ observations and enabling interpretation of intermediate-resolution Satellite data. they provide information on ice concentration, the distribution of thin ice and open water, rough vs Smooth ice, and the presence/absence of Snow. a third helicopter towed an electromagnetic (em) ice-thickness profiler, the alfred wegener institute’s em-bird (Reference Haas, Edeler, Schürmann, Lobach and SengpielHaas and others, 2002), to provide near-coincident ice-thickness data to an accuracy of ±10 cm on a point-by-point basis.
The aerial-photo transects were Spatially and temporally extended by high-resolution Satellite microwave data from the multi-polarization envisat advanced Synthetic aperture radar (asar). this coverage was extended Spatially by medium-resolution Satellite visible to thermal-ir data, i.e. envisat medium-resolution imaging Spectrometer (meris), us national oceanic and atmospheric administration (noaa) advanced very high resolution radiometer (avhrr), terra multi-angle imaging Spectrometer (misr), us defense meteorological Satellite program (dmsp) operational line-scan System (ols) and terra moderate-resolution imaging Spectroradiometer (modis). the aim is to use the in Situ and aerial observations to validate ice concentrations from these Satellite data, then to use the latter to validate the coarser-resolution AMSR-E ice concentration product.
Other relevant programs included ground-based em interference (emi) measurement of ice thickness; the testing of new Surface-based ice- and Snow-thickness radars (Reference Gogineni, Wong, Krishnan, Kanagaratnam, Markus, Lytle and SteinGogineni and others, 2003) developed by the center for remote Sensing of ice Sheets, university of kansas; and the application by the alfred wegener institute of a commercial radar System (malå geoscience) for Snow-thickness measurement (Reference OttoOtto, 2004).
The ice-beacon locations were used to determine Sampling Sites for both mini-stations and full ice Stations throughout the experiment, enabling a lagrangian Sampling Strategy to account for ice drift. during the 18 days of the ice experiment (26 September–14 october 2003), the ice beacons drifted 205–330 km westward (average 11.4–18.5 kmd–1). the array also underwent considerable deformation (fig. 1). daily beacon positions were used to calculate rates of ice divergence and convergence as guidance for Ship access to different parts of the array. air temperatures ranged from cold (approximately –14˚c) and dry to warm (approximately 0˚c), enabling the evaluation of algorithm performance over Stable (freezing) to variable temperature and Snow-cover regimes and melt.
Results
snow-thickness and ice-temperature measurements: the mini-station program
A major goal of this experiment was to validate Snow-thickness (h s) and ice-temperature (T I) retrievals from the AMSR Sensor. to validate the h s product, it was essential to obtain Snow-depth Statistics representative of AMSR pixel Scales, for which we adopted a two-step approach. first, ‘ice type’ is classified using aerial photography into open water, nilas (zero h s), Smooth Snow-covered ice and rough Snow-covered ice. each of these ice types is assigned a Snow thickness to enable calculation of the area-averaged Snow thickness.
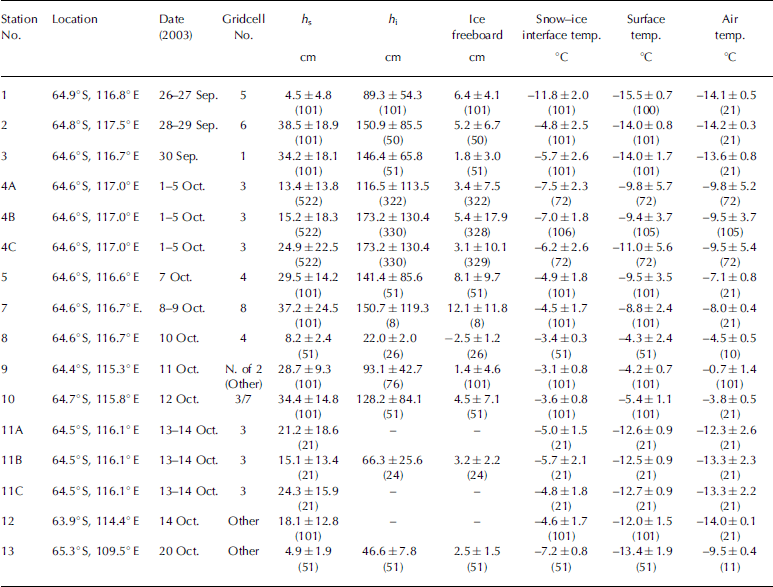
A total of 181 in Situ Snow-thickness (h s) and Snow–ice interface temperature (it) transects were measured on both ‘rough’ and ‘smooth’ Sea ice. averages and Standard deviations for mini-station h s measurements, as a function of ice type, are given in table 1. the thickest Snow (>100 cm) occurs in drifts on deformed thick FY ice with a rough Surface. Summary plots of average h s for each gridcell are given in figure 2a and b. this ranged from 5 to 23 cm (std dev. 4–19 cm) on Smooth floes and from 25 to 42 cm (std dev. 15–24 cm) on rough ice. in total, 1495 measurements of it were collected. these data are Summarized in table 2. on Smooth ice, averages of it ranged from –5 to –11˚c (std dev. 1–2˚c), while values over rough ice averaged –5 to –8˚c (std dev. 1.7–3.7˚c). an apparent near-linear relationship between h s and it is Shown in figure 3, Showing plots from three different floes for different air temperatures. it Should be noted that the Snow–ice interface temperature depends on the air-temperature history over the hours to days leading up to the observation, and care Should be taken when interpreting point data in isolation. work is underway to combine the mini-station data with data collected during the longer ice Stations to obtain estimates of regional h s and it (see table 3 for basic Statistics of full Station measurements).
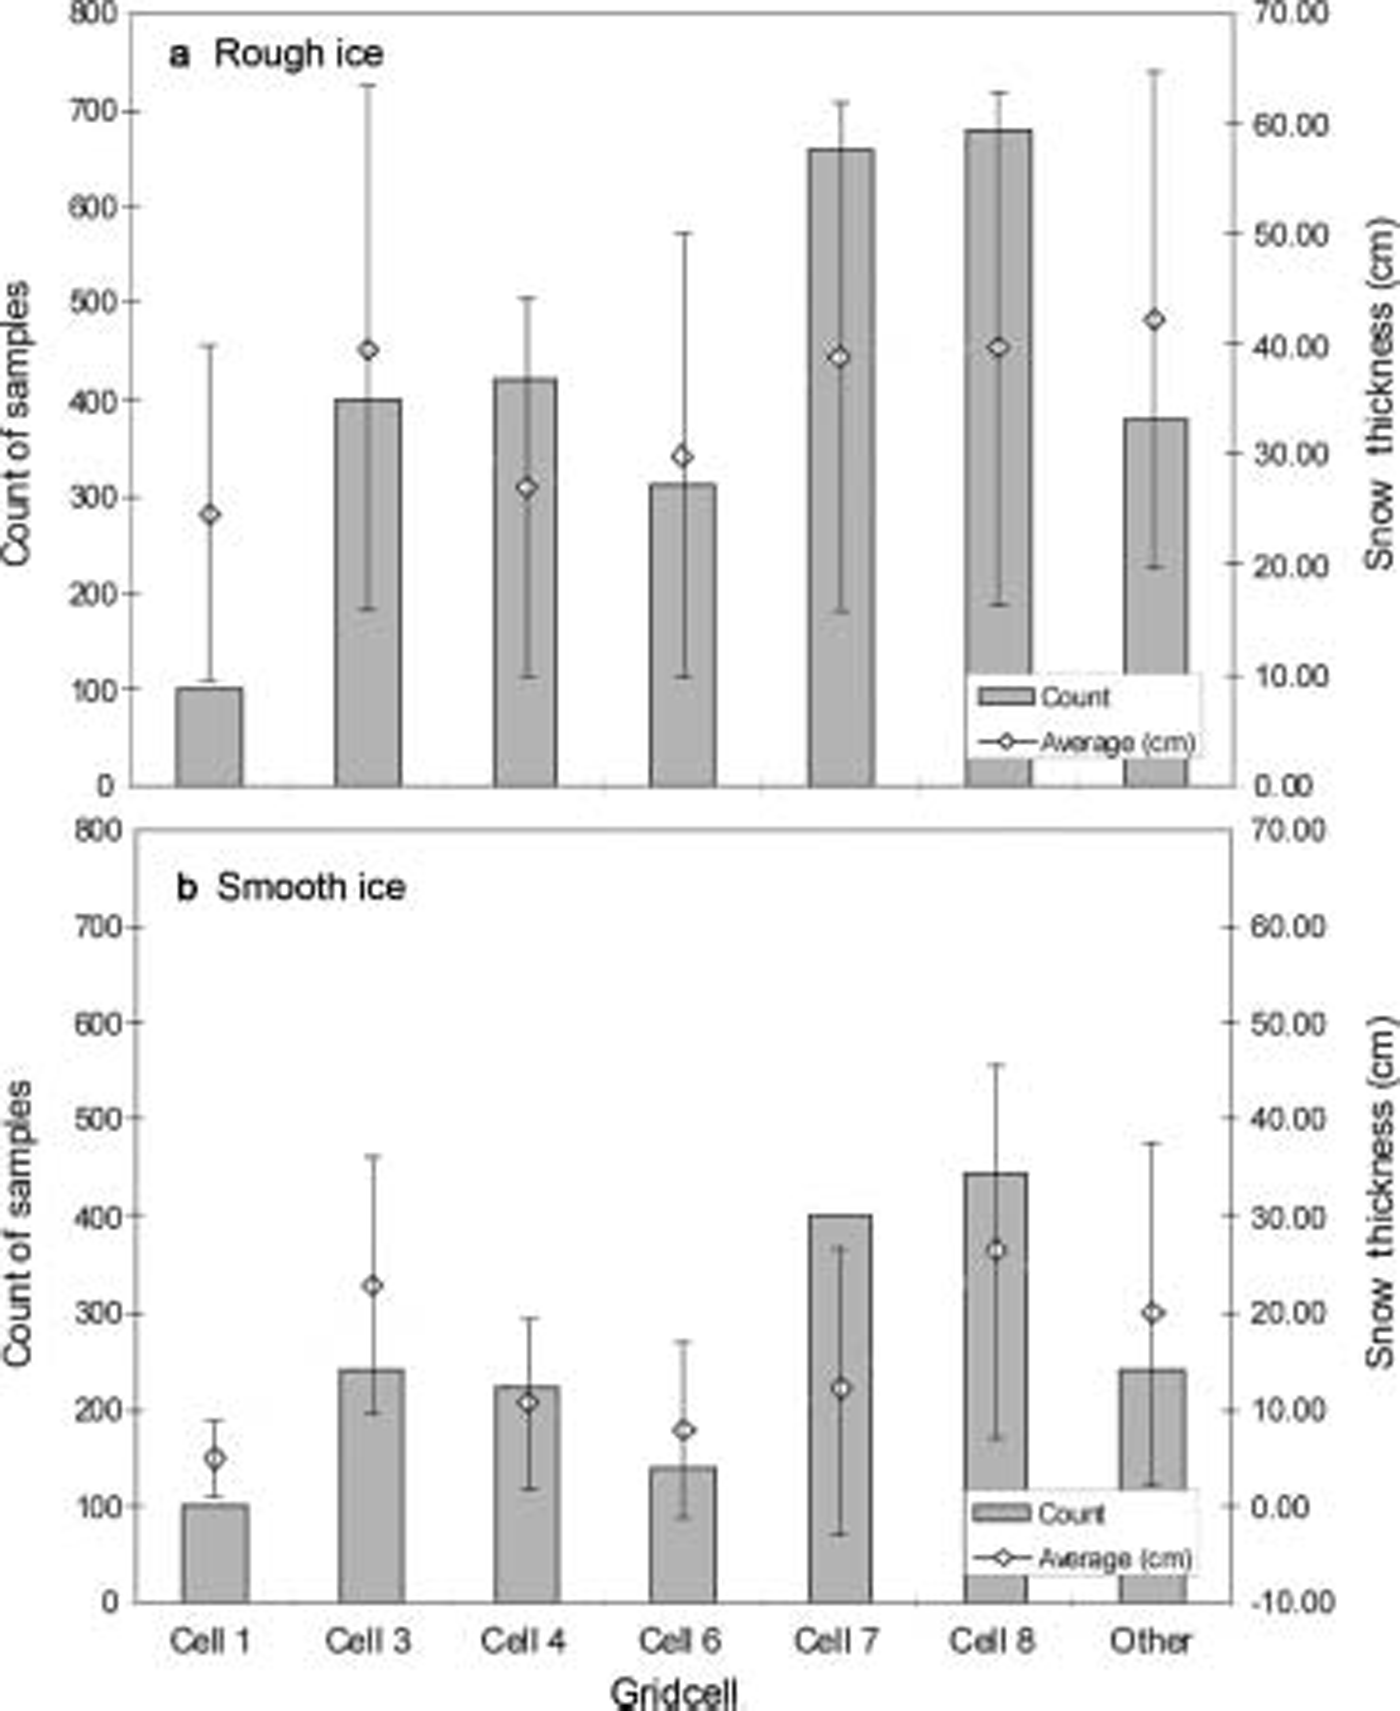
Fig. 2. Plots of average Snow thickness on (a) ‘rough’ floes and (b) ‘smooth’ floes, from data acquired at helicopter mini-stations randomly located within the experimental gridcells.

Fig. 3. Plot of Snow–ice interface temperature vs Snow depth for three mini-station floes.
Table 1. Summary statistics of snow-depth measurements within each experimental gridcell at helicopter mini-stations, and as a function of ‘rough’ and ‘smooth’ ice. ‘Other’ refers to measurements outside the experimental gridboxes
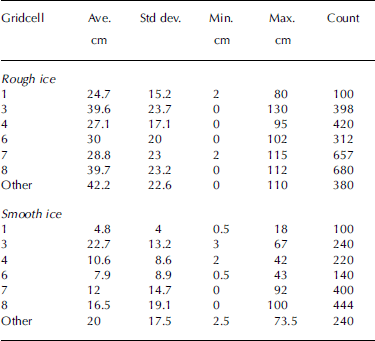
Table 2. Summary Statistics of Snow–ice interface temperature measurements (in ˚C) acquired within each experimental gridcell at helicopter mini-stations. ‘Other’ refers to measurements outside the experimental grid area
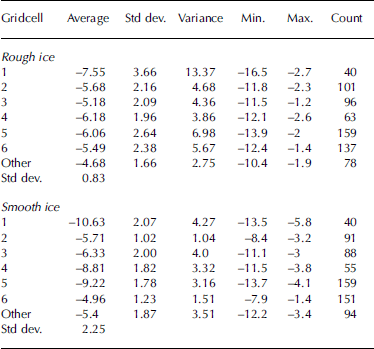
Table 3. Summary of average Snow and ice measurements (to one Standard deviation) from full ice Stations on ARIsE 2003. h s is in Situ Snow thickness, h i is ice thickness. ‘Other’ refers to Stations just outside the experimental grid. Number of measurements is in parentheses. Time is Greenwich Mean Time (Z). Station 6 is a Short Station and the results are not included here
Case Study: 8 October 2003 (flight 4)
sea-ice concentration
Here we compare total Sea-ice concentrations and thin-ice concentrations from analysis of images from an aerial photography transect (flight 4) with near-coincident AMSR-derived ice concentrations along the helicopter flight track. the latter were derived using both the enhanced nasa-team 2 (nt2) algorithm (Reference Markus and CavalieriMarkus and cavalieri, 2000) and the nasa bootstrap basic algorithm (bba; Reference Comiso, Cavalieri and MarkusComiso and others, 2003; j.c. comiso and others, http://eospso.gsfc.nasa.gov/validation/index.php), to investigate their relative performance and differences. an assumption is that ice conditions at points along flight 4 are uniform across the Satellite pixels containing those points. Satellite orbital Swath data rather than daily averages were used in order to minimize the effects of temporal variability. flight 4, from 0030 to 0445 z (greenwich mean time) on 8 october 2003, was chosen because it circumnavigated the entire experimental array marked by the drifting buoys and also took place during cold conditions. the flight track is Shown in figure 4, Superimposed on a near-coincident eos terra modis channel 2 (0.841–0.876 μm) image (250m resolution), acquired at 0110 z on 8 october and normalized for Solar zenith angle.

Fig. 4. A NAsA EOs Terra Modis channel 2 image from 8 October 2003 at 0110 Z (0.25km resolution, polar Stereographic projection) Showing ice conditions at the time of the aerial-photography/radiometer overflight (flight 4), with the helicopter flight path (0030–0445 Z) Superimposed in red. The Sectors in Figures 5, 7 and 8 are marked along the track: A = images 1–65; B = 66–115; C = 116–145; D = 146–175; E = 176–330; and F = 331–445. The approximate location and image numbers of the aerial-photo images in Figure 6 are marked on the flight-line in italics. Helicopter mini-station data on this day were collected within the box marked by the white dashed lines.
Results from the aerial-photo analysis are Shown in figure 5a, with image Sequence numbers along the x axis. the concentration of thin ice and open water in each digital image was determined from greyscale thresholding, and confirmed by their thermal Signature in the coincident airborne thermal ir radiometer record of Surface temperature. the latter differs from the AMSR T I product in that it approximates the Skin Surface only. thin ice is taken here to represent ice types without a Snow cover (e.g. dark and light nilas (to 10cm thick)), with open water having a temperature of approximately –1.8˚c in the airborne radiometer record. aerial-photo-derived estimates of thin-ice distribution are included in the analysis to examine possible biasing effects on ice concentration retrievals, i.e. causing an underestimate, as reported for nimbus-7 Scanning multichannel microwave radiometer (smmr) and dmsp Special Sensor microwave/imager (ssM/I) data by Reference Grenfell and CarseyGrenfell and others (1992), Reference CavalieriCavalieri (1994) and d.j. cavalieri and j.c. comiso (http://eospso.gsfc.nasa.gov/ftp_atbd/review/amsr/atbd-amsr-seaice.pdf). they are also a key factor in the computation of the AMSR-E h s product.
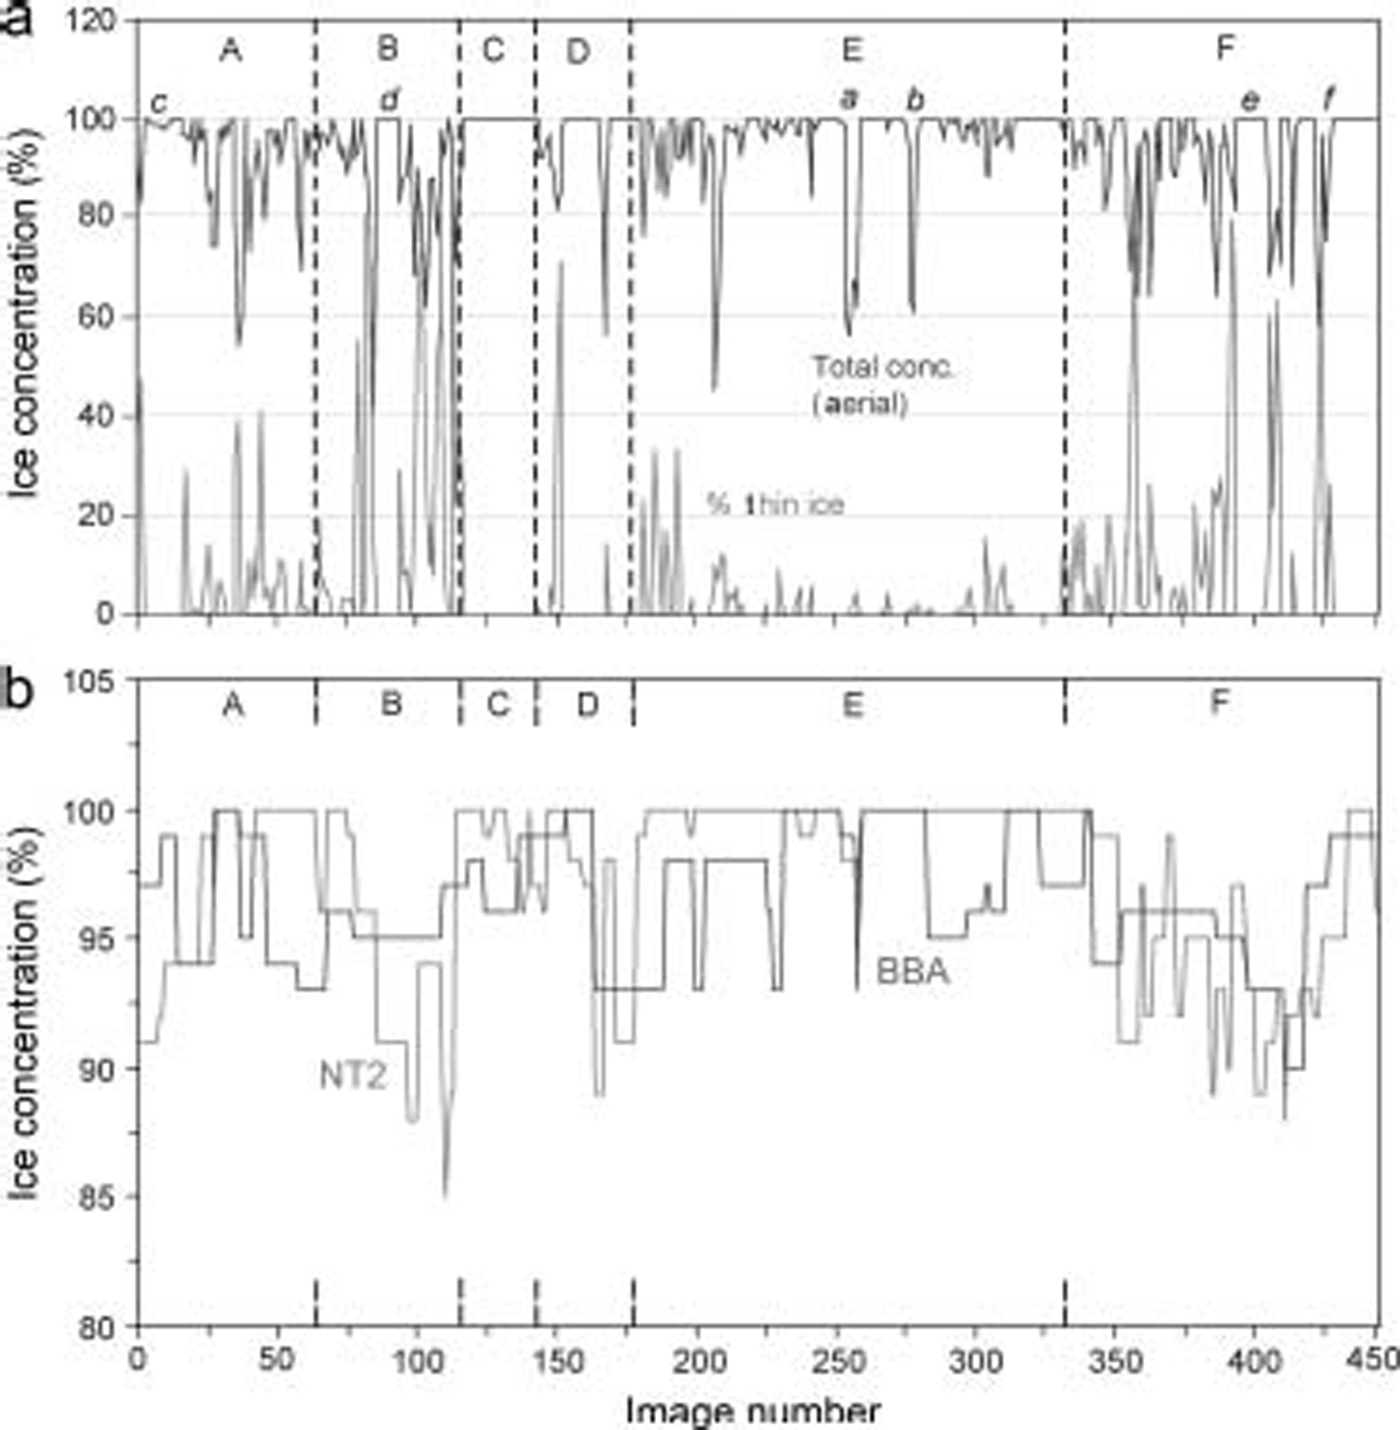
Fig. 5. (a) Plot Showing total ice concentrations retrieved from digital aerial photography, and the percentage of thin Snow-free ice. Sequential image numbers along the flight-line of aerial photo flight 4 (8 October 2003) are Shown on the x axis. See Figure 4 for a map of the flight track. Please See the text for an explanation of a–e. (b) Plot of AMSR ice concentrations retrieved along the flight 4 transect on 8 October using the NT2 and BBA algorithms. Sectors A–F Separated by vertical dashed lines correspond to those in Figures 4, 7 and 8.
Comparison of the modis and aerial-photo imagery Shows that the eastern half of flight 4 traversed an area composed of vast floes Separated by relatively narrow leads, whereas ice in the western Sector was Significantly more diffuse (divergent), with a higher proportion of thin ice in recently opened leads. to aid analysis, the flight transect is divided into Six Sectors comprising different regional ice conditions. these are marked a–f in figures 4 and 5, and are interpreted as follows (based upon the aerial-photo analysis):
A (image Sequence 1–65): vast deformed and thick FY floes with a rough Surface covered by Sastrugi (aligned with the prevailing wind direction), Separated by large leads;
B (66–115): a more diffuse, lower-concentration cover of Smaller, fragmented FY floes (same ice type as a) Separated by large leads;
C (116–145): a vast, largely unbroken FY floe;
D (146–175): two large FY floes Separated by a wide lead, with adjacent grey-white (flatter) ice;
E (176–330): vast FY floes, recently fragmented and Separated by relatively narrow leads; and
F (331–445): a more divergent ice cover, comprising a lower concentration of Smaller FY floes Separated by large leads, i.e. Similar to Sector b. here, the FY floes comprise reconstituted fragments of floes, with rough Surfaces and Sastrugi.
Representative aerial-photo images from Sectors a, b, e and f are Shown in figure 6, with coincident radiometer measurements of Skin Surface temperature Superimposed Showing the thermal contrast between new and thick Snow-covered ice (the locations of these images are marked on the flight track in figure 4). in all Sectors, leads are refreezing and largely covered in Snow-free nilas, although large areas of open water are also present (e.g. a and b in fig. 5a). meteorological conditions recorded at the Ship (marked x in fig. 4) were moderate winds (mean Speed approximately 13ms–1) from the west-northwest with clear Skies and Surface air temperatures approximating –13˚c, i.e. freezing conditions. although the lower part of the image is covered in thin cloud, ice and leads are Still discernible.
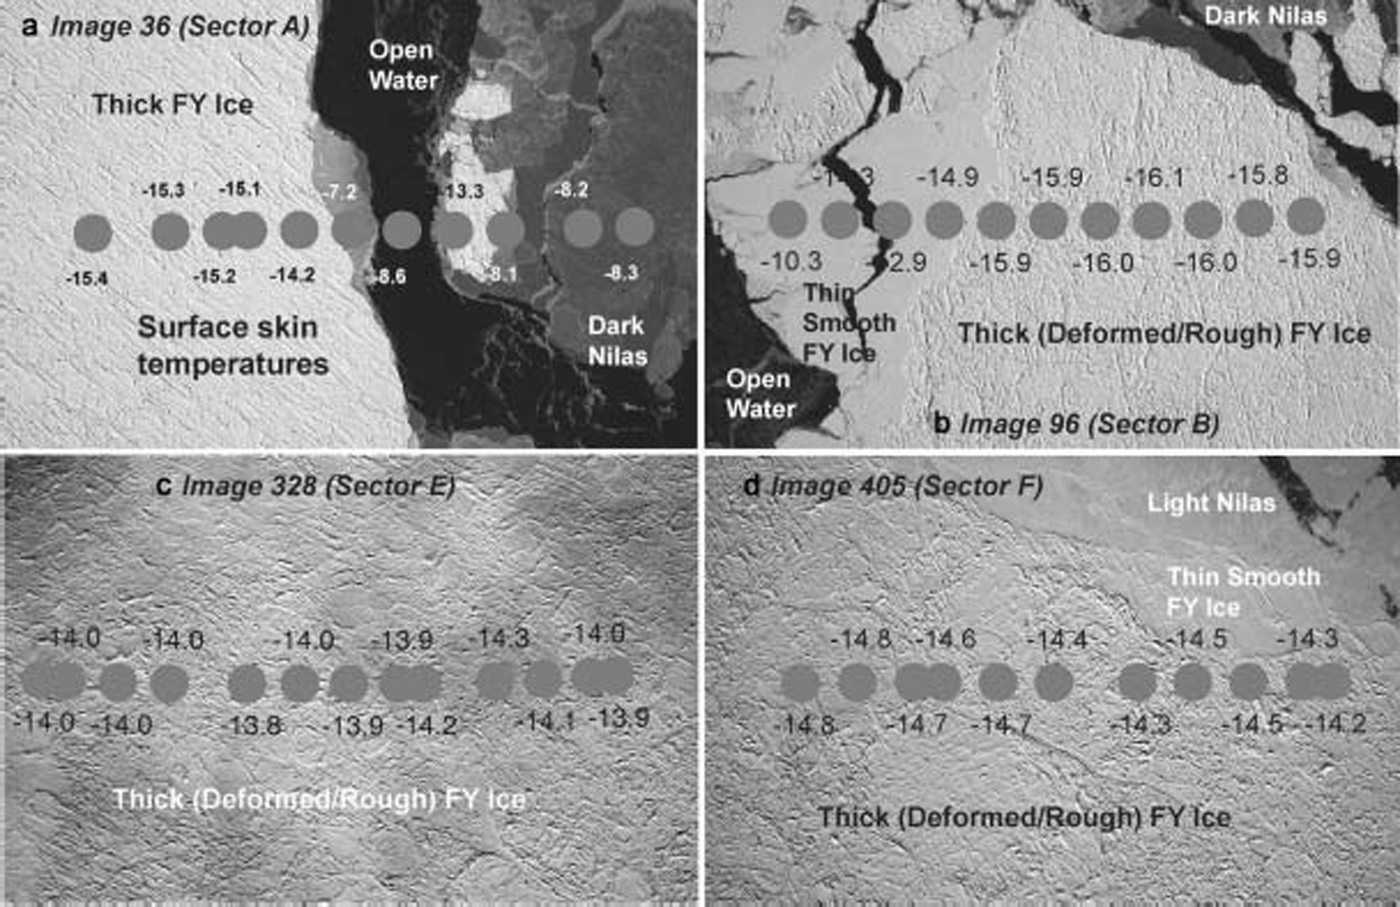
Fig. 6. Example aerial photo images, acquired at an altitude of 5000 ft (1.5 km) on 8 October 2003, from (a) Sector A, (b) Sector B, (c) Sector E and (d) Sector F. The image locations are marked in Figure 4. The round Spots Show the approximate ground coverage of the airborne thermal IR radiometer footprint (approximately 65 m radius), with temperatures marked. The accuracy of the measurements is > ±0.5˚C. Aerial-photo pixel Size is 0.4 m, and the image dimensions are approximately 1200×780 m.
Ice concentration retrievals from the nt2 and bba algorithms for pixels along the Same flight track are plotted in figure 5b. corresponding Summary Statistics for these and the aerial-photo retrievals of total- and thin-ice concentration are given on a Sector-by-sector basis in table 4. for the total flight track (sectors a–f combined), there is reasonable agreement between the Satellite and aerial retrievals of ice concentration. the average is 97.2±3.6% for nt2 and 96.5±2.5% for bba vs 94.3% for the aerial photos, with the lower Standard deviations for the Satellite products reflecting their lower resolution. the average aerial-photo-derived thin-ice concentration is 6.7%.
Table 4. Averages (and one Standard deviation) of AMSR- and aerial-photo-derived total Sea-ice concentration, aerial-photo-derived thin ice concentration, AMSR h s and T I, and helicopter radiometer-derived Surface temperature along the track of aerial-photo flight 4 (8 October 2003), and for each of the Sectors A–F in Figures 4, 5,7 and 8

In all Sectors apart from c (containing a Single vast floe), the AMSR-E concentration tends to be a Slight overestimate relative to the aerial-photo-derived concentration (table 4). this is even the case in regions containing a high proportion of thin ice, i.e. Sectors b and f. overall differences of the Satellite relative to the aerial-photo average concentrations range from –0.3% to +4.4% for the nt2 algorithm and –1.7% to +4.7% for the bba algorithm. comparison of results in table 4 with those in figure 5a Shows that the largest discrepancies again occur in regions of more diffuse/thin ice (e.g. in Sectors a and b), although this is not the case in Sector f. the reason for this is unknown and is currently under investigation.
The AMSR-E concentrations from the two algorithms are Similar on average (table 4). differences occur, however, on a point-by-point basis across the Sectors in figure 5b. the reason for the 5–10% discrepancy in Sector b is unknown, but again may relate to the very high proportion of thin/new ice present, i.e. >60% in places with an average of 19.2% for the entire Sector. in Sector e, the nt2 algorithm produces consistently higher concentrations across a region that contains relatively little thin ice, whereas the bba plot contains more Structure that mirrors the presence of large newly opened leads Such as those marked a and b. both algorithms do a reasonable job in reproducing the relatively complex morphology of the pack in Sector f, which is dominated by the widespread occurrence of refrozen leads (average thin-ice concentration = 9.8±17.4%).
In all cases, differences between Satellite and aerial retrievals of concentration may also reflect the different pixel Sizes involved, i.e. 12.5 km for AMSR-E vs 0.4m for the aerial photography. work is underway to utilize modis imagery validated by aerial photography as an intermediate-resolution validation tool, and to examine possible physical reasons for the apparent discrepancies. the reason for the relatively high aerial and low amsr concentrations at certain points (e.g. marked c, d and e in fig. 5a) is also under investigation.
snow-cover thickness
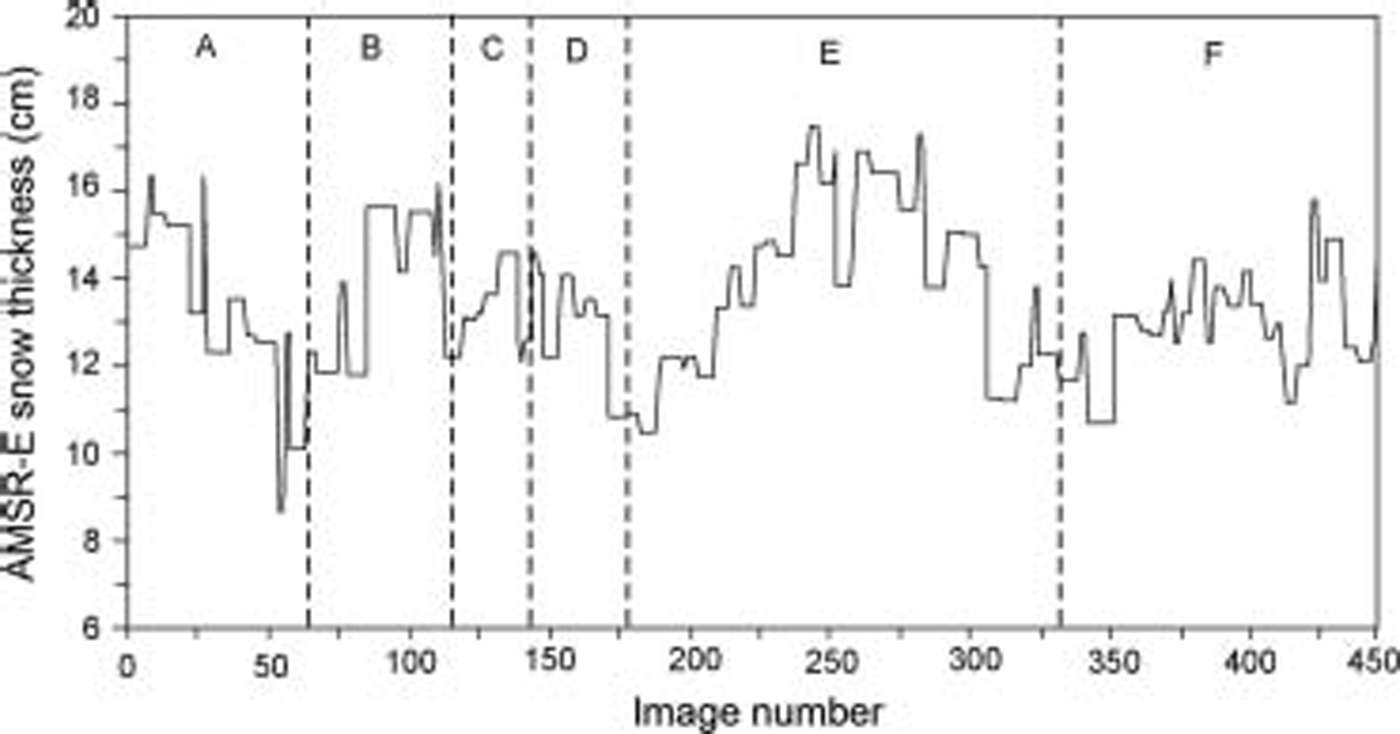
Amsr-derived h s data along the track of flight 4 are plotted in figure 7, again with the Sector boundaries marked for comparison with figures 4 and 5. from analysis of the aerial photos, the thickest h s values occur over large expanses of deformed thick FY ice with a moderately rough Surface and covered in fields of Sastrugi aligned with the prevailing wind. as expected, thinner Snow covers occur in regions containing newly refrozen lead ice (e.g. on the eastern Side of Sector a, and/or flatter areas (or fragments) of grey-white ice (e.g. at the boundary of Sectors d and e)). the increase in h s across Sector e corresponds to an increase in ice Surface roughness and Sastrugi field coverage. this ties in with the mini-station results given in table 1 and figure 2. while the AMSR-derived h s values are Significantly lower than those measured both during full Stations (table 3, with an average of approximately 23.0 cm) and over rough ice during mini-stations (averages of 25.0–42.0 cm), they are comparable to mini-station Smooth-ice measurements (averages of 5.0–23.0 cm).
Although Significant Spatial variability in h s is noted across each Sector (over a range of 9–18 cm), the mean Sector values given in table 4 are remarkably uniform (at 11–12 cm). the overall average is 13.4±1.7 cm. the total mini-station average h s on the Same day (8 october), and in the region within the dashed box in figure 4 (i.e. the eastern half of Sectors a and e), is Substantially higher at 29.7±22.5cm (n = 1422). for rough ice, the average h s is 35±23.6 cm, while that for Smooth ice is 19.4±15.6 cm. the equivalent AMSR-e-derived h s within the dashed box is 15.0±1.6 cm. direct comparison with the Satellite product requires weighting of in Situ measurements to account for the concentration of thin (snow-free) ice (and open water) present, given that the AMSR retrieval includes not only FY but also new thin ice. the latter was not Sampled by the mini- or full Stations, for Safety reasons. thin-ice and open-water information is here obtained from the aerial-photo data Shown in table 4. for the parts of Sectors a and e within the dashed box, the average thin-ice plus open-water concentrations (2.1% and 4.2% respectively) translate to an adjusted average in Situ Snow thickness of 30.3 and 31.0 cm respectively, Still Substantially higher than the AMSR h s value.
Further work is underway to analyze the larger dataset in this fashion, and to exploit the additional information on Snow thickness as a function of ice roughness. this includes detailed Snow information on grain Size, density and Salinity based on data collected from 52 Snow pits ranging from 4.0 to 97.0 cm in depth. Snow density ranged from approximately 180 kgm–3 for new Snow to 735 kgm–3 for damp basal Snow, with basal Salinities as high as 38.0 ppt. on thicker floes, the Snow Stratigraphy was dominated by windpacked, fine-grain Snow overlying coarser-grain and lower-density depth hoar. thinner Snow covers on thinner ice were generally Saline due to the incorporation of frost flowers, resulting in a damp to wet Snow–ice interface. Snow wetness profiles were collected at each Station using a denoth dielectric probe, Showing the Snow cover to be largely dry (above the basal layer). only one ice Station (station 8) had an average freeboard that was negative (table 3); this particular floe had an average ice and Snow thickness of 22±2.0 and 8.2±2.4 cm, respectively. the overall distribution of flooding (e.g. of thin-ice types) during the Study period is unknown.
Ice temperature
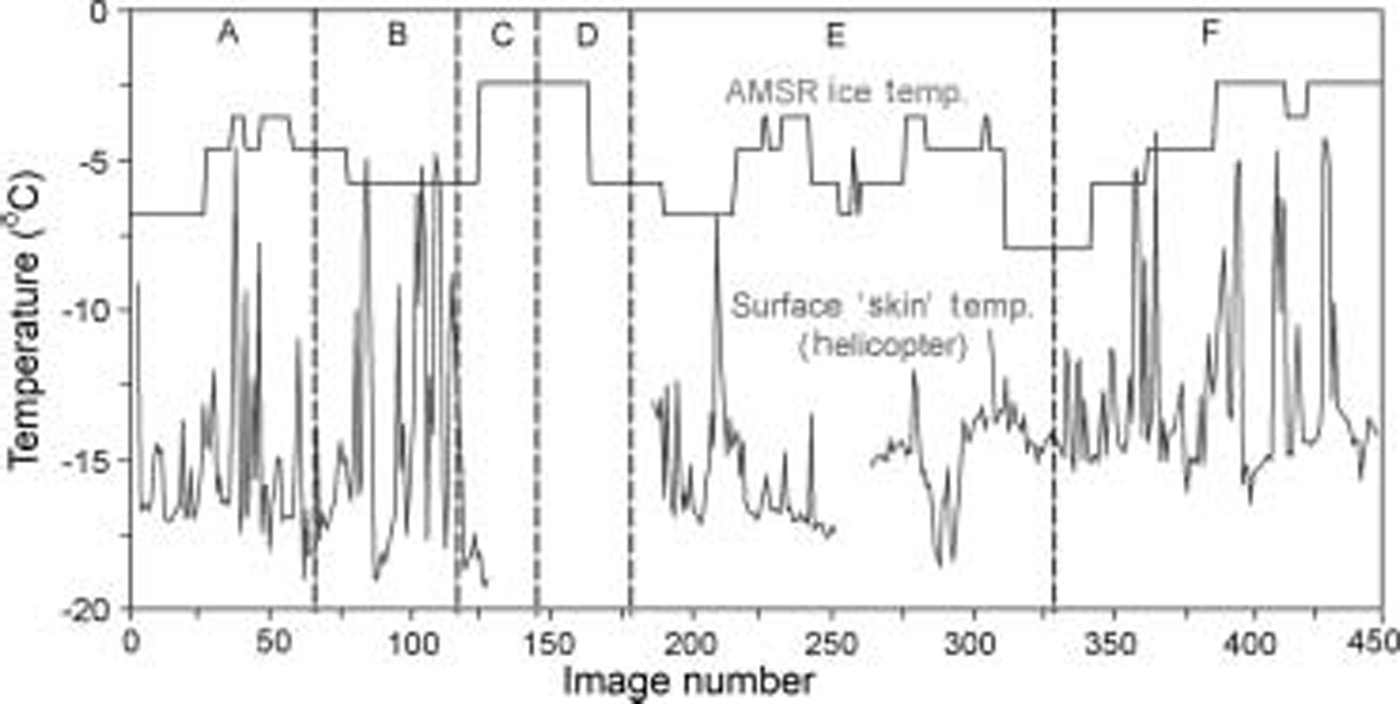
A plot of AMSR-e T I for the flight 4 transect, and equivalent to the ice-concentration and h s plots in figures 5b and 7 respectively, is Shown in figure 8, along with a coincident profile of the helicopter-derived Skin Surface temperature. the Skin Surface temperature is closely correlated with the aerial-photo-derived profile of total- and thin-ice concentrations in figure 5a, as expected. moreover, the T I profile is broadly correlated with the AMSR-e h s profile Shown in figure 7, with low temperatures in Sectors a, e and f occurring under a thinner Snow cover as expected (see fig. 3). average values for both are given in table 4.
The average AMSR-E T I for flight 4 is –5.4±1.5˚c (n = 445). this value becomes –5.9±1.2˚c for the area of Sectors a and e within the box delineating the mini-station locations marked in figure 4. the equivalent mini-station average it measured on the Same day (8 october 2003) is –5.4±1.8˚c (n = 354). although the agreement is to about 0.5˚c, the Standard deviation is likely to be Significantly higher over the wider domain given the Spatial variability of the 6ghz channel emissivity/brightness temperatures for consolidated Sea ice. this is under investigation.
Conclusions and Future Work
Preliminary results are presented from the first experiment dedicated to the validation in east antarctica of the three primary Sea-ice geophysical parameters derived from nasa’s eos aqua AMSR-E. they indicate that, at least under cold conditions with a dry Snow cover, there is a reasonably close agreement between ice concentrations derived from AMSR-E and those estimated from analysis of coincident aerial photography. the performance of the two algorithms is also comparable, although differences of 5–10% are noted in places. for the flight 4 case Study, the average concentration is 97.2±3.6% for nt2 and 96.5±2.5% for bba vs 94.3% for the aerial photos. differences of the Satellite relative to the aerial-photo average concentrations on a Sector-by-sector basis range from –0.3% to +4.4% for the nt2 algorithm and –1.7% to +4.7% for the bba algorithm. atmospheric effects will be examined and quantified using vertical profiles of atmospheric water vapour acquired from 51 radiosonde balloon launches on arise. in general, the AMSR-E concentration is a Slight overestimate relative to the aerial-photo-derived concentration, with the largest discrepancies occurring in regions containing a relatively high proportion of thin ice. for comparison, overall ice-concentration errors of an average of 5–15% have been reported for Smmr and SsM/I data in winter (Reference Comiso and SullivanComiso and Sullivan, 1986; Reference Comiso and SteffenComiso and Steffen, 2001).
More work is required to analyze data from the other aerial photography flights, and to investigate apparent discrepancies in certain regions between aerial- and Satellite-derived estimates of ice concentration. a challenge remains in determining whether these result from differences in the coverage and resolution characteristics of the different datasets being compared, physical effects or a combination of both. the apparent improved performance of the AMSR-E compared to previous passive microwave Sensors (e.g. the Smmr and the current SsM/I) results in part from its higher Spatial resolution. these initial results, based around analysis of one aerial-photo flight and confined to a 3 week period in the early austral Spring, further Suggest that AMSR-E ice-concentration retrievals may be largely unaffected by the presence of extensive areas of thin ice within the Sensor footprint, at least under cold and dry Snow conditions. additional analysis of data from the other flights and associated data acquired during arise is required to test the wider relevance of this finding. given the limited coverage of the experiment, the results may not be valid for the pan-antarctic region for all Seasons.
Initial results are also encouraging for the AMSR-E ice temperature (T I) product. the latter agrees to within approximately 0.5˚c with coincident Surface measurements, based upon the analysis of extensive data collected on 1 day but over a fairly extensive region of about 40×40 km. it Should be Stressed that this is not our estimate of the overall accuracy of the retrieval. rather, further work is essential to validate this product under a wider range of conditions and over a wider Spatial domain. data are being used from a buoy deployed at Station 4 and retrieved Some days later. this was equipped with an automatic weather Station, as well as thermistor Strings to record changes in Snow and ice temperature.
Regarding Snow thickness, the AMSR h s retrieval is a Significant underestimate compared to in Situ measurements weighted by the percentage of thin ice (and open water) present. for the case Study analyzed, the underestimate was 46% for the overall average, but 23% compared to Smooth-ice measurements. the Spatial distribution of the AMSR-E h s product, however, follows an expected and consistent Spatial pattern relative to the underlying ice type. this Suggests that the observed difference may be an offset, at least under cold conditions. clearly, more in-depth analysis of the wider dataset is essential, and is underway. this includes analysis of Snow thickness as a function of ice roughness and of the impact of variable conditions. the experimental timeframe included a Significant Synoptic-scale warming event (recorded by the Ship’s data-logging System), during which time Snow- and ice melt occurred, and work is being undertaken to assess its impact on the accuracies of the AMSR-E product retrievals. work is also underway to address the potentially Significant impact of Snow grain-size variability on the accuracy of the AMSR-E h s product. melt is expected to cause a large variability and uncertainty in Sea-ice (and Snow-cover) emissivity (Reference Comiso and SteffenComiso and Steffen, 2001), and to degrade these product accuracies. data collected during arise will enable validation of other geophysical parameter products derived from Satellite data. in addition to avhrr and modis Skin Surface temperature (Reference scambos, Haran and R. MassomScambos and others, 2006), these include ice motion from AMSR-E and active microwave Satellite data (sar and radar Scatterometer) using velocity and Strain data from the ice beacon array.
Acknowledgements
We gratefully acknowledge the professional Support of captain pearson, the officers and crew of the rsv Aurora Australis, and the helicopter pilots and crew. this work was Supported by the australian government’s cooperative research centres programme through the antarctic climate and ecosystems cooperative research centre (ace crc). it was carried out as part of aas project 2298, and formed part of nasa’s AMSR-E validation program (http://eospso.gsfc.nasa.gov/validation/index.php) through nra-oes-03. thanks are also extended to the expeditioners travelling to casey for their help during ice Stations and in helicopter data collection. the efforts of a. petty in analyzing the aerial photography and a. o’connor in collating the buoy data and producing maps are much appreciated. we also acknowledge the Support provided by the australian bureau of meteorology team (d. allen, S. visentin and j. golding), j. bohlander, j. Smith and m. marquis (all of NsIDC), the japan aerospace exploration agency (jaxa) and b. quinton (aad). the excellent Suggestions of p. langhorne (university of otago, new zealand), c. geiger (crrel, UsA) and an anonymous reviewer are much appreciated.


