


Introduction
Santiago de Chile (33° S), with ~6.7 million inhabitants, is located at the foot of the central Andes, in the Maipo river basin. Glacier inventories compiled for the Maipo basin estimate an approximate ice area coverage of 420 km2, contributing up to 67% of river flow during dry seasons (Reference Peña and NazaralaPeña and Nazarala, 1987; percentage is under dispute at present). Over recent decades, glaciers in central Chile (32─41° S) have shown significant frontal retreat and accelerated areal reduction, presumably as a response to atmospheric warming and a reduction in precipitation (Reference CasassaCasassa, 1995; Reference Rivera, Acuña, Casassa and BownRivera and others, 2002, Reference Rivera, Acuña, Casassa and Knight2006; DGA, 2011). Glacier inventory data from this region yield a negative glacier area variation of 8% for the period 1955─2000. Moreover, predictions show a possible increase in air temperature by a rate of 0.25°C decade¯1 (Reference Falvey and GarreaudFalvey and Garreaud, 2009), hence further glacier changes are expected to occur in response.
Early observations by Reference LliboutryLliboutry (1956) gave rise to the notion that glaciers in the central Chilean Andes were mainly cold and highly dependent on climatic fluctuations. More recently, glacier monitoring programmes, initiated to estimate mass-/energy-balance components (DGA, 2012; CECs, 2013), have suggested that some glaciers in central Chile may, in fact, be characterized as polythermal, containing perennial temperate and cold ice structures (Reference Blatter and HutterBlatter and Hutter, 1991). To date, there has been no attempt to clearly identify or quantify the distribution of cold and warm ice structures for any glacier in central Chile.
The complexity of polythermal glacier structures has been increasingly recognized through the use of geophysical techniques (Reference Irvine-Fynn, Hodson, Moorman, Vatne and HubbardIrvine-Fynn and others, 2011). Widely used for measuring ice thickness and mapping glacial bedrock and stratigraphy (Reference Plewes and HubbardPlewes and Hubbard, 2001; Reference Dowdeswell and EvansDowdeswell and Evans, 2004; Reference Bingham and SiegertBingham and Siegert, 2007), ground-penetrating radar (GPR) systems have been deployed to survey the thermal properties of ice masses. Air, ice, water and other heterogeneities (e.g. rock, volcanic dust) all have contrasting dielectric permittivities that yield distinct responses in radar returns (Reference Annan, Waller, Strangway, Rossiter, Redman and WattsAnnan and others, 1975). Hence, to a first order, it is possible to distinguish between cold ice (below ─5°C), which is relatively transparent for radar propagation, and warm ice, whose water inclusions scatter radar signals. As a result, reflections can be analysed to distinguish englacial ice conditions and to identify water-/air-filled cavities or channels by observing the intensity of the return (Reference Jacobel and RaymondJacobel and Raymond, 1984; Reference Moorman and MichelMoorman and Michel, 2000; Reference MacGregor, Matsuoka, Waddington, Winebrenner and PattynMacGregor and others, 2012).
Over the last two decades, analyses of bed reflection power (BRP) have been conducted for several major ice sheets, especially in Greenland and Antarctica, with the aim of determining subglacial conditions and assessing their potential impacts on ice dynamics (Reference Bentley, Lord and LiuBentley and others, 1998; Reference Gades, Raymond, Conway and JacobelGades and others, 2000; Reference Oswald and GogineniOswald and Gogineni, 2008; Reference Jacobel, Welch, Osterhouse, Pettersson and MacGregorJacobel and Welch, 2009; Reference Ashmore, Bingham and JoughinAshmore and others, 2014). This technique is mostly applicable where the ice─ bed boundary is relatively flat, a characteristic which reduces the complex scattering of radar returns by the bed topography. Besides analysing major ice sheets, radar BRP has also been successfully applied to a number of valley glaciers (Reference Copland and SharpCopland and Sharp, 2001; Reference PattynPattyn and others, 2003, Reference Pattyn, Delcourt, Samyn, De Smedt and Nolan2009; Reference Matsuoka, Thorsteinsson and WaddingtonMatsuoka and others, 2007; Reference Wilson, Flowers and MingoWilson and others, 2013). In all cases, the biggest issue to be overcome in attaining accurate values of BRP is to account correctly for englacial attenuation of the radar signal. Englacially, attenuation can be estimated through the implementation of empirical- and modelling-based approaches. In the former, attenuation coefficients are derived empirically from travel-time versus reflection intensity relationships. In the latter, englacial temperature modelling is used, calibrated by englacial borehole temperature measurements (whenever possible) (Reference Wilson, Flowers and MingoWilson and others, 2013).
Here we present the results of signal analyses of 50 MHz GPR data acquired from a helicopter-borne system across the highly elevated Glaciar Olivares Alfa, central Chilean Andes. The aim of these analyses is to identify the supraglacial, englacial and subglacial characteristics of this glacier through in situ observations and theoretical approaches. Consequently, we were able to use the data to delineate the boundary between warm and cold ice and determine the drainage networks. Considering the potential attenuation, given the two-layered thermal regimes of the ice, we obtained the distribution of the reflective patterns, featuring the potential occurrence of water streams, dams and pools.
Site location
Within the main Maipo basin, the largest glaciers are located in the upper Olivares sub-basin, which experienced a 25% reduction in ice area between 1955 and 2000 (Reference MarangunicMarangunic, 1979; Reference ValdiviaValdivia, 1984; DGA, 2011). Located at an elevation ranging from 4240 to 4830 m a.s.l., Glaciar Olivares Alfa (33°11′ S, 70°13′ W) has an approximate area of 3.91 km2 and flows from south to north. Figure 1 shows the position of ten mass balance stakes, installed as part of an ongoing monitoring programme, and whose movements provide the ice-velocity validation data used in this study. Field-based observations of the mass-balance stake network made between December 2012 and January 2014 reveal an overall negative trend (─162.5 cm w.e. d–1). During the observation period, a maximum ablation rate of 2.41 cm w.e. d–1 was measured at stake 3 between December 2013 and January 2014, while the maximum accumulation rate of 0.72 cm w.e. d–1 was measured at stake 1 between May and June 2013. Ice surface velocity at Olivares Alfa throughout the observation period was shown to be particularly low (average of 2.75 m a–1) (CECs, 2013). Figure 1 also shows the radar tracks acquired in May 2013.

Fig. 1. Location map of Glaciar Olivares Alfa. The red lines depict transects of the radar data used in the analyses. Black points show the position of installed mass-balance control stakes (numbered 1–10).
Surface topography data
In December 2012, a high-precision lidar system, CAMS (CECs Airborne Mapping System), was used on board a helicopter to acquire data for Olivares Alfa and other surrounding glaciers in the upper Olivares sub-basin. The airborne system included a RIEGL laser scannner (LMSQ240-60) combined with a dual-frequency GPS (Javad Lexon GD) and an inertial measurement unit (IMAR iNAVFMS), providing surface elevation data with an estimated vertical accuracy of ±0.3 m maximum.
The resulting lidar point cloud measurements were calibrated with known surface control points. Subsequently, the filtered cloud points (with a density 1.07 points m–2) were converted into a digital elevation model (DEM) using an interpolation method (triangulated irregular network, TIN), yielding a cell size resolution of 2 m.′ ‘Flow accumulation patterns’ were detected from the DEM to simulate the hydraulic drainage network (using the tools available in ArcGIS 9.3).
Radar data acquisition
Radar data were acquired for this study using a helicopter-borne system, consisting of a hanging dual bow-tie dipole antenna, designed and modelled to operate at a central frequency of 50 MHz. The system consists of a high-voltage (2.4 kV) impulse transmitter generator, a signal receiver, a geodetic GPS for precise georeferencing of data and a laser altimeter for altitude control of the antenna above the ice. The radar signal is captured by a 14-bit analogue-to-digital converter, at a sampling frequency of 400 MHz. During the survey, the maximum pulse repetition frequency (PRF) of the transmitter was used (4 kHz) together with the minimum allowable stacking (256 traces). This system configuration related to the power consumption and the internal power dissipation of the transmitter, as well as to the data transfer capacity. The configuration used was considered optimum for this radar system as it produced the maximum trace rate (15.6 traces s–1) with a high PRF, suitable for high-speed helicopter surveys (20 m s–1).
Data were acquired at the beginning of the 2013 (austral) winter season, prior to any major precipitation events. The total flight track, which was ~33.17 km in length and consisted of 22 111 data points, so-called traces, incorporated multiple longitudinal and transverse profiles across an ice surface that was mostly smooth with moderate slopes on the margins. Taking into account only point measurements that reached the ice bottom, the antenna height was, on average, 51 m (standard deviation of 32 m) above the ice surface. The distance between traces ranged from 1.5 to 2 m according to the helicopter speed. Figure 1 shows the GPR data points (in red) for which bedrock was detected and that were subsequently used in this study (16 467 traces). Gaps in the red line denote the lack of bedrock detection below the ice.
Radar data analyses
Prior to analysis, the radar data were (1) horizontally rearranged using the geodetic GPS information collected during flight; (2) corrected vertically to zero time (by determining the direct wave from transmitter to receiver); and (3) cut to 2402 ns (two-way travel time), ensuring that the maximum ice depth was detected within this range. A vertical time increment of 2.5 ns was used during data collection, which resulted in a radargram of 961 points of vertical representation.
Glacier surface and bedrock layers were identified within the resulting radargram using a semi-automatic procedure. During this procedure the user picked two points from a continuous reflector (indicative of a visible layer in the radargram), made a linear interpolation between the selected points and then corrected the result to the position of the nearest maximum reflector point in the trace. Due to the complex subglacial topography detected and the multiple-echoes received, the picked layers were often further edited to avoid potential error.
In addition to the glacier surface and bedrock layers, sections of scattering were identified along the radar profile that depict englacial transitions in the ice structure. These transitions were assumed to define the boundary between cold and temperate ice. When distinguishing these transitions, scattering produced by surface features was excluded. The power of each picked horizon was computed individually using Eqn (1) for the different sections of interest.

where sn is the amplitude (V) of the signal, and n 1 and n 2 are the starting and ending sample numbers of the calculation window.
Surface, bedrock and internal reflection power (SRP, BRP and IRP)
Considering only the geometrical spreading loss, which is a function of radar wave travel path length, SRP is a measure of the reflected power from the ice surface (mainly a function of the antenna height). SRP was computed for at least one pulse period length (of each trace) with respect to the picked sample sn . The moving window limits used were 8 samples above and 15 samples below sn and represented 60 ns (~5 m).
The layer identified as bedrock in the radargram was used to compute the power reflection produced at the bottom of the ice (BRP). As was done for SRP, a same-size moving window was used with respect to the sample picked that had the highest amplitude reflected. Lastly, the englacial transitions between cold and temperate ice were also delineated in the radargrams. The reflected power through the temperate ice thickness (IRP) was calculated for the section of each trace that presented a scattered signal return (associated with attenuation due to changes in the ice conditions). The moving window length varied according to the thickness of the scattered region and neglected reflections that might be coming from the surface (SRP) or directly from the bedrock (BRP).
Ice-thickness variation correction
The radar signal amplitude is reduced by the path length mainly due to geometrical spreading and signal absorption within the ice. The relationship between measured BRP (Eqn (1)) and BRP corrected for ice absorption (BRPest) is given by
BRPR is the residual BRP, the variations of which are not related to changes in the amount of energy transmitted into the ice (Reference GadesGades, 1998). In order to obtain BRPest, some authors have used empirical methods, where the measured BRP values from a given area are plotted against ice thickness and a best-fit curve is used as a representative model (usually an exponential fit) (Reference GadesGades, 1998; Reference Gades, Raymond, Conway and JacobelGades and others, 2000; Reference Copland and SharpCopland and Sharp, 2001; Reference Pattyn, Delcourt, Samyn, De Smedt and NolanPattyn and others, 2009). In contrast, other authors have estimated BRPest theoretically by using the radar equation for which parameters are known (Reference Bentley, Lord and LiuBentley and others, 1998; Reference Peters, Blankenship and MorsePeters and others, 2005). The empirical approach assumes that BRP is largely a factor of geometrical spreading, an assumption which breaks down in complex settings, such as valley glaciers characterized by heterogeneous media. Indeed, for this study, while a good exponential fit was found between energy reflected from the surface and the antenna-to-ice-surface distance (R 2 = 0.8), the relationship between energy reflected from the bedrock and ice thickness is weak (R 2 = 0.26), implying that attenuation is influenced by factors additional to the path length, such as englacial scattering and variations of temperature within the ice (Reference MatsuokaMatsuoka, 2011). Unfortunately, although this method has been applied to other non-cold glaciers, it did not lead to usable results in this study.
In this study, BRPest was estimated considering three media of propagation for the radar equation: air, ice and bedrock. The power received was then a function of the peak transmitted power, system gains and losses associated with the radar equipment and media conditions (ice and bedrock). A general expression for the received power P r is
where P t x is the transmitted power, G is the system gain and L g is the geometrical spreading losses resulting from the height of the antenna (h a) and ice thickness (h i). The twoway travel time measured was converted to ice thickness using a constant wave speed of 0.168 m ns–1 (Reference Glen and ParenGlen and Paren, 1975). Additionally, T ai is the transmission coefficient at the first interface (air/ice), which is determined by its reflection coefficient R ai (T ai = 1 R ai), R ib is the reflection coefficient of the ice/bedrock interface and L i is the dielectric loss in ice (Reference Peters, Blankenship and MorsePeters and others, 2005).
L g is a function of the wavelength λ in air and " i is the relative dielectric permittivity of the ice:
Experimental studies have shown that L i decreases sharply when temperatures are just below the melting point. This relationship with temperature depends on the wavelength λi in the ice and the loss tangent tan (ρ), which relates to the dielectric losses within ice due to absorption of the electromagnetic radar waves and their dissipation as heat (Reference EvansEvans, 1965; Reference MatzlerMatzler, 1987).
To obtain the antenna-height variation for SRP (SRPest), the general expression (Eqn (3)) was simplified for airwave travel:
The following expression was then deduced to estimate BRP:
The measured and estimated power anomalies were interpreted using Eqn (2). This represents the residual BRP (−1 < BRPR < max(BRP)– −1) which indicates the remaining BRP after applying the correction for losses and is proportional to the reflectivity of the base.
In order to understand the BRPR values calculated, and assuming acquisition-system parameters remained constant throughout the survey, two main influencing factors are considered: (1) englacial conditions and (2) basal conditions. With respect to the first factor, the presence of warm ice and/or englacial water is assumed to depress BRPR because water inclusions scatter radar signals and thus enhance attenuation. For the second factor, the influence is assumed to be the opposite, with the presence of water enhancing BRPR due to its greater reflectance of the signal.
Results
Radar-detected ice thickness for Glaciar Olivares Alfa reached a maximum of ~130 m, with a mean of 56 m. Aside from those acquired from the western branches of the glacier, the radargrams show a clear transition from highly transparent ice to ice that significantly scatters the radar signal. This transition is taken to indicate the englacial thermal boundary between cold ice and underlying temperate ice, existing at the pressure-melting point. The identification of these boundaries became more laborious at the margins and near the surface of the glacier. In such areas the seasonal supraglacial channels eventually also develop into englacial conduits that reach the underlying temperate region and the glacier bedrock. The supraglacial channels result in highly noisy sections in the radargrams. In addition, when the distance between the antenna and the surface was <50 m, multiples of the radar direct wave masked the surface reflection, hindering the detection of features from the near subsurface (′fake reflector’ in Fig. 2).

Fig. 2. Example of the interpretation of englacial and subglacial features from radargrams.
Figure 3a and b show longitudinal (L1–L2) and transverse (T1–T2) radargrams relative to ice-flow direction, respectively, together with the corresponding SRP, IRP and BRP results and the reflection coefficient measured from the ice– bedrock interface R ib. Figure 4a shows the resulting total ice thickness map using a natural neighbour interpolation and a two-dimensional average filter for smoothing the raster surface. Ice thickness was spatially interpolated to a raster cell size of 20 m assuming a minimum depth of 5 m at the margins.

Fig. 3. (a) Radargram longitudinal to the ice flow taken from north (ablation zone) to south (accumulation zone) (L1–L2). (b) Transversal profile taken from west to east (T1–T2). Plots from the top show the profile without interpretation. Subsequently, the black horizontal line shows the surface, the red line shows the bedrock and the yellow line follows the englacial transition of the ice. The black vertical lines indicate the crossing point between these two profiles. A gain curve compensation was applied to the radargram for better visualization. Lower plots show (from top to bottom) the measured power from surface (SRP) and englacial features (IRP and BRP), and the reflection coefficient from the bedrock Ri b.

Fig. 4. Spatial distribution of ice thickness (cell size 20 m). (a) Total ice thickness from surface to bedrock; T1–T2 and L1–L2 indicate respectively the transversal and longitudinal sections shown in Figure 3. (b) Spatial distribution of the reflective layer thickness interpreted as temperate basal ice (dashed line in (a)).
The regions of scattered radar returns, visible in Figures 2 and 3, indicative of temperate ice, reach a maximum thickness of ~70 m above the bedrock, with a mean of 24 m. Using the same process applied to interpolate the total ice thickness (Fig. 4a), the spatial distribution of the temperate ice thickness across the glacier was also interpolated (Fig. 4b). The temperate ice thickness was found to be highly variable, becoming thinner above the equilibrium line (4600 m a.s.l.). In relation to the total ice thickness, the temperate ice bulk represents, on average, 40%.
As described earlier, the magnitude of the basal reflection is a function of both the physical condition of the bed (i.e. wet versus dry) and the englacial conditions, the latter being ruled by the temperature of the ice through which the radar signal has passed (i.e. predominantly warm, cold or mixed). Therefore, we estimated the reflection power assuming losses for the temperate ice (near the melting point) and the cold ice at –5°C (Reference MacGregor, Winebrenner, Conway, Matsuoka, Mayewski and ClowMacGregor and others, 2007; Reference Conway, Smith, Vaswani, Matsuoka, Rignot and ClausConway and others, 2009). The radar equation (Eqn (7)) was then evaluated for the dielectric attenuation (L i) at −1°C (tanδ = 0.006) and at –5°C (tanδ = 0.0038) (Reference EvansEvans, 1965). In terms of reflection anomalies, there are two instances when BRPR is expected to be around or below 0: (1) Eqn (2) has correctly accounted for englacial attenuation of the signal, or (2) there is low reflectivity from the base. Here BRPR was <0 for 83.7% of the detected data points, with smaller values being predominantly situated outside of the englacial layer of the identified temperate ice (Fig. 4b). The spatial distribution of high positive BRPR values corresponds well with the identified temperate ice layer, suggesting the presence of a substantial amount of water at the base of the glacier. Positive BRPR values are particularly prominent for temperate ice regions located close to the glacier terminus, where englacial and subglacial drainage networks are likely to be more developed (Fig. 5b).
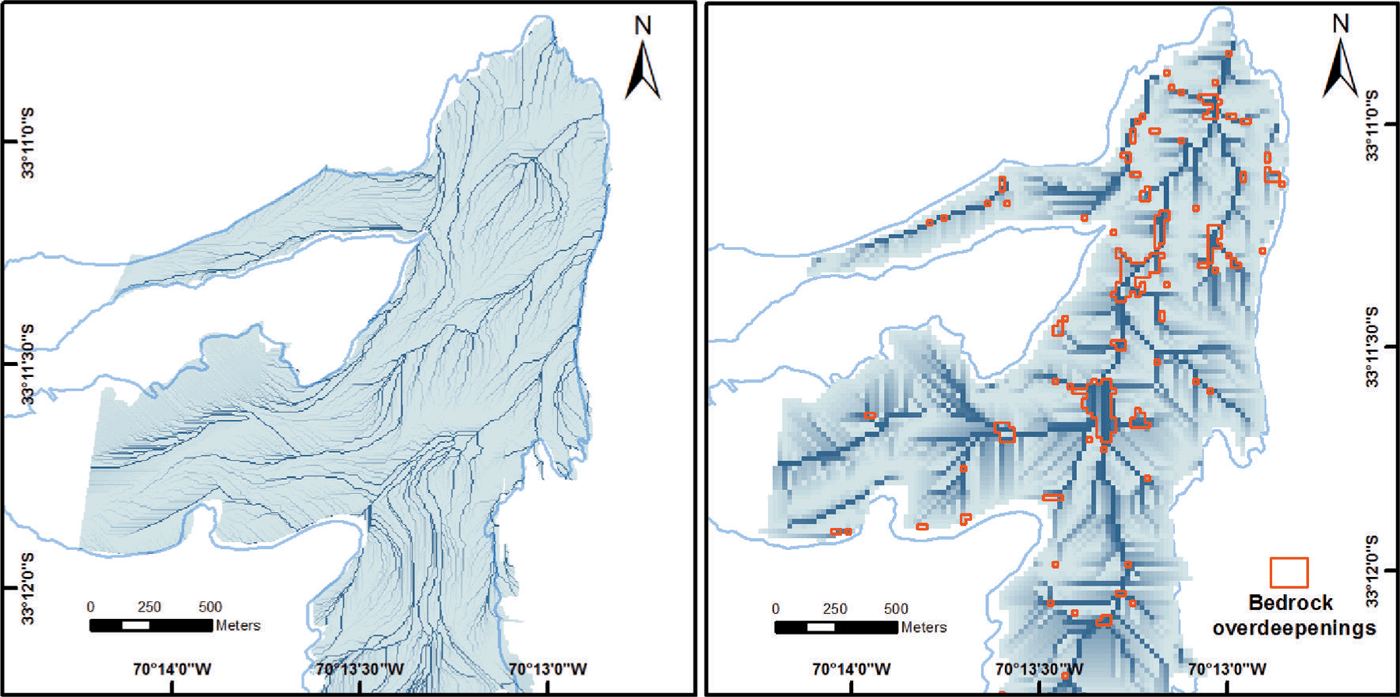
Fig. 5. Drainage network models. (a) Surface drainage derived from 2 m cell DEM (December 2012). (b) Basal drainage network system derived from the bedrock map interpolation (20 m cell size). Red delineations show overdeepenings of the terrain.
In order to correlate the presence of water with anomalies detected in the power reflection, the reflectivity of the glacier bed (R ib) was analysed (Reference Bogorodsky, Bentley and GudmandsenBogorodsky and others, 1985; Reference Gades, Raymond, Conway and JacobelGades and others, 2000; Reference Oswald and GogineniOswald and Gogineni, 2012). Overall, 88% of the data points measured were characterized by very low reflectivity (R ib < 0:056), indicating a low dielectric permittivity contrast between the ice and the underlying bed material. Assuming that ε i= 3:17, the base is therefore likely to be dry/frozen and/or composed of rocks with a relative dielectric permittivity ε b < 4 (Fig. 6). From the remaining 12% of data points representing high reflectivity, the majority have ε b ranging from 4 to 10, indicating that the ice lies on top of moderately saturated material (possibly wet sediments). Finally, a small number of points suggest the presence of highly saturated materials εb > 30 or water (ε b ≈ 82), implying the occurrence of small ponds (up to 3 m in width) surrounded by saturated sediments.
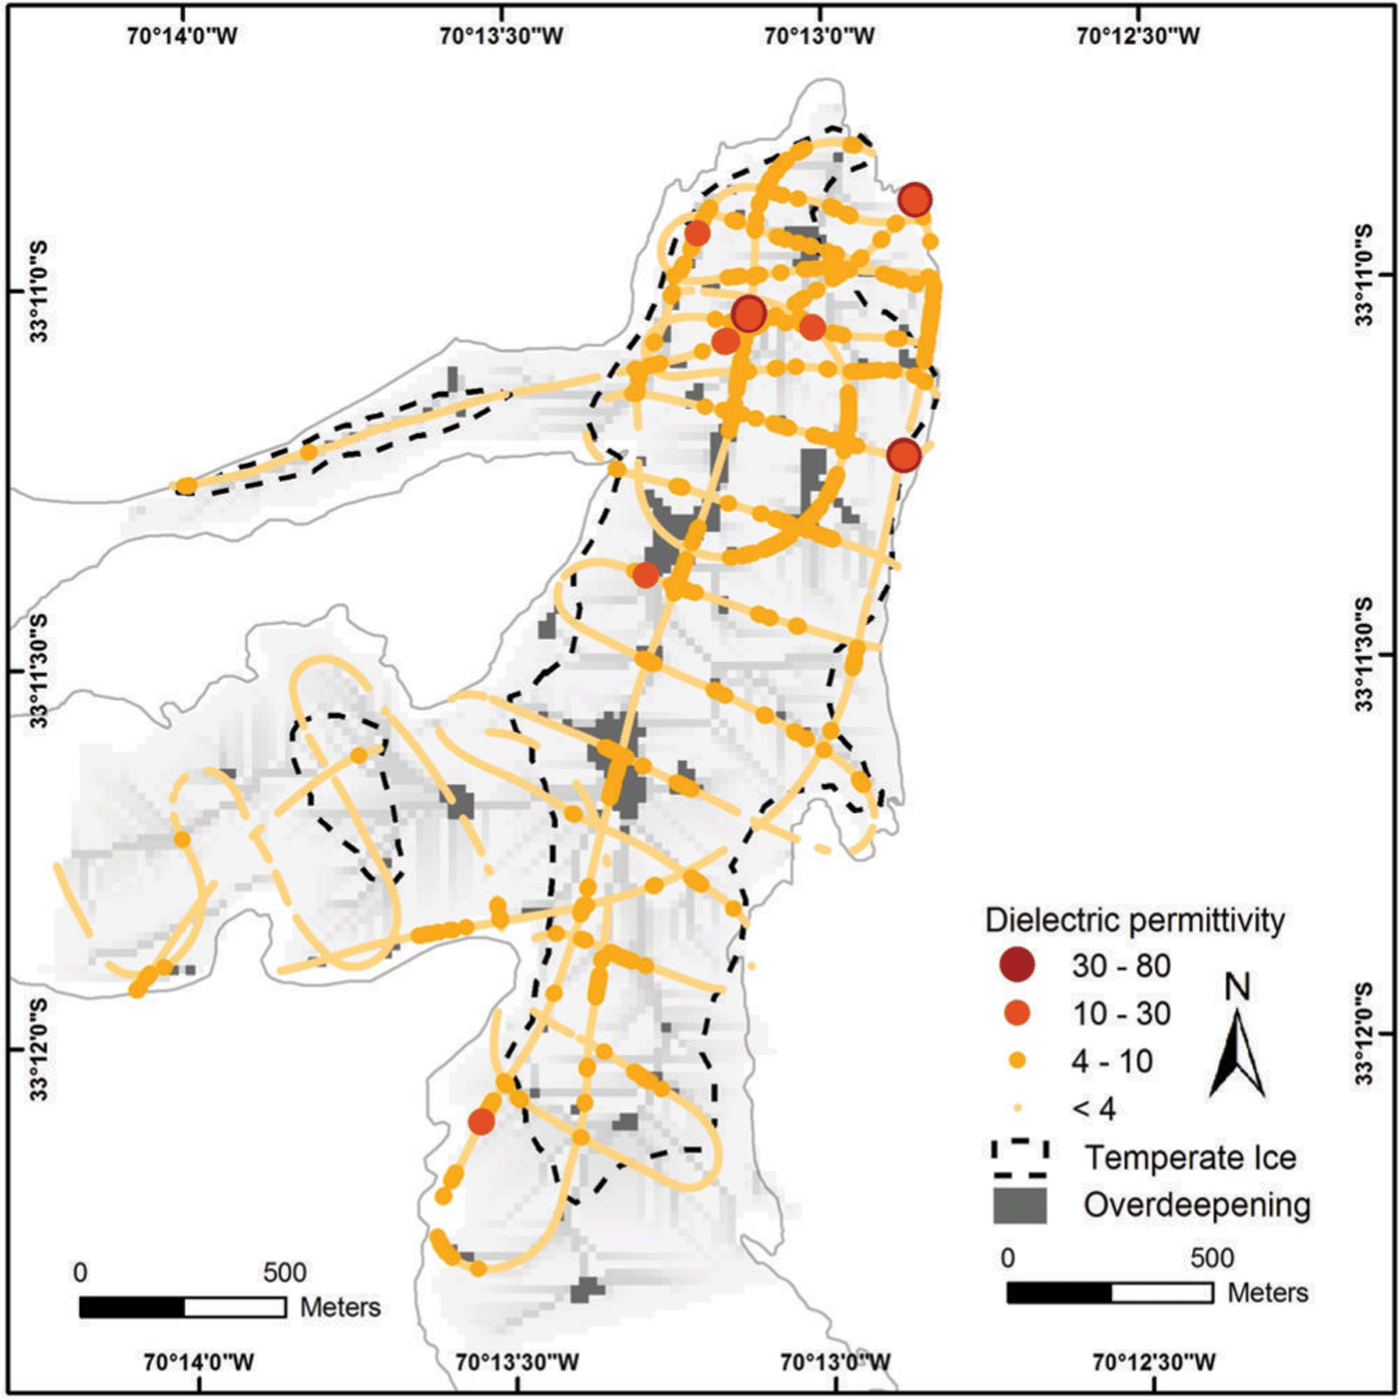
Fig. 6. Patterns of positive BRPR and spatial distribution of the dielectric permittivity values at the base. Values are scaled for a distinctive representation of a frozen base (yellow) and saturated materials (blue). Background image shows the basal drainage network modelled from Figure 5b. Dashed line delineates the layer in Figure 4b.
Discussion
Data acquired using a 50 MHz airborne radar system allowed for the identification of distinct temperate and cold ice layers within Glaciar Olivares Alfa. The presence of these layers confirms earlier notions of this glacier being polythermal; however, there was no quantification of the temperate ice. Following the classification of the thermal regimes of polythermal glaciers carried out by Reference Irvine-Fynn, Hodson, Moorman, Vatne and HubbardIrvine-Fynn and others (2011), Olivares Alfa is shown to correspond to the glacier type for which temperate ice is distributed as a function of ice thickness and/or geothermal heat flux (resembling glaciers located in the High Arctic).
Although the transition from cold ice to ice at the pressure-melting point is considered to be gradual (Reference Moorman and MichelMoorman and Michel, 2000), in the radargrams the delineation of the transition between non-scattered signal zones (cold ice) and scattered signal zones (temperate ice) gives a reasonable method for identifying their spatial distribution. Due to the strong dependency of the dielectric attenuation on ice temperature along the propagation path (Reference MatsuokaMatsuoka and others, 2010), this two-layered thermal regime was considered for estimating the power reflected from the bedrock (BRP). In order to interpret BRP, it is necessary to observe the processes of the signal through the media above. The energy reflected from the surface quantifies the signal attenuation purely related to the geometrical spreading. The qualitative analyses of the reflected power from internal features help us to understand the reflection patterns generated by the effect of englacial heterogeneity on the propagated energy above the bedrock. In this regard, from Figure 3 it can be seen that IRP increases substantially at the margins of the glacier (shallower ice) where the ice contains multiple englacial events originated by surface roughness (Fig. 5a). Therefore, BRP measurements and further inferences of basal conditions at these locations may be less reliable due to potential underestimation of the attenuation.
The relationship between directly measured power and estimated power was used as an indicator of unexpected reflectors, interpreted as saturated material at the glacier base or as liquid water. Highly reflective patterns, suggesting the latter, were mostly found for areas underlain by the temperate ice and it is likely that the water source for these is mostly supraglacial. Measurements were made at the end of the melt season when runoff had stopped (average air temperature –10 ± 3.03°C) and refreezing had likely begun. Therefore, the highly reflective radar patterns detected may be the result of the presence of late-season meltwater which, having made its way to the glacier bed, has become trapped behind a thermal dam (Reference Skidmore and SharpSkidmore and Sharp, 1999) and/or in overdeepenings.
Early research suggests that ‘cold ice’ is effectively attached to the bedrock and that, given the low temperatures, englacial hydraulic connections are not supported (Reference Blatter and HutterBlatter and Hutter, 1991; Reference PatersonPaterson, 1994). However, recent studies of polythermal glaciers (which contain cold ice) have demonstrated that drainage networks between supraglacial streams and englacial conduits can develop within cold ice which eventually outflow to the base (Reference Gulley, Benn, Screaton and MartinGulley and others, 2009; Reference Irvine-Fynn, Hodson, Moorman, Vatne and HubbardIrvine-Fynn and others, 2011). Such observations could help explain the existence of the patterns of radar reflectivity found outside of the temperate ice identified. It could also be the case that a thin layer of temperate ice exists at the base which was not detected by the radar.
The resulting basal reflectivity patterns and the interpreted dielectric values (which contrast the ice bed) show localized zones of saturation (Fig. 6). This saturation suggests that Glaciar Olivares Alfa might be hydrologically configured by a small number of large channels (instead of widespread small conduits) which efficiently transport meltwater out of the glacier. This type of hydrological configuration is characterized by channels that change size depending on the amount of discharge (Reference BjörnssonBjörnsson, 1998; Reference Bennett and GlasserBennett and Glasser, 2011). At the same time this hydrological configuration also influences ice motion by reducing basal traction (Reference Rippin, Willis, Arnold, Hodson and BrinkhausRippin and others, 2005). Such influences may explain the relatively low surface velocities observed at Glaciar Olivares Alfa. Between December 2012 and August 2013, ice velocities, measured at stake locations on the glacier surface (see Fig. 1) ranged from 0.9 to 5.1 m a–1, which is ‘slow’ compared to other nearby glaciers. Surface velocity at Olivares Beta, for example, which is located ~4 km to the north of Olivares Alfa, was observed to range from 2.3 to 12.8 m a–1 over the same period (CECs, 2013).
The GPR data analyses made for this study give us an overall idea of the basal conditions of the glacier; however, the method applied cannot guarantee accuracy on the detection of accumulated water. The restrictions are mostly attributed to the system resolution (i.e. the water layer is too thin to be detected) and to the underestimation of the englacial attenuation. Anyway, the methodology used provides a fairly representative approach to the subglacial characteristics of Glaciar Olivares Alfa.
Conclusions
A 50 MHz airborne radar system was used to survey the polythermal Glaciar Olivares Alfa. This survey represents a unique GPR dataset for the central Chilean Andes glaciers, allowing the characterization of englacial and subglacial features. Radar data revealed that Olivares Alfa consists of a two-layered thermal structure, with temperate ice lying at the base, covered almost entirely by cold ice. The underlying temperate ice is connected to the surface by englacial conduits through which subglacial meltwater can drain. Overall, the distribution of the warm ice suggests that the temperate layer identified developed as a result of ice thickness and the geothermal heat flux.
Although the temperate ice covers a large part of the base of the glacier, reflectivity patterns do not correlate to the whole area covered but only to localized areas where accumulated water was detected. However, saturated materials are more widely spread and near the lower front. These findings might be restricted by the limitations of the radar system, specifically when detecting thin layers of water and due to potential underestimation of the englacial attenuation. However, the GPR method described is shown to successfully characterize both the basal conditions and the polythermal conditions, variables which are poorly studied and are important when estimating mass balance and ice dynamics.
Acknowledgements
CECs is funded by the Basal Financing Program of the Scientific and Technological National Commission of Chile (CONICYT). CODELCO Andina Division and Anglo American Chile mining companies supported this research. We thank two anonymous reviewers whose constructive comments and suggestions greatly improved this paper.


