


Implications
Continuous or intermittent periods of depressed rumen pH are associated with health disorders of the animal. Rumen sensors allow continuous monitoring of pH, but their limitations must be considered. Fixed conversion factors to correct for absolute pH difference values at different locations should not be used. Substantial drift of non-retrievable sensors limits their application. To interpret pH data generated by sensors, we recommend the use of the area under the pH × time curve, which integrates both duration and extent of pH depression, as well as summarizing parameters obtained from fitting equations to cumulative pH data.
Introduction
The use of biosensors is becoming increasingly important in the livestock sector. Biosensors have the potential to measure physiological, immunological, behavioural and other variables in livestock. These devices provide specific information to assist decision-making for farm management. In another contribution presented at the 2019 International Symposium on Ruminant Physiology (Leipzig, Germany), the application of biosensors other than rumen sensors is discussed (Knight, Reference Knight2020); the present review focuses on rumen sensors, which may measure pH, temperature, motility, pressure, redox potential, ammonia and ammonium, dissolved oxygen, conductivity, and several mineral ions. It is expected that rumen sensors will be developed further to measure rumen volatile fatty acids (VFA) and gases including methane. The present review will focus specifically on the measurement of pH and redox potential. The development and description of probes to measure pH in the rumen of cannulated cattle began in the 1950s (Lampila et al., Reference Lampila1955). Major developments have allowed a range of sensors for use in the present day, including commercially available, wireless rumen sensors. Rumen sensors offer several advantages over other methods to measure rumen characteristics. In particular, rumen sensors allow continuous and high-resolution measurement of pH and other key rumen characteristics which aid in evaluating ruminal kinetic behaviour. Frequent sampling is of interest in view of the high diurnal variation in rumen variables, in particular ruminal pH, which is associated with ruminal disorders (Plaizier et al., Reference Plaizier, Danesh Mesgaran, Derakhshani, Golder, Khafipour, Kleen, Lean, Loor, Penner and Zebeli2018). Frequent sampling via oral sampling and rumenocentesis techniques to obtain samples of rumen contents from live, non-cannulated animals is undesirable and practically difficult. The vast amount of data generated by rumen sensors must be properly processed and interpreted to provide information on the physiological status of the rumen and the host animal. This review focuses on the use of sensors to measure ruminal pH and discusses variation in ruminal pH in both time and location, disorders commonly associated with low pH and data analysis methods to summarize and interpret rumen pH data. This review also discusses the use of sensors to measure redox potential as an indication of the fermentation processes.
Ruminal pH regulation
Ruminal pH is the outcome of the concerted acid–base regulation efforts of the rumen, including rumen microbiota, and the host (Humer et al., Reference Humer, Aschenbach, Neubauer, Kröger, Khiaso-ard, Baumgartner and Zebeli2018). Microbial fermentation of feed in the rumen yields VFA and (in particular situations) lactic acid. Usually production of acids in the rumen is much greater than entrance of any acids with the feed (Aschenbach et al., Reference Aschenbach, Penner, Stumpff and Gäbel2011). Acids can accumulate and reduce ruminal pH if the rate of removal from the rumen and rumen buffering cannot keep pace with their production rate (Dijkstra et al., Reference Dijkstra, Ellis, Kebreab, Strathe, López, France and Bannink2012). Removal of VFA from the rumen occurs by passage in the liquid phase to the omasum and by absorption through the rumen wall. The majority of VFA produced in the rumen is absorbed through the reticulo-rumen wall. Approximately, 15% (in sheep and calves) up to 40% (in cattle) passes into distal parts of the digestive tract (Aschenbach et al., Reference Aschenbach, Penner, Stumpff and Gäbel2011).
Volatile fatty acid absorption
The rate of absorption of VFA depends on several factors, including the chain length of the acid absorbed, the acid concentration, the pH, the osmotic pressure and expression of genes involved in absorption (Dieho et al., Reference Dieho, van Baal, Kruijt, Bannink, Schonewille, Carreño, Hendriks and Dijkstra2017b; Stumpff, Reference Stumpff2018). Several apical VFA absorption mechanisms in the rumen epithelium have been identified (Aschenbach et al., Reference Aschenbach, Penner, Stumpff and Gäbel2011; Stumpff, Reference Stumpff2018). Undissociated VFA may be absorbed via lipophilic diffusion. However, at physiological ruminal pH values, only a small proportion of VFA are present in the undissociated form. The major pathway for apical non-diffusional absorption of VFA appears to be through VFA – bicarbonate exchange. In this bicarbonate-dependent mechanism, the rumen epithelium supplies an amount of bicarbonate to the rumen comparable to the amount of bicarbonate entering the rumen via saliva. This mechanism contributes considerably to the buffering capacity of the rumen (Aschenbach et al., Reference Aschenbach, Penner, Stumpff and Gäbel2011). Another protein-mediated apical transport mechanism of VFA is bicarbonate-independent. Independent of the mechanism, apical uptake of VFA leads to cytosolic acidification and stimulates Na+/H+ exchange (Stumpff, Reference Stumpff2018). Given that the rumen epithelium is the main site for absorption of acids and that the epithelium is highly selective to prevent entry of toxins or microbes from the rumen into blood, a large and intact epithelial surface appears essential. A low pH in combination with high luminal VFA concentrations may damage the epithelium, possibly resulting in the entrance of toxins, which is associated with inflammation of the rumen wall and with systemic inflammation (Aschenbach et al., Reference Aschenbach, Zebeli, Patra, Greco, Amasheh and Penner2019). Furthermore, changes in rumen papillae morphology and surface area available for absorption are rapid in response to changes in supply of fermentable substrate (Dirksen et al., Reference Dirksen, Liebich, Brosi, Hagemeister and Mayer1984; Dieho et al., Reference Dieho, Dijkstra, Klop, Schonewille and Bannink2017a). However, during early postpartum (pp) adaptation to increased levels of rapidly fermentable substrate, greater surface area was not associated with increased fractional absorption rate of VFA (Dieho et al., Reference Dieho, Dijkstra, Schonewille and Bannink2016b), which indicates that factors other than papillae surface area may limit VFA absorption and thus affect ruminal pH. In comparison with apical entrance of VFA, pathways of basolateral efflux of VFA are less well described. The latter pathways likely involve lipophilic diffusion, the monocarboxylate transporter 1, the anion exchanger isoform 2 and anion channels (Stumpff, Reference Stumpff2018). Indirect or direct coupling of basolateral VFA efflux to either bicarbonate import or proton export may contribute to net removal of protons from epithelial cells into blood (Aschenbach et al., Reference Aschenbach, Penner, Stumpff and Gäbel2011).
Other factors affecting ruminal pH
In general, a weak, negative relationship between ruminal total VFA concentration and pH exists across diets (r 2 = 0.13; Allen, Reference Allen1997), indicating large variation between diets. For example, the regression coefficient relating ruminal pH to VFA concentration (in mM) in sheep varied significantly between diets from −0.0060 to −0.0168 (Briggs et al., Reference Briggs, Hogan and Reid1957). Mechanisms other than removal of acids to reduce the acid load in the rumen help to explain this large variation. Long forage particles in the diet modify ruminal digesta and promote rumination and salivary secretion, which helps to buffer the acids produced by fermentation of feed in the rumen. The diet characteristic physically effective NDF, which integrates information on the amount of fibre in the diet and the particle length of forages, may have a significant impact on ruminal pH through effects on ruminal mat formation, rumen motility and the provision of salivary buffers (Plaizier et al., Reference Plaizier, Danesh Mesgaran, Derakhshani, Golder, Khafipour, Kleen, Lean, Loor, Penner and Zebeli2018). However, as discussed below, feeding behaviour has a much more profound impact on rumen pH. Exogenous buffering of feedstuffs is another factor that may affect ruminal pH. This buffering is influenced by the existing relationship of strong cations to anions in the feedstuffs, and the exchange of these cations from charged groups (e.g., lignin and protein) for protons (McBurney et al., Reference McBurney, Van Soest and Chase1983). However, in a comparison of exogenous buffering capacity of feed with that of saliva, Allen (Reference Allen1997) concluded that saliva is of greater importance in buffering rumen contents.
The complex factors and interactions between rumen and host that ultimately determine ruminal pH may also result in large variation among animals in their ruminal pH response to dietary changes. Individual animals showed considerable variation in ruminal pH in response to feeding diets aimed to induce rumen acidosis (Brown et al., Reference Brown, Krehbiel, Galyean, Remmenga, Peters, Hibbard, Robinson and Moseley2000). In particular, circadian pH values may have high individual animal variation (Schmitz et al., Reference Schmitz, Schnabel, von Soosten, Meyer, Hüther, Spiekers, Rehage and Dänicke2018). Diet composition appears to affect the individual animal variation in rumen pH characteristics. Penner et al. (Reference Penner, Taniguchi, Guan, Beauchemin and Oba2009b) observed greater variation in ruminal pH among cows fed a high concentrate (64% on DM basis) than a low concentrate (8% on DM basis) diet. Variation in feed intake behaviour, salivation and rumination, rumen volume, rate of clearance of VFA from the rumen, rumen epithelial metabolism and exchange of buffers across the rumen wall may all potentially contribute to this individual animal variation in pH response, and these are not well understood or characterised. Penner et al. (Reference Penner, Aschenbach, Gäbel, Rackwitz and Oba2009a) found that sheep with a relatively minor pH response to oral drenching with glucose had greater rates of acetate and butyrate absorption by rumen epithelial tissue in vitro, compared with sheep with a more pronounced rumen pH response. Gao and Oba (Reference Gao and Oba2016) did not observe differences in VFA absorption from the rumen of dairy cattle characterised by greater or lower risk of acidosis, but expression of several genes involved in VFA metabolism in the rumen epithelium was related to variation between acidosis risk groups. In view of such large individual animal variation, measurement of rumen pH kinetics in combination with other signals of rumen acidosis may help to identify individuals at risk of acidosis.
Variation in ruminal pH
Within-day variation
The rumen is not homogenous in time and site, and any measure – whether continuous or static – has limitations. Rate of intake and rate of fermentation vary, and consequently, ruminal pH also varies markedly throughout the day. Usually, ruminal pH decreases after a meal and slowly recovers until the next meal (Allen, Reference Allen1997). The number of meals per day has a large impact on pH dynamics in the rumen. For example, diurnal changes in pH were much more marked in cows fed concentrate in 2 compared with 12 equal portions daily, while keeping total feed intake constant (French and Kennelly, Reference French and Kennelly1990). Although sugars and starch are generally considered to be rapidly fermentable carbohydrates, some types of fibre also ferment rapidly (e.g., low-lignin fibre in citrus pulp or in lush, leafy grass). Aggregating several rapidly fermentable carbohydrate components (starch, sugars, and fibre) based on their rumen fermentation characteristics into total rapidly fermentable carbohydrates (Doorenbos et al., Reference Doorenbos, Martin-Tereso, Dijkstra and Van Laar2017) may help to improve predictability of responses to dietary changes in dairy cattle. With high levels of rapidly fermentable carbohydrates in the rumen, microorganisms will use a larger proportion of the substrate to maintain intracellular pH or, when nitrogen is in short supply, for energy spilling, which further increases acid production (Dijkstra et al., Reference Dijkstra, France and Davies1998). Next to infrequent ingestion of large meals, a high eating rate may affect ruminal pH and increase within-day variation in ruminal fluid pH. A greater eating rate is associated with lower feed ensalivation per unit of feed (Beauchemin et al., Reference Beauchemin, Eriksen, Nørgaard and Rode2008) and consequently a smaller supply of bicarbonate during a meal to buffer the rapidly formed acids. Social interactions between group-housed animals may also affect variation in ruminal pH. Social hierarchy between animals determines priority of access to feed. Competition for feed or feeding space affects feeding behaviour, including amount of time spent feeding each day, eating rate and/or feed sorting (Neave et al., Reference Neave, Weary and Von Keyserlingk2018), all of which affect variation in ruminal pH. Both very subordinate and very dominant heifers housed in pens with 2, 4 or 8 individuals per concentrate feeding place were at a greater risk of ruminal acidosis as competition in the pens increased, as indicated by lower ruminal pH by rumenocentesis (González et al., Reference González, Ferret, Manteca, Ruíz-de-la-Torre, Calsamiglia, Devant and Bach2008). Overall, large within-day variation in ruminal pH may occur depending on changes in amount and composition of diet and intake behaviour. Frequent measurements are needed to assess this variation in ruminal pH.
Variation between rumen locations
Next to heterogeneous distribution of ruminal pH in time, pH is not homogenously distributed throughout the rumen (Duffield et al., Reference Duffield, Plaizier, Fairfield, Bagg, Vessie, Dick, Wilson, Aramini and McBride2004). Usually, pH in the rumen mat and in the central rumen is lower than pH in the ventral rumen sac, which in turn is lower than in the reticulum (Aschenbach et al., Reference Aschenbach, Penner, Stumpff and Gäbel2011). Differences in rate of fermentation of substrates at different sites in the rumen, as well as differences in acid absorption and buffer secretion at different sites, all contribute to the heterogeneous pH distribution. Intra-ruminal equilibration of acids and buffers may be facilitated by contractive cycles of the reticulorumen muscle bands mixing the ruminal contents. Factors (e.g., ruminal mat) that retard the movement of fluid (including the acids and buffers) in the rumen result in low pH values at substrate-rich, active fermentation regions in the rumen, increasing heterogeneity of pH distribution within the rumen (Storm and Kristensen, Reference Storm and Kristensen2010). Rumen sensors measure pH at a particular site within the rumen. Sensors in non-cannulated animals usually reside in the reticulum, whereas sensors in cannulated animals are usually placed in the ventral rumen sac. Differences in pH between several sites in the rumen are frequently reported; a selection of results is presented in Table 1. The difference in mean pH of a 24-h period at different locations ranged from 0.2 to 0.9 units, and the difference in minimum (nadir) pH ranged from 0.4 to 1.1 units. Although distinct differences in pH between locations occur, several authors have reported significant relationships (r = 0.41 to r = 0.89) between pH measured at different locations (Kimura et al., Reference Kimura, Sato, Goto, Yamagishi, Okada, Mizugughi and Ito2012; Sato et al., Reference Sato, Ikeda, Tsuchiya, Ikuta, Murayama, Kanehira, Okada and Mizuguchi2012; Klevenhusen et al., Reference Klevenhusen, Pourazad, Wetzels, Qumar, Khol-Parisini and Zebeli2014). Differences between pH at different rumen locations depend on level of feed intake and diet composition. For example, with pasture feeding, Lampila (Reference Lampila1955) reported a maximum difference of 1.1 pH units between the contents in the upper region and the lower forward region of the rumen, whereas this difference was smaller (0.6 pH units) with a mixed diet consisting of fodder beet, hay, straw and concentrate. Klevenhusen et al. (Reference Klevenhusen, Pourazad, Wetzels, Qumar, Khol-Parisini and Zebeli2014) reported greater pH differences between reticular pH and ventral rumen liquid or particle-associated rumen liquid pH, when concentrate inclusion was 60% (DM basis) compared with zero concentrate. In close-up and early lactation cows, the reticular pH showed less fluctuation (overall SD 0.19 pH units) than pH profiles recorded in the ventral rumen (overall SD 0.51 pH units), and the difference between ruminal and reticular pH varied across week of lactation (Falk et al., Reference Falk, Münger and Dohme-Meijer2016). These examples illustrate that pH data obtained using rumen sensors require careful interpretation, taking into account the location of measurement, feeding behaviour and diet characteristics. In addition, universal application of fixed conversion factors to correct for absolute pH difference values at different locations is best avoided.
Table 1 Differences between ruminal pH measurements obtained from different sites in the rumen
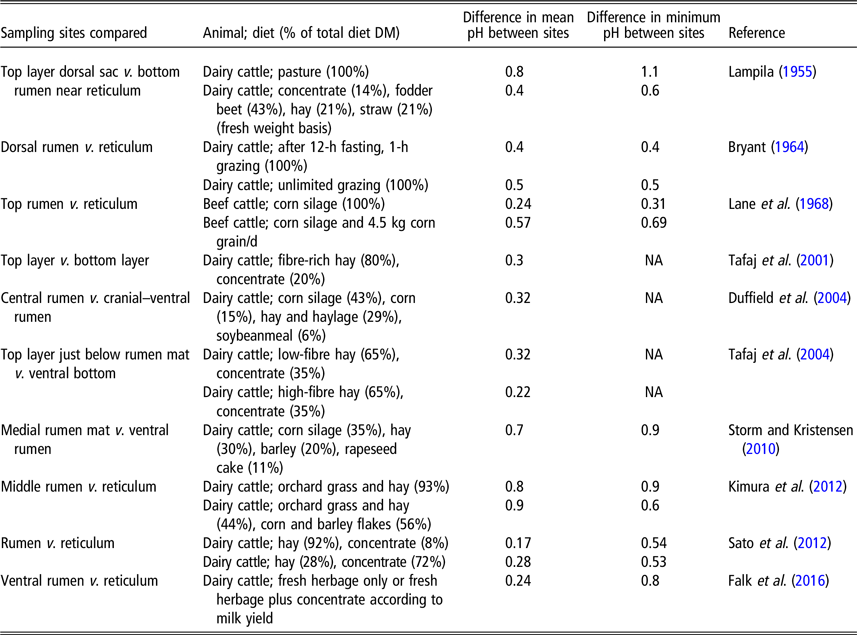
NA=not available.
Ruminal pH, acidosis and disorders
Depression of ruminal pH is associated with health disorders of the animal. Many studies have addressed and classified subacute and acute acidosis based on the degree of ruminal pH depression. A wide range of thresholds to identify acidosis has been proposed, including the mean pH value, nadir pH value, time below a certain pH, and indices that weigh the time spent under the optimal ruminal pH by the magnitude of the deviation from this pH (Humer et al., Reference Humer, Aschenbach, Neubauer, Kröger, Khiaso-ard, Baumgartner and Zebeli2018; Plaizier et al., Reference Plaizier, Danesh Mesgaran, Derakhshani, Golder, Khafipour, Kleen, Lean, Loor, Penner and Zebeli2018). Given the large pH variation in time and location within the rumen, it is of little surprise that there is no scientific consensus regarding pH-related thresholds for identification of acidosis.
Of particular concern though, is the relationship between ruminal pH and disorders. Symptoms and associated disorders indicative of acidosis reach beyond simply a decline in rumen pH. The immediate, negative consequence of low ruminal pH is reduced ruminal fibre degradation and reduced microbial protein synthesis (MPS). On the positive side, a reduction in ruminal pH drives a change in the VFA profile towards more propionate and less acetate production (Bannink et al., Reference Bannink, France, Lopez, Gerrits, Kebreab, Tamminga and Dijkstra2008). This change in VFA profile is associated with a decrease in methane production and an increased supply of glucogenic nutrients, in turn associated with decreased non-esterified fatty acid plasma levels and decreased mobilisation of body adipose tissue particularly in early lactation (Van Knegsel et al., Reference Van Knegsel, Van den Brand, Graat, Dijkstra, Jorritsma, Decuypere, Tamminga and Kemp2007). Many symptoms associated with acidosis have been described, including reduced richness and diversity of microbiota and damage to the epithelial barrier at the gut level, increased endotoxins and acute phase protein levels in blood plasma at the post-absorptive level, and reduced feed intake and milk fat depression at the animal level. An overview is presented in Table 2. Detailed reviews of these symptoms in relation to ruminal pH can be found elsewhere (Humer et al., Reference Humer, Aschenbach, Neubauer, Kröger, Khiaso-ard, Baumgartner and Zebeli2018; Plaizier et al., Reference Plaizier, Danesh Mesgaran, Derakhshani, Golder, Khafipour, Kleen, Lean, Loor, Penner and Zebeli2018; Aschenbach et al., Reference Aschenbach, Zebeli, Patra, Greco, Amasheh and Penner2019).
Table 2 Symptoms of acidosis in ruminants

A depression of ruminal pH may be only one of several factors involved in acidosis-related symptoms. Different diet types may result in similarly low levels of pH but differ in signs of acidosis. For example, similarly depressed ruminal pH induced by feeding cattle pelleted ground alfalfa compared with feeding grain pellets was associated with increased lipopolysaccharide (LPS) endotoxin levels in the rumen, but only the grain diet caused translocation of LPS, systemic inflammation and an acute phase response (review Plaizier et al., Reference Plaizier, Danesh Mesgaran, Derakhshani, Golder, Khafipour, Kleen, Lean, Loor, Penner and Zebeli2018). Cows consuming pasture-based diets may experience depressed ruminal pH (mean pH and nadir pH below 5.8 and 5.6, respectively, in the top layer of the dorsal sac (Lampila, Reference Lampila1955) or in the ventral rumen (Taweel et al., Reference Taweel, Tas, Smit, Elgersma, Dijkstra and Tamminga2005)) and may have a low milk fat content; yet in pasture-based diets, acidosis-related problems are not commonly reported or experienced as a major problem. In a study with sheep, ruminal pH was maintained at similar levels by continuous infusion of acids on a hay diet or continuous infusion of bases on a 90% concentrate diet (Mould and Ørskov, Reference Mould and Ørskov1983). Reduction of the ruminal pH (from 6.6 without acid infusion to 5.9 or lower with acid infusion) in hay-fed sheep led to the inhibition of cellulolytic activity and partial destruction of the rumen microflora. However, increasing the ruminal pH of sheep offered the concentrate diet (from 5.3 without base infusion to 6.2 or higher with base infusion) did not increase cellulolytic activity and DM degradation and did not greatly alter the rumen microflora, further suggesting that effects of ruminal pH on rumen fermentation are diet-dependent. Taken together, these findings indicate that ruminal pH is not the sole factor involved in acidosis-related disorders. A low rumen pH per se is not necessarily and causally related to clinical signs of acidosis. Although it remains the most commonly used indicator, rumen pH needs to be combined with other observations to reliably identify acidosis.
Data analysis methods and data interpretation
Rumen sensors, both wireless sensors used in non-cannulated animals as well as indwelling systems in cannulated animals, provide high-resolution measurements of pH to evaluate kinetic behaviour. The data generated need to be properly processed and interpreted to provide information on the physiological status of the rumen. Many different analyses methods and characteristics have been proposed. These will be illustrated using pH data from an experiment with dairy cattle described by Dieho et al. (Reference Dieho, Bannink, Geurts, Schonewille, Gort and Dijkstra2016a and Reference Dieho, Dijkstra, Schonewille and Bannink2016b). In this experiment, rumen cannulated cows in early lactation had free access to a basal lactation ration fed once a day (42% grass silage, 41% corn silage and 17% soybean meal on a DM basis). Treatment consisted of either a gradual (0.25 kg DM/day; GRAD) or a rapid (1.0 kg DM/day; RAP) increase of concentrate allowance (up to 10.9 kg DM/day), starting at d four pp, aimed at creating a contrast in rumen-fermentable organic matter (FOM) intake and consequently in rumen fermentation characteristics. Concentrate was fed using dispensers, and daily allowance was evenly divided over six 4-h periods. Rumen fluid pH was measured in the ventral sac every 15 s for 48 h using a continuous pH measurement system (model T4; Dascor Inc., Escondido, CA, USA) and data were averaged per minute. The pH profiles of four individual cows (two from GRAD and two from RAP) measured at d 16 pp are presented in Figure 1. At d 16 pp, GRAD and RAP cows had a concentrate intake of 3.6 and 10.9 kg DM/day, respectively, and a FOM intake of 10.1 and 12.3 kg/day, respectively. The pH profiles (Figure 1) clearly indicate large differences in pH kinetics between individual cows, with GRAD cows showing less variation than RAP cows.

Figure 1 Ruminal pH, measured using an indwelling pH sensor in the ventral rumen, as a function of time of individual cows at 16 days pp fed a mixed diet with a gradual (0.25 kg of DM/day) (cow A and cow B) or a rapid (1.0 kg of DM/day) (cow C and cow D) rate of increase of concentrate allowance postpartum; details of experiment and measurements described by Dieho et al. (Reference Dieho, Bannink, Geurts, Schonewille, Gort and Dijkstra2016a and Reference Dieho, Dijkstra, Schonewille and Bannink2016b).
Commonly reported pH characteristics of these four individual cows are presented in Table 3. In line with the greater daily FOM intake, mean pH was lower for the RAP than for the GRAD individuals. However, mean pH does not properly reflect differences in variation in pH during the day (see Figure 1) that are of interest in view of acidosis signs and developments. Large diurnal variation in ruminal pH from cows with identical management also illustrates the ineffectiveness of using infrequent sampling techniques. Diurnal variation in ruminal pH differs widely between individuals (e.g., Macmillan et al., Reference Macmillan, Gao and Oba2017). For example, if the two cows fed the RAP diet would have been sampled at 1300 h (approximately 3 h after feeding the basal diet), one cow would have a pH value close to the minimum pH value of the full 24-h period (i.e., 5.3), whereas the other cow would have a pH value close to the mean pH value of the full 24-h period (i.e., 6.2) (Figure 1). Although recommendations have been suggested as to the optimal time of sampling when using infrequent sampling techniques (review Humer et al., Reference Humer, Aschenbach, Neubauer, Kröger, Khiaso-ard, Baumgartner and Zebeli2018), individual variation remains a large obstacle to properly interpret infrequently sampled data.
Table 3 Rumen pH indicators of individual cows fed a mixed diet with a gradual (0.25 kg of DM/day; GRAD) or a rapid (1.0 kg of DM/day; RAP) rate of increase of concentrate allowance postpartum1
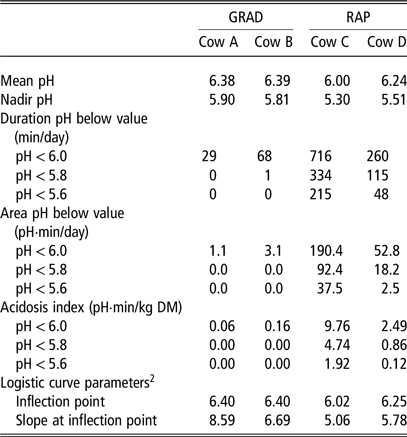
1 pH measured using an indwelling pH sensor in the ventral rumen of four individual rumen cannulated cows at 16 days pp; details of experiment and measurements described by Dieho et al. (Reference Dieho, Bannink, Geurts, Schonewille, Gort and Dijkstra2016a and Reference Dieho, Dijkstra, Schonewille and Bannink2016b).
2 Logistic model; pHc = 1440 / (1 + exp[−S × (pH – I)]), where pHc is the cumulative time below pH (min/day), S is the slope at the inflection point (in /pH unit), and I is the inflection point (in pH unit).
Continuous monitoring of ruminal pH allows the minimum pH to be determined. The between-animal variation in minimal pH in the rumen is usually greater than that in mean pH. The maximum difference in mean pH between the four cows (Table 3) was 0.39, whereas the maximum difference in minimum pH was 0.60. Although the minimum pH is useful to examine variation from the mean pH that may impact rumen microbial metabolism, the length of time ruminal pH is below a particular threshold may be of greater interest with respect to microbial metabolism. For example, De Veth and Kolver (Reference De Veth and Kolver2001) evaluated the impact of diurnal variation in pH on digestion of pasture and MPS in continuous culture. The same minimal pH of 5.4 was held for different lengths of time (4, 8 or 12 h in a 24-h period), with pH 6.3 at all other times, to arrive at a mean pH of 6.15, 6.00 and 5.85. The length of time at pH 5.4 was negatively related to organic matter digestibility and to MPS, and thus minimum pH alone (which was equal in all three treatments) does not provide sufficient characterisation of the ruminal pH conditions.
The time below a threshold pH is often presented as an indication of the severity of acidosis. The actual threshold value chosen varies widely (between 5.50 and 6.25), as pH values obtained depend on sampling location in the rumen and on measurement technique (Villot et al., Reference Villot, Meunier, Bodin, Martin and Silberberg2018). The length of time with ruminal pH below commonly suggested thresholds of 6.0, 5.8 or 5.6 was much greater for the two RAP cows than the two GRAD cows (Table 3), likely related to the greater intake of rapidly FOM. Although time below a threshold pH value is widely used as an indicator of risk of acidosis, it does not provide an indication of the extent of pH depression. Animals with the same time below a threshold pH may differ in minimum pH and therefore may differ in severity of pH depression. The area under the pH × time curve integrates both duration and extent of pH depression below a threshold and is potentially of more interest than simply the time below a threshold pH. A study of Macmillan et al. (Reference Macmillan, Gao and Oba2017) illustrates this difference. In that study, dairy cows were classified as higher risk or lower risk for subacute acidosis and were subsequently fed a high-grain diet once or three times per day. Higher risk cows had a greater time below pH 5.8 than lower risk cows, and feeding frequency did not affect time below pH 5.8. However, feeding more often reduced the area below a pH of 5.8 for higher risk cows, whereas feeding frequency had no effect on area below a pH of 5.8 for lower risk cows. Thus, effect of feeding frequency would be evaluated differently when based on time below a threshold pH than when based on area under the pH × time curve.
An acidosis index has been proposed, which indicates the severity of acidosis normalised for feed intake (Penner et al., Reference Penner, Aschenbach, Gäbel, Rackwitz and Oba2009a). This index is calculated as the area under the pH × time curve divided by DM intake (DMI). Individual animals differ in feed intake on the same diet, and the amount of feed consumed has a major impact on ruminal pH. The acidosis index attempts to scale the pH response of animals to similar DMI levels. In the example provided in Table 3, DMI did not differ greatly between cows, and therefore, acidosis index differences were similar to the area under the pH × time curve differences between cows. Besides the level of feed intake, the rumen fermentability of the feed impacts ruminal pH. Hence, comparing animals on basis of acidosis index should preferably be done at similar diet composition and feeding frequency, as to avoid confounding with changes in fermentability of the diet.
In view of large inter-animal variability in ruminal pH at similar feed intake and diet composition, Villot et al. (Reference Villot, Meunier, Bodin, Martin and Silberberg2018) aimed to standardize data processing from rumen pH sensors. They calculated relative pH indicators by filtering and normalizing data to remove inter-individual variability, sensor drift (discussed in a subsequent paragraph) and sensor noise. After data normalization, Villot et al. (Reference Villot, Meunier, Bodin, Martin and Silberberg2018) calculated cumulative time for pH being 0.3 or 0.5 units lower than the individual normalized pH, as well as the associated area under pH × time curve. They concluded that these relative pH indicators are more relevant for comparing acidosis than non-normalized individual animal data. This approach may help to reduce the effect of individual animal variation in ruminal pH. However, it requires similar diets to be fed in the initial period of pH measurements to help establish initial individual variation. Moreover, to evaluate subsequent periods in which acidosis might occur, absence of interaction between initial pH level and individual response to a subsequent change in intake or diet composition has to be assumed. Similar to the individual animal approach of Villot et al. (Reference Villot, Meunier, Bodin, Martin and Silberberg2018), Denwood et al. (Reference Denwood, Kleen, Jensen and Jonsson2018) distinguished long-term temporal pH variation by using a generalized additive model, reflecting gradual pH changes due to diet or pH sensor drift, and short-term cyclical pH variation by using a sine wave with daily frequency and a sine wave with milking frequency. Upon application of this statistical approach, they showed that deviations from a predictable daily pH rhythm were associated with decreased DMI and milk production of dairy cattle.
Mathematical equations to summarize cumulative pH data
The wide range of pH values suggested as critical points to identify acidosis, and lack of methodology that permits integration of studies to define pH depression, prompted AlZahal et al. (Reference AlZahal, Kebreab, France and McBride2007) to evaluate mathematical equations to analyse ruminal pH data. They evaluated several equations (viz. spline lines, Morgan, Richards, and logistic) and derived values from the selected equation that may have biological implication across dietary treatments. The amount of time below multiple pH points from 5.0 to 7.6 was the dependent variable, and pH was the independent variable (see Figure 2 for examples of such cumulative pH profiles of cows in the GRAD and RAP groups). Of the equations AlZahal et al. (Reference AlZahal, Kebreab, France and McBride2007) evaluated, the logistic curve had the least parameters and consistently gave a better prediction. Therefore, the logistic equation was considered the best option to describe the course of ruminal pH.

Figure 2 Accumulated time spent below ruminal pH cut-off points of individual cows at 16 days pp fed a mixed diet with a gradual (0.25 kg of DM/day) (cow A and cow B) or a rapid (1.0 kg of DM/day) (cow C and cow D) rate of increase of concentrate allowance postpartum; ruminal pH measured using an indwelling pH sensor in the ventral rumen; details of experiment and measurements described by Dieho et al. (Reference Dieho, Bannink, Geurts, Schonewille, Gort and Dijkstra2016a and Reference Dieho, Dijkstra, Schonewille and Bannink2016b).
A functional form of the logistic curve was applied to the pH data of the GRAD and RAP cows, to provide an estimate of the inflection point and of the slope of the curve at the inflection point. The inflection point is the point at which a curve changes direction from acceleration to deceleration and occurs at the pH value where exactly half of the accumulated total time is spent below the inflection point. The inflection point is similar to the mean pH value (Table 3). A disadvantage of the logistic curve to summarize continuous pH data is that this fixed point of inflection limits its flexibility to describe different shapes of cumulative pH data. The slope at the inflection point reflects the stability of the ruminal pH throughout the day. Both the slope and the inflection point are greater for GRAD than for RAP cows, indicating a relatively higher average ruminal pH that varies less throughout the day for GRAD cows. Schären et al. (Reference Schären, Seyfang, Steingass, Dieho, Dijkstra, Hüther, Frahm, Beineke, von Soosten, Meyer, Breves and Dänicke2016) used this approach to evaluate variation in ruminal pH upon a change from a total mixed ration (TMR) to pasture. They observed a significant interaction between diet and weeks after change to pasture on the slope parameter, indicating a greater instability of ruminal pH in the initial weeks after transition to pasture that disappeared in later weeks. In the control cows that received the TMR throughout the experiment, such variation was considerably smaller. In contrast, no interaction between diet and time after change to pasture was observed for the variable time pH < 5.8 or time pH < 5.6. Overall, fitting equations to the cumulative pH data generated by rumen sensors provides parameters that are useful to summarize diurnal pH variation and to compare effects of diet composition or feeding strategy, or to evaluate differences between individual animals.
Sensor drift
A major concern in the analysis and interpretation of pH data obtained with rumen sensors is the shift over time (referred to as drift) in the accuracy of the base line of the sensors. The probes contain the complete sensor including the reference electrode. Over time, coating and ageing of pH electrodes can cause changes in their characteristics. Rumen fluid may gradually diffuse into the sensor and affect the reference electrode. Electrode drift is commonly observed. In cannulated animals, rumen sensors are retrieved, and sensors may be calibrated using buffers to correct for drift during the time sensors are in the rumen. Using new electrodes, no significant change in baseline millivolt readings occurred after 72 h of ruminal incubation and mean error was 0.03 pH units, but maximal error observed was 0.18 pH units (Penner et al., Reference Penner, Beauchemin and Mutsvangwa2006). This indicates that pre- and post-measurement standardization is required, with sensor drift usually being corrected by assuming that change due to drift is linear in time. However, in non-cannulated animals, the rumen sensor is unrecoverable until postmortem, and sensor drift correction is usually not possible. Significant drift of these sensors has been frequently reported. Start of drift occurs already after 2 days (Kaur, Reference Kaur, Garcia, Horadagoda and Fulkerson2010) up to starting from 35 days (Mottram et al., Reference Mottram, Lowe, McGowan and Phillips2008). In dairy cattle, Zosel et al. (Reference Zosel, Kaden, Peters, Hoffmann, Rudisch, Jäkel, Lauckner, Grodrian and Guth2010) reported a drift smaller than 0.20 pH units after 14 days, Lohölter et al. (Reference Lohölter, Meyer, Raulsa, Rehageb and Dänicke2013) reported a drift of 0.03 pH units per week, Klevenhusen et al. (Reference Klevenhusen, Pourazad, Wetzels, Qumar, Khol-Parisini and Zebeli2014) reported a drift of almost 0.5 pH units after 34 days, Andersson et al. (Reference Andersson, Arai and Okada2018) reported a drift of 0.1 pH units after 1 month, and Villot et al. (Reference Villot, Meunier, Bodin, Martin and Silberberg2018) reported a start of drift after 29 days and average drift of 0.025 pH units per week. Such significant drift of indwelling rumen sensors that cannot be retrieved and recalibrated is a major obstacle to their use. Long-term drift may be quantified by calculating moving averages (Villot et al., Reference Villot, Meunier, Bodin, Martin and Silberberg2018) or using a generalized additive model (Denwood et al., Reference Denwood, Kleen, Jensen and Jonsson2018) for individual animals. However, drift established in this way is confounded with any long-term, slow change in ruminal pH due to gentle, consistent variation in voluntary feed intake, feed intake behaviour or gentle dietary changes.
Redox potential
Living organisms obtain the energy required to maintain their cells, to grow, to reproduce, and for other purposes, via electron transfer (Husson, Reference Husson2013). It is therefore of great interest to understand and measure redox potential (also known as reducing potential or oxidoreduction potential) in biological systems. The rumen microbial ecosystem is an anaerobic environment, in which substrates are only partially oxidised by microorganisms; substrates serve as both electron donor and electron acceptor. The majority of microorganisms in the rumen are anaerobic. In general, microbial diversity and fermentation profiles in the rumen are controlled by intra-cellular redox homeostasis and electron transfer, which has a major impact on intracellular metabolism. Intracellular redox balance is difficult to measure. However, extracellular redox balance can be detected conveniently in the fermentation liquid, and this extracellular redox balance reflects intracellular redox balance status (Liu et al., Reference Liu, Xue, Lin and Bai2013).
Oxidation-reduction conditions are classically assessed by measuring the redox potential (Eh; usually expressed in millivolts). The redox potential indicates the reducing potential, which is the tendency of a system to give or acquire electrons. The redox potential is a derivation of the Gibbs free energy change equation applied to redox reactions. Rumen fluid Eh is markedly negative, reflecting the strong reducing power of the rumen environment caused by microbial fermentation activity (Marden et al., Reference Marden, Julien, Monteils, Auclair, Moncoulon and Bayourthe2008). The level of anaerobiosis is related to rumen microbial community structure, microbial growth rate, type of fermentation pathways used and end products formed (Křížová et al., Reference Křížová, Richter, Třináctý, Říha and Kumprechtová2011; Friedman et al., Reference Friedman, Shriker, Gold, Durman, Zarecki, Ruppin and Mizrahi2017) (Figure 3). In view of its contribution to redox homeostasis, Van Lingen et al. (Reference Van Lingen, Plugge, Fadel, Kebreab, Bannink and Dijkstra2016) proposed the ratio of NAD+ to reduced nicotinamide adenine dinucleotide (NADH being a central co-factor carrying electrons) as a key controller of the type of fermentation end products formed. Although electrons are essential reactants in many reactions, including fermentation processes, in several biological science disciplines oxidation–reduction conditions have not received the same attention as have pH conditions (Husson, Reference Husson2013). Indeed, a literature search of Scopus (Elsevier, Amsterdam, the Netherlands) online database using the words ‘rumen’ AND (‘redox potential’ OR ‘reduction potential’ OR ‘reducing potential’ OR ‘Eh’) in article title, keywords, or abstract, resulted in only 105 articles, whereas a search using the words ‘rumen’ and ‘pH’ resulted in 6062 articles. A lack of data on the redox potential of rumen fluid may hamper advancement of knowledge of rumen metabolic processes.
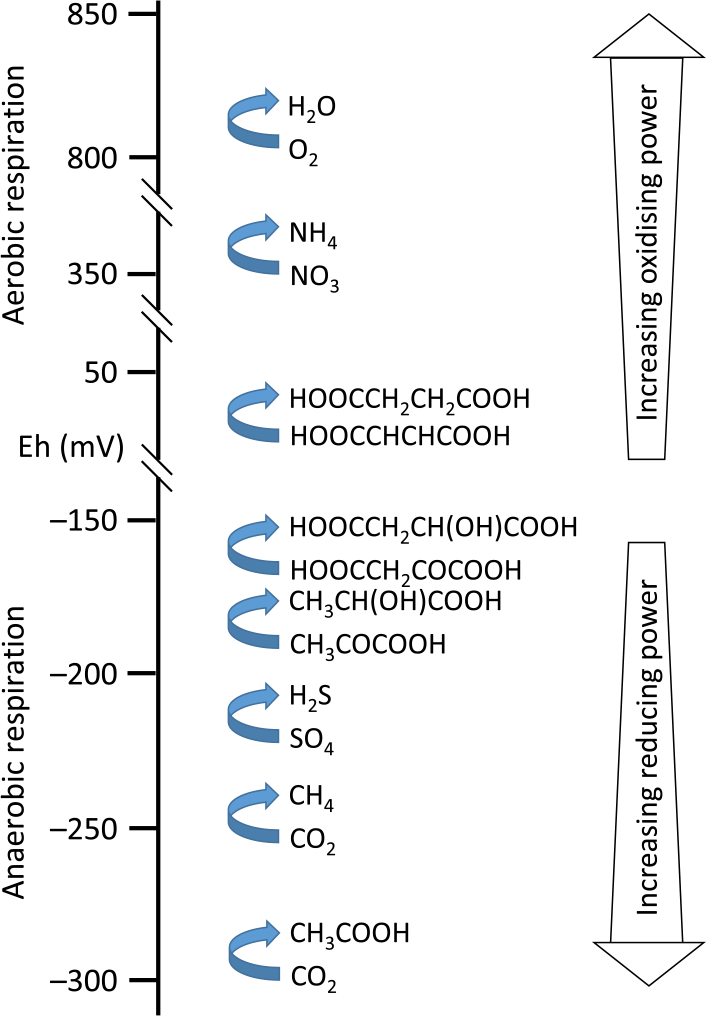
Figure 3 Redox tower of microbial metabolism: illustration of respiration, oxidising or reducing power, and redox potential (Eh) of several reactions in the rumen (based on Liu et al., Reference Liu, Xue, Lin and Bai2013).
Several of the rumen sensors described previously also measure redox potential. One of the major difficulties in using Eh lies in its measurement. In general, the Eh is highly sensitive to air contamination; however, this should not pose a challenge as sensors are submerged in rumen fluid. Initial correction for electrode and reference cell is required, but only positive standard buffers are available, whereas Eh values of interest in rumen fermentation processes are negative. Huang et al. (Reference Huang, Marden, Julien and Bayourthe2018) reviewed available data on Eh in the rumen of cattle, alpaca, goat, and sheep and observed an average Eh value of −238 mV (±85.5; min = −430 mV; max = −115 mV; n = 39), indicating highly reducing conditions. Part of the large variability is caused by the mode of expression of Eh. Redox potential is expressed relative to a standard hydrogen electrode and is determined by the potential of a platinum electrode. In practice, hydrogen electrodes are rarely used, and measurements must be corrected for the difference between the reference electrode actually used (e.g., a silver/silver chloride (Ag/AgCl) electrode or a calomel (Hg/Hg2Cl2) electrode) and the standard hydrogen electrode; however, such a correction is not always done.
In their meta-analysis, Huang et al. (Reference Huang, Marden, Julien and Bayourthe2018) reported significant relationships between Eh and dietary, animal and rumen characteristics. Ruminal Eh was positively correlated with DMI and proportion of concentrate in the diet and negatively correlated with forage NDF content. At rumen level, Eh was negatively correlated with total VFA production and molar proportion of acetate and positively correlated with propionate molar proportion. A curvilinear relationship between rumen Eh and pH was derived (r = 0.77), with an increase in Eh from −288 mV at pH 6.8 to −151 mV at pH 5.9 (pH observations were in the range 5.8 to 6.8). A relationship between Eh and pH is expected because in many oxidation-reduction reactions, there is involvement of protons in addition to the transfer of electrons, and Eh and pH are mutually dependent according to the Nernst equation. For each unit increase in pH at 39 °C, Eh becomes more negative by 62 mV (Clark and Cohen, Reference Clark and Cohen1923). These authors introduced the concept of rH (relative hydrogen scale), defined as the negative logarithm of the hydrogen pressure, to combine Eh and pH values. Although the relationship between ruminal pH and Eh is strong, dietary treatments may result in different responses in pH and Eh related to functional characteristics. For example, Marden et al. (Reference Marden, Julien, Monteils, Auclair, Moncoulon and Bayourthe2008) compared the effects of adding live yeast or sodium bicarbonate on rumen characteristics and apparent total tract digestibility in lactating dairy cattle. Ruminal pH did not differ between live yeast and sodium bicarbonate addition. For both treatments, ruminal pH was higher compared with a control diet without these additives. Similarly, rumen Eh was lower for both live yeast and sodium bicarbonate addition compared with control. However, in contrast to absence of difference in ruminal pH, rumen Eh was lower for live yeast than sodium bicarbonate addition. This indicates that live yeast addition affected reducing power to a greater extent than sodium bicarbonate addition. The significant difference in Eh between live yeast and bicarbonate addition coincided with greater mean propionic acid concentration (25.8 and 20.0 mM) and lesser lactic acid concentration (5.4 and 12.2 mM) in rumen fluid and greater total tract NDF digestibility (41.6 and 34.3%) upon live yeast addition compared with bicarbonate addition. Such results indicate that redox potential provides information on the oxidative reactions involved with rumen microbial activity using substrates as both electron donor and acceptor. This measure of microbial activity differs from ruminal pH, which is the outcome of strong (cations and anions) and weak (VFA, ammonia) acids or bases present as solutes in rumen fluid. It is pertinent to note that, similar to interpretation of ruminal pH values discussed previously, the dynamics of rumen Eh (i.e., at different Eh thresholds, the area above the Eh × time curve) is of interest. However, due to paucity of data, no clear threshold values are available.
Conclusions
Complex and concerted acid-base regulation efforts of the rumen and the host affect variation in ruminal pH. Although ruminal pH and pH dynamics only partially explain the typical symptoms of acidosis, it remains an important indicator and may assist to optimize rumen function. Frequent sampling of ruminal pH is necessary due to its high diurnal variation. Indwelling rumen pH sensors allow continuous monitoring of pH in individual animals, but their limitations must be considered. Firstly, due to differences in pH between ruminal locations, universal application of fixed conversion factors to correct for pH differences between locations should be avoided. Secondly, substantial drift of the sensor baseline in non-retrievable sensors limits their application. To interpret pH data generated by rumen sensors, it is recommended to use the area under the pH × time curve, which integrates both duration and extent of pH depression, and/or to use summarizing parameters obtained from fitting equations to cumulative pH data. Finally, redox potential measured by some rumen sensors directly reflects the microbial intracellular redox balance status, and can provide added value with respect to indices of the fermentative activity of rumen microorganisms. Taken together, proper assessment and interpretation of data generated by rumen sensors requires careful consideration of their limitations under various conditions.
Acknowledgements
The authors thank the organisers of the International Symposium on Ruminant Physiology for their invitation to present at this symposium and publish this review. The authors acknowledge the Product Board Animal Feed (Zoetermeer, the Netherlands) and the Dutch Dairy Board (Zoetermeer, the Netherlands) for their support of the experiments from which data were used in the present paper.
J. Dijkstra 0000-0003-3728-6885
S. van Gastelen 0000-0003-4547-8449
K. Dieho 0000-0002-4812-5211
K. Nichols 0000-0001-6062-7460
A. Bannink 0000-0001-9916-3202
Declaration of interest
Authors declare no conflict of interest or competing interest.
Ethics statement
Not applicable.
Software and data repository resources
Not applicable.


