


Implications
Glucose, a key nutrient for ruminants, is synthesized in the liver from a range of precursors. The response equations developed from meta-analysis highlight the variable rate of conversion of precursors into glucose. This rate follows a law of diminishing return at high precursor availability and increases with peripheral glucose demand or negative energy balance. Also glucose supplied from bypass starch partially substitutes for glucose synthesized in the liver. These results can be used in precision feeding strategies aiming at close coverage of glucose requirements. They will also contribute to the development of nutrient-based feeding systems for ruminants.
Introduction
Glucose is a key energy yielding nutrient for all mammals. It is essential for brain, foetal growth, gut and muscle metabolism (Hammon et al., Reference Hammon, Schäff, Gruse, Weber, Skomial and Lapierre2016) and is the major precursor of lactose, the milk sugar. The ruminants have this peculiarity that they constantly need to synthesize glucose, because limited amounts, if any, are absorbed into the portal circulation unless high-starch diets are fed (Reynolds, Reference Reynolds, Sejrsen, Velplund and Nielsen2006; Loncke et al., Reference Loncke, Ortigues-Marty, Vernet, Lapierre, Sauvant and Nozière2009c). Glucose is synthesized in the liver and the kidneys, and the liver is the most important glucose synthesizing organ in ruminants (Brockman, Reference Brockman, Dijkstra, Forbes and France2005). The availability of glucose precursors is critical to support glucose synthesis.
Despite the numerous studies that evaluated net hepatic glucose release, a limited number of studies simultaneously measured the whole range of precursor uptake and conversion into glucose. Liver uptake of glucogenic precursors accounted for the majority of C released as glucose in maintenance fed sheep (e.g. El-Sabagh et al., Reference EL-Sabagh, Goto, Sugino, Obitsu and Taniguchi2013) but failed to do so in postpartum dairy cows as reviewed by Larsen and Kristensen (Reference Larsen and Kristensen2013), even after accounting for methodological effects on liver blood flow measurements. We postulated that a meta-analysis on published data would provide an overview of hepatic conversion of glucogenic precursors into glucose across a wide range of feeding and production conditions in ruminants, as in Loncke et al. (Reference Loncke, Nozière, Bahloul, Vernet, Lapierre, Sauvant and Ortigues-Marty2015) for ketogenic nutrients across the liver.
The objectives of the present work were to investigate published knowledge on hepatic nutrient fluxes in both sheep and cattle in different physiological status and explore the quantitative relationships between the availability of major precursors, that is, propionate, amino acids and l-lactate, and the net hepatic release of glucose, as well as the regulatory factors which could impact these relationships. We first tested whether net hepatic fluxes of precursors responded to changes in total afferent flux (flux of nutrient supplied to the liver via the portal vein and the hepatic artery, see Supplementary Material S1) to the liver or to net portal appearance (NPA). Having demonstrated better relationships with NPA, the study focused on the incremental responses of hepatic fluxes to changes in NPA, thereby describing the responses to increments of ‘net’ supply of nutrients as in Loncke et al. (Reference Loncke, Nozière, Bahloul, Vernet, Lapierre, Sauvant and Ortigues-Marty2015). The impact of analytical methods used to determine liver blood flow was tested. Factors driving the net hepatic uptake of insulin and interrelationships with glucose fluxes were also investigated.
Material and methods
Selection of relevant publications from the FLuxes of nutrients across Organs and tissues in Ruminant Animals database
We used the Flora (FLuxes of nutrients across Organs and tissues in Ruminant Animals; Vernet and Ortigues-Marty, Reference Vernet and Ortigues-Marty2006) database built from approximately 250 international publications on splanchnic fluxes in multi-catheterized ruminants. Publications anterior to 2008 were used for model development. To be eligible, publications had to report the net hepatic fluxes (see Supplementary Material S1 for definitions) of glucose or one of its major precursors, propionate, total amino acids (measured in the selected publication by its proxy α-amino-N) and l-lactate (Hammon et al., Reference Hammon, Schäff, Gruse, Weber, Skomial and Lapierre2016). Publications or treatments reporting intra-venous infusion of nutrients, use of digestion or metabolism modifiers or non-steady state feeding were discarded. Five eligible datasets were identified to study propionate, α-amino-N, l-lactate, glucose and infusion of propionate with respectively 29 (69), 26 (65), 25 (66), 46 (106) and 5 (16) experimental groups (treatments). No publication was available that reported total amino acids fluxes, only α-amino-N fluxes were available. Insulin concentrations and fluxes were also considered in a separate dataset when available (9 experimental groups, 19 treatments). The list of references used for the meta-analysis is given in Supplementary Material S2.
Because the selected publications did not systematically report the chemical composition and nutritional value of feeds and diets, the feeds and diets from all relevant publications were described according to the INRA Feed Evaluation System (2007) as detailed by Loncke et al. (Reference Loncke, Ortigues-Marty, Vernet, Lapierre, Sauvant and Nozière2009c and Reference Loncke, Nozière, Bahloul, Vernet, Lapierre, Sauvant and Ortigues-Marty2015). As the nutritional status of the animals differed among publications and treatments, the availability of endogenous precursors (alanine and glycerol) coming from tissue mobilization (Leng, Reference Leng1970) was estimated, when relevant, from calculated energy balance (Loncke et al., Reference Loncke, Nozière, Bahloul, Vernet, Lapierre, Sauvant and Ortigues-Marty2015) and tissue composition of mobilized energy (Supplementary Material Table S1). Because in all these experiments animals were fed with frequent meal distributions to keep nutrient supply and animal metabolism at steady state, it was considered that glycogen stores remained constant and did not contribute to net hepatic glucose output.
Attention was paid to the analytical methods used to determine net hepatic fluxes to ensure that all results could be combined in the meta-analysis, as described in Supplementary Material S3 and Supplementary Material Table S2. A special focus was made on blood or plasma flow measurements, usually based on the para-aminohippuric acid (pAH) down-stream dilution method. The pAH is acetylated across the liver and therefore incompletely recovered in the hepatic veins if not deacetylated, as demonstrated in sheep by Katz and Bergman (Reference Katz and Bergman1969) and in cows by Kristensen et al. (Reference Kristensen, Røjen, Raun, Storm, Puggaard, Larsen, Chilliard, Glasser, Faulconnier, Bocquier, Veissier and Doreau2009) and Rodriguez-Lopez et al. (Reference Rodriguez-Lopez, Cantalapiedra-Hijar, Durand, Isserty-Thomas and Ortigues-Marty2014) but 80.4% of available publications did not correct for it.
To relate net glucose flux in the same unit as its precursors, the fluxes were expressed in C units when glucose and precursors were included in the same model (3 mol C/mol propionate, l-lactate or glycerol, 6 mol C/mol glucose). The C supplied from total amino acids was calculated from the average C content of total amino acids released in the portal blood and taken up by the liver (assumed to be 4 mol C/mol amino acid-N, based on Reynolds et al. (Reference Reynolds, Huntington, Tyrrell and Reynolds1988)) and the fluxes of total amino acids. For this, fluxes of α-amino-N were converted to total amino acids (mmol/kg BW per h) as 1.3958 × moles of α-amino-N (Martineau et al., Reference Martineau, Ortigues-Marty, Vernet and Lapierre2009). All absorbed amino acids were assumed to be glucogenic, no correction was applied for the non-glucogenic leucine and lysine which represented only circa 6% of net amino acid C uptake by the liver (Blouin et al., Reference Blouin, Bernier, Reynolds, Lobley, Dubreuil and Lapierre2002; Doepel et al., Reference Doepel, Lobley, Bernier, Dubreuil and Lapierre2009) that we considered as negligible. The alanine mobilized from muscle was also considered as glucogenic based on the evidence reviewed by Larsen and Kristensen (Reference Larsen and Kristensen2013) that alanine is the only amino acid involved in the inter-organ transfer of nitrogen in postpartum dairy cows. Subsequently and for the sake of accuracy, reference is made to α-amino-N for all results derived from measured and reported α-amino-N fluxes and expressed in moles of α-amino-N, and reference is made to total amino acids for all results converted into moles of C from total amino acids from α-amino-N.
Meta-analyses
The meta-analyses focused on the responses of the different net hepatic fluxes (Y variables) to variations in explanatory variables (X) intra-studies, as detailed in Sauvant et al. (Reference Sauvant, Schmidely, Daudin and St-Pierre2008) and Loncke et al. (Reference Loncke, Nozière, Bahloul, Vernet, Lapierre, Sauvant and Ortigues-Marty2015). Net hepatic fluxes are defined as the difference between hepatic efferent and afferent fluxes of nutrients measured in blood or plasma, as detailed in Loncke et al. (Reference Loncke, Nozière, Bahloul, Vernet, Lapierre, Sauvant and Ortigues-Marty2015). Net fluxes can be either positive indicating a net hepatic release or negative indicating a net uptake. Net portal appearance is calculated from the difference between portal venous and arterial fluxes.
Description of the meta-design
The meta-design was described by statistics (mean, SD, range of values) generated for each parameter in the selected datasets. Species and physiological status effects were tested by one-way ANOVA. Normal data distribution and homogeneity of variances were tested by Shapiro–Wilk and Levene tests. All data (nutrient intake, NPA and net hepatic fluxes) were expressed as a function of BW to ensure normal distribution of the variables when combined across species (Loncke et al., Reference Loncke, Ortigues-Marty, Vernet, Lapierre, Sauvant and Nozière2009c).
Models of net hepatic flux of nutrients
For each glucogenic precursor (propionate, total amino acids, l-lactate) it was initially tested whether their net hepatic uptake was best related to their total afferent flux or their NPA. Because net hepatic uptake was better related to net portal fluxes than to afferent fluxes, models developed included the net portal fluxes only. For l-lactate, the energy balance of the animals was also considered as a predictor because of the role of l-lactate in the C economy in the body. Second, the potential contribution of each precursor to net hepatic glucose release was evaluated by studying the relationships between the net hepatic glucose release and the availability of each precursor considered individually. Third, the net hepatic glucose release was considered in relation to the sum of all precursors. This last step required that all precursor and glucose fluxes had been measured in any given study. This was not always the case. An all-precursor dataset was constituted with studies that reported the net hepatic release of glucose and the NPA of at least one precursor (n experimental groups = 45; n treatments = 104). When missing, NPA of other precursors was estimated according to Loncke et al. (Reference Loncke, Ortigues-Marty, Vernet, Lapierre, Sauvant and Nozière2009c), and their net hepatic uptakes were estimated according to the relationships developed in this work. Estimations represented 41%, 29% and 40% of NPA data and 43%, 28% and 46% of net hepatic flux data for propionate, l-lactate and α-amino-N, respectively. Estimations were evaluated by comparing predicted and observed values when available. No biases were detected (results not shown).
Data coding
Experimental groups were coded to specifically explore intra-study variations in NPA or net hepatic uptake of nutrients (X predictors). The physiological status was also coded for each study because of its potential influence on nutrient net hepatic flux (Loncke et al., Reference Loncke, Nozière, Bahloul, Vernet, Lapierre, Sauvant and Ortigues-Marty2015). Within experiments, data were considered only if the reported X variable varied by more than 2% within-study, as in Loncke et al. (Reference Loncke, Nozière, Bahloul, Vernet, Lapierre, Sauvant and Ortigues-Marty2015). This conservative threshold eliminated studies with absolutely no variation in X variables but retained studies with small variations. No selection was imposed on the Y variables.
Determination of response equations
Within-study relationships between Y (net hepatic flux of nutrient) and the potential explanatory variable X were studied using a variance–covariance GLM model:
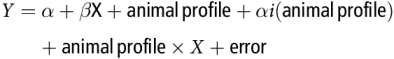 $$Y = \alpha + \beta {\rm{X}} + {\rm{animal\, profile}} + \alpha i\left( {{\rm{animal\, profile}}} \right) + {\rm{animal\, profile}} \times X + {\rm{error}}$$
where α is the overall intercept and αi is the effect of study i on intercept α. The study effect is nested within animal profile, that is, animal species or physiological state. Parameter β is the slope of the overall relationship. When relevant for hepatic glucose release, non-linear models were also considered:
 $$Y = b \times (1{\rm{ }}-{\rm{ }}{e^{( - }}^{\alpha \times X)}) + \alpha i + {\rm{error}}$$
where α is the overall intercept and αi is the effect of study i on intercept α.
In all cases, the best fit model (based on the minimization of the RMSE and the SE associated with the parameters, the maximization of the adjusted R 2 and the less number of interfering factors) was selected. Studies were considered as fixed factors in the models because experimental conditions and methods are specific to each study and could influence the study effect. This strategy has no impact on the statistical effect of the covariate (Sauvant et al., Reference Sauvant, Schmidely, Daudin and St-Pierre2008). The range of inference for this meta-analysis is, therefore, limited to the domain of the specific experiments in the dataset (Sauvant et al., Reference Sauvant, Schmidely, Daudin and St-Pierre2008). When the study effect was not considered, it was specified in the results. All statistical analyses were carried out using Minitab (Version 17). The normality of residuals was checked and outliers were identified on the basis of residues, HI leverage, Cook’s distance and DFITS, as in Loncke et al. (Reference Loncke, Ortigues-Marty, Vernet, Lapierre, Sauvant and Nozière2009c and Reference Loncke, Nozière, Bahloul, Vernet, Lapierre, Sauvant and Ortigues-Marty2015).
Determination of factors influencing the response equations
To explore the causes of heterogeneity between studies, all the factors which potentially altered the relationships between X and Y variables were considered and tested as interfering factors on the model parameters (residuals, individual within-study slopes and least-squares means (LSMeans)) as in Loncke et al. (Reference Loncke, Nozière, Bahloul, Vernet, Lapierre, Sauvant and Ortigues-Marty2015). This recognizes the non-random character of some of the variability present in the data and evaluates a ‘true’ within-study response. The impact of qualitative factors (analytical methods, blood or plasma concentration, physiological state and animal species) was tested by one way ANOVA. The impact of quantitative factors (nutrient and hormonal concentrations and fluxes as available, intake level and diet composition) was established by regression between model parameters and potential quantitative interfering factors. Only the significant interfering factors are reported.
Optimization of the response equations
When an interfering factor had been detected as significant and if not correlated to the main explanatory variable X, the benefits of adding it as another X variable to the model were evaluated on the fit (Sauvant et al., Reference Sauvant, Schmidely, Daudin and St-Pierre2008; Loncke et al., Reference Loncke, Nozière, Bahloul, Vernet, Lapierre, Sauvant and Ortigues-Marty2015). If improvement was not significant, the interfering factor was excluded from the final response equation. The model was considered stable when the optimization analyses showed no more significant interfering factors on slopes, residuals and LSMeans or no significant improvement of fit. Parameters and correlations were considered significant at P ≤ 0.05, whereas 0.05 < P ≤ 0.10 indicated a trend. The RMSE was considered low when lower than 15% of the mean value of the predicted variable. This contributed to the good fit of the model.
Results
Description of the meta-design
Data were normally distributed and variances were homogenous in the different datasets. Differences in intake, dietary composition and fluxes of nutrients were greater between physiological status (non-productive adults, growing, gestating or lactating animals; Table 1) than between species (bovine or ovine; P < 0.001). As a result, the physiological status was included in the models, and interpretation accounted for the confounding effects of diet intake and composition, and animal species. Differences in intake and dietary composition and fluxes of nutrients according to species are however detailed in Supplementary Material S4 and Supplementary Material Tables S3a and b.
Table 1 Description of animals (non-productive, growing, gestating or lactating ruminants) and diets used for the meta-analysisa
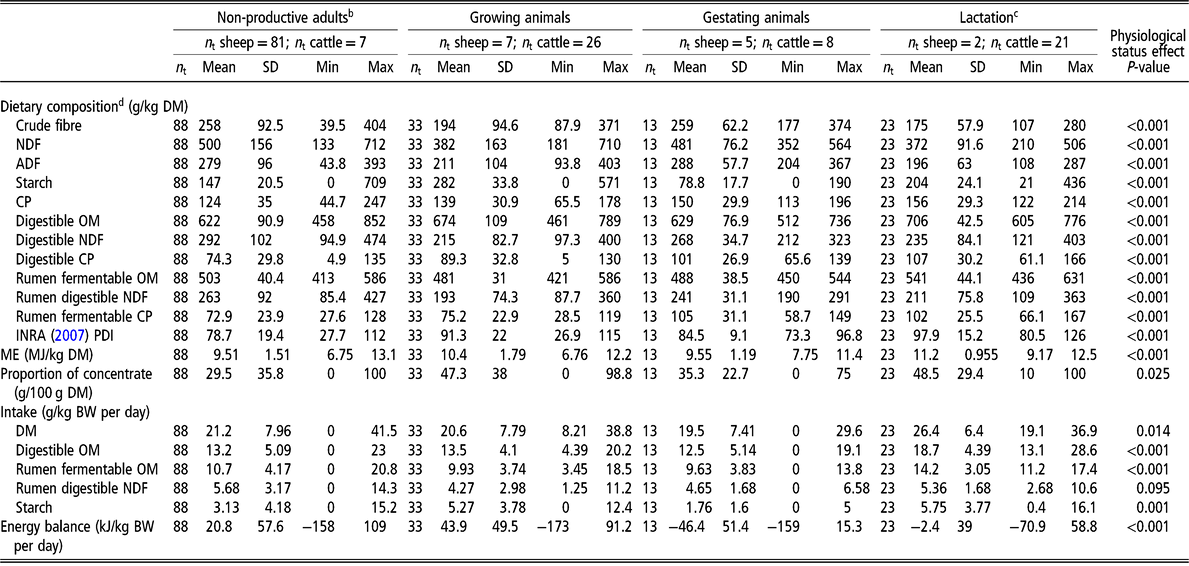
Min = minimum value; Max = maximum value; n t = number of treatments; OM = organic matter; ME = metabolizable energy.
a See the list of publications used in the meta-analysis in Supplementary Material S2.
b Fasting included.
c Dairy cattle were between 11 and 240 days in milk.
d Dietary composition and intake calculated by additivity according to INRA Feed Tables (INRA, 2007); PDI = protein digestible in the intestine, defined as the minimum between protein digestible in the intestine when energy is limiting and protein digestible in the intestine when nitrogen is limiting.
The potential contribution of precursors to net hepatic release of glucose averaged 51.4 ± 19.9%, 40.4 ± 27.3% and 23.5 ± 23.8% for propionate, α-amino-N and l-lactate, respectively, with large differences between physiological statuses (Table 2). Average values showed a general excess of C from total precursors, except in gestating and lactating animals. The amount of mobilized glycerol was estimated at 1.59 ± 1.26 mmol/kg BW per h and the average amount of alanine mobilized from muscles was estimated at 0.092 ± 0.073 mmol C/kg BW per h (n = 32, Table 2). Accuracy of these calculated values could not be evaluated due to the lack of published data. Out of the analytical methods tested, only the pAH analysis significantly influenced the relationships (Supplementary Material S3 and Table S2).
Table 2 Description of the reported nutrient arterial concentrations, net hepatic fluxesa and potential contribution to gluconeogenesis in ruminants used for the meta-analyses according to physiological status

Min = minimum value; Max = maximum value; n t = number of treatments; ND = not determinated.
a A positive value indicates a net release; a negative value indicates a net uptake.
b Fasting included.
c The dairy cattle were between 11 and 240 days in milk.
d Physiological status effect.
e Values are reported only for animals in negative energy balance.
Net hepatic uptake of propionate, l-lactate and α-amino-N
Comparison of models using net portal appearance or afferent fluxes as predictor
Quantitatively, NPA contributed to 85.8 ± 6.1% (propionate), 4.8 ± 1.7% (α-amino-N) and 15.4 ± 6.3% (l-lactate) of the hepatic afferent flux. For propionate, net hepatic uptake was similarly related to NPA and afferent flux. By contrast, for total amino acids and l-lactate net hepatic uptake was better related to NPA than to afferent flux (Figure 1v. Figures 2 and 3; Supplementary Material Table S4). As a result, the subsequent meta-analysis considered NPA as the X variable.

Figure 1 Within-study relationships between the net hepatic uptake of propionate (a), α-amino-N (b) and l-lactate (c) and their total hepatic afferent flux in ruminants. The propionate (a), α-amino-N (b) and l-lactate (c) datasets were used.

Figure 2 Within-study relationships between net hepatic uptake and net portal appearance of propionate (a for raw data and b for adjusted model) and α-amino-N (c for raw data and d for adjusted model) in ruminants. The propionate (a, b) and α-amino-N (c, d) datasets were used. Adjusted models are shown for non-productive adults (◯), growing animals (△), lactating cattle (•) and gestating animals (▴).

Figure 3 Within-study relationships between net hepatic uptake of l-lactate and net portal appearance of l-lactate (a for raw data, and b for adjusted model), and energy balance (c for adjusted model); and between net hepatic release of glucose and its net portal appearance (d for raw data, e for adjusted model) in ruminants. The l-lactate (a, b, c) and glucose (d, e) datasets were used. Adjusted models are shown for non-productive adults (◯), growing animals (△), lactating cattle (•) and gestating animals (▴).
Models
The net hepatic uptake of propionate, α-amino-N and l-lactate increased linearly with their net absorption in the portal vein (P < 0.01, Table 3). For propionate and α-amino-N, average intercepts were not significantly different from zero. The linear slopes suggested that for 1 mmol/kg BW per h appearing in portal vein, 0.910, 0.749 and 0.474 mmol/kg BW per h of propionate, α-amino-N (corresponding to a slope of 0.536 for total amino acids) and l-lactate were taken up by the liver, respectively.
Table 3 Response equations of the net hepatic fluxes (NHFs, mmol/kg BW per h) of propionate (C3), α-amino-nitrogen (αN) and l-lactate to variations in their net portal appearance (NPA, mmol/kg BW per h) and energy balance (EB, kcal/kg BW per day) in ruminants

NS = not significant (P > 0.10); RMSE = residual means square error; X = explanatory variable; LSMeans = least-squares means; EB = energy balance; PDI = protein digestible in the intestine; gluc = glucose; dOM = dietary concentrations of digestible organic matter; ME = metabolizable energy.
All models were based on reported measured fluxes.
†P < 0.10; *P < 0.05; **P < 0.01; ***P < 0.001.
a n exp: number of experimental groups in the model; n αi: number of experimental groups with αi (intercept for the experimental group i) significantly different from zero; n t: number of treatments in the model; n r: number of treatments rejected from the model (outliers).
b PHY: physiological status, effects of physiological status were detected on the intercept (Model 1, Δ = −0.0005 (NS), 0.032, −0.026 (P = 0.06), −0.0061 (NS); Model 2, Δ = −0.0584, −0.0009 (NS), 0,161, −0,104; Model 5, Δ = −0.1149, 0.0442, 0.0707, ND), on the slope (Model 3, Δ = −0.507, 0.333 (NS), −0.174 (NS), ND) for the non-productive adults, growing animals, lactation and gestation, respectively.
c No interfering factors were observed on individual slopes and residuals; these are interfering factors on the LSMeans: the minus sign indicates a negative effect on the net hepatic flux; the plus sign indicates a positive effect on the net hepatic flux.
Interfering factors
Table 3 reports the significant interfering factors and Supplementary Material Table S5 reports the linear relationships between LSMeans and interfering factors. For propionate (model 1, Figure 2a and b) and at similar NPA of propionate (LSMeans effect), the net hepatic uptake increased with the energy balance of the animals (P < 0.01) and starch intake (P ≤ 0.05). For α-amino-N (model 2, Figure 2c and d) and at similar NPA of α-amino-N, net hepatic uptake increased (P > 0.05) with dietary N concentration (CP and protein digestible in the intestine) and net hepatic release of glucose (P ≤ 0.05), and decreased with the net hepatic uptake of propionate (P ≤ 0.05). When introduced in the model as additional covariates, none of those factors significantly improved the fit. For l-lactate (model 3, Figure 3a and b) and at similar NPA of l-lactate, the net hepatic uptake was significantly affected by propionate uptake. Inclusion of propionate uptake as a covariate significantly improved the model, removing all interfering factors (model 4). To account for the role of lactate to recycle C, energy balance was also tested as an X variable, but did not improve the fit and showed significant interfering factors (model 5, Figure 3c).
Net hepatic release of glucose
Influence of the net portal absorption of glucose
The net hepatic release of glucose was quadratically related (P < 0.05) to its NPA (model 6, Table 4; Figure 3d and e), indicating that the net release of glucose decreased when NPA of glucose increased from −0.334 up to 0 mmol/kg BW per h, and increased thereafter.
Table 4 Response equations of the net hepatic release of glucose (Y variable) to the following X variables: net portal appearance (NPA) and net hepatic flux (NHF) of propionate (C3), total amino acids (tAA), l-lactate, glucose and sum of precursors (mmol C/kg BW per h) in ruminants

ND = not determined; NS = not significant (P > 0.10); RMSE = residual means square error; LSMeans = least-squares means; BHBA = beta-hydroxybutyrate; ME = metabolizable energy; αN = α-amino-nitrogen.
†P < 0.10; *P < 0.05; **P < 0.01; ***P < 0.001.
a n exp: number of experimental groups in the model; n αi: number of experimental groups with αi significantly different from zero; n t: number of treatments in the model; n r: number of treatments rejected from the model (outliers).
b PHY = physiological state effect, effects of physiological status were detected on the intercept (Model 6, Δ = −0.007 (NS), −0.045 (NS), 0.210, −0.158; Model 7, Δ = 0.276, −0.773, 0.497; Model 9, Δ = 2.336, 0.317 (NS), −3.023 (NS), 0.369 (NS); Model 10, Δ = 1.533, −0.583 (NS), −0.457, −0.492 (NS); Model 11, Δ = −0.907, −0.092 (NS), 1.512, −0.512 (NS); Model 12, Δ = −0.286, −0.345, 2.047, −1.416; Model 13, Δ = 2.676, 0.984 (NS), −3.661, ND; Model 14, Δ = −0.199 (P = 0.1), −0.341, 0.540, ND; Model 15, Δ = 2.478, −0.862, −1.615, ND), on the slope (Model 8, Δ = 0.237 (NS), 1.308, −0.934 (NS), −0.610 (NS); Model 9, Δ = −0.908, −0.059 (NS), 1.342, −0.374 (NS); Model 10, Δ = 1.157, 0.247 (NS), −2.070, 0.666 (NS); Model 13, Δ = −0.511, −0.129 (NS), 0.640, ND; Model 15, Δ = 0.573, −0.289, −0.285, ND) for the non-productive adults, growing animals, lactation and gestation, respectively.
c No interfering factors were observed on individual slopes and residuals: the minus sign indicates a negative effect on the net hepatic flux; the plus sign indicates a positive effect on the net hepatic flux.
d tAA fluxes calculating from α-amino-nitrogen fluxes according to Martineau et al. (Reference Martineau, Ortigues-Marty, Vernet and Lapierre2009).
e Percentage of estimated precursors : 30.6%, 29.6% and 31%, respectively, for models 13, 14 and 15.
Influence of the hepatic uptake of each precursor
Generally, the net hepatic release of glucose increased significantly and linearly with the availability of each precursor considered separately, in the portal vein (Table 4, models 7, 9, 11) and taken up by the liver (Table 4, models 8, 10, 12). Intercepts were generally significantly different from zero, indicating that glucose release also depends on other factors. At zero NPA of total amino acids, the uptake of total amino acids by the liver was higher with productive animals (growing and lactating) v. non-productive animals (P < 0.001, Table 4, model 9). At similar NPA of propionate (model 7, LSMeans effect, P = 0.001) the net hepatic release of glucose increased when the hepatic uptake of amino acids decreased, and when the hepatic release of β-hydroxybutyrate increased. No improvement of fit was gained when these factors were added in the model.
Influence of the hepatic uptake of the sum of precursors
When the all-precursor and the propionic infusion datasets were combined to evaluate the glucose response over a wide range of precursor supply, glucose release was curvilinearly related to precursor availability (Figure 4). In this combined dataset, the NPA of summed precursors ranged from 1.003 to 13.05 mmol C/kg BW per h (Figure 4a and b), while net hepatic uptake ranged from 1.098 to 9.944 mmol C/kg BW per h (Figure 4c and d). At similar precursor availability (LSMeans effect on both models), glucose release was increased when the net hepatic release of β-hydroxybutyrate increased (P < 0.05).

Figure 4 Within-study curvilinear relationships between net hepatic release of glucose and availability of summed precursors expressed as net portal appearance (a for raw data, b for adjusted model) and as net hepatic uptake (c for raw data, d for adjusted model) in ruminants. The combined all-precursor and propionic infusion datasets were used. Number of experimental groups (n exp) and number of treatments (n t) are given.
Another meta-analysis was conducted on the all-precursor dataset only, excluding the propionate infusion studies, to explore the more linear portion of the relationship. The NPA of summed precursors ranged from 0.994 to 9.69 mmol C/kg BW per h and was closer to the physiological range. A linear model (quadratic model not significant, results not shown) was applied and the net hepatic release of glucose increased by 0.809 mmol C/kg BW per h for each increment of the NPA of summed precursors (Table 4, model 13; Figure 5a and b) with a good adjustment (RMSE represented 13% of average release of glucose by the liver). The intercept was not different from zero (P < 0.001) suggesting no net glucose release in the absence of precursor supply. Both the intercept and the slope were significantly affected by physiological status indicating a higher net release of glucose from the same net portal absorption of precursors for lactating animals. At similar NPA of precursors (LSMeans effect), glucose release was increased when hepatic emission of β-hydroxybutyrate increased. Interestingly when the NPA of glucose was added as covariate in the model (Table 4, model 14), it had a negative impact (slope effect) of the net hepatic release of glucose. Finally, the net hepatic release of glucose increased linearly by 0.905 mmol C/kg BW per h for each increment in net hepatic uptake of precursors (in mmol C/kg BW per h; Table 4, model 15, Figure 5c and d), with a good adjustment (RMSE represented 10% of average release of glucose by the liver). Both the intercept and the slope were significantly affected by physiological status, indicating a higher conversion rate of precursors into glucose for productive animals (growing and lactating) v. non-productive adults.
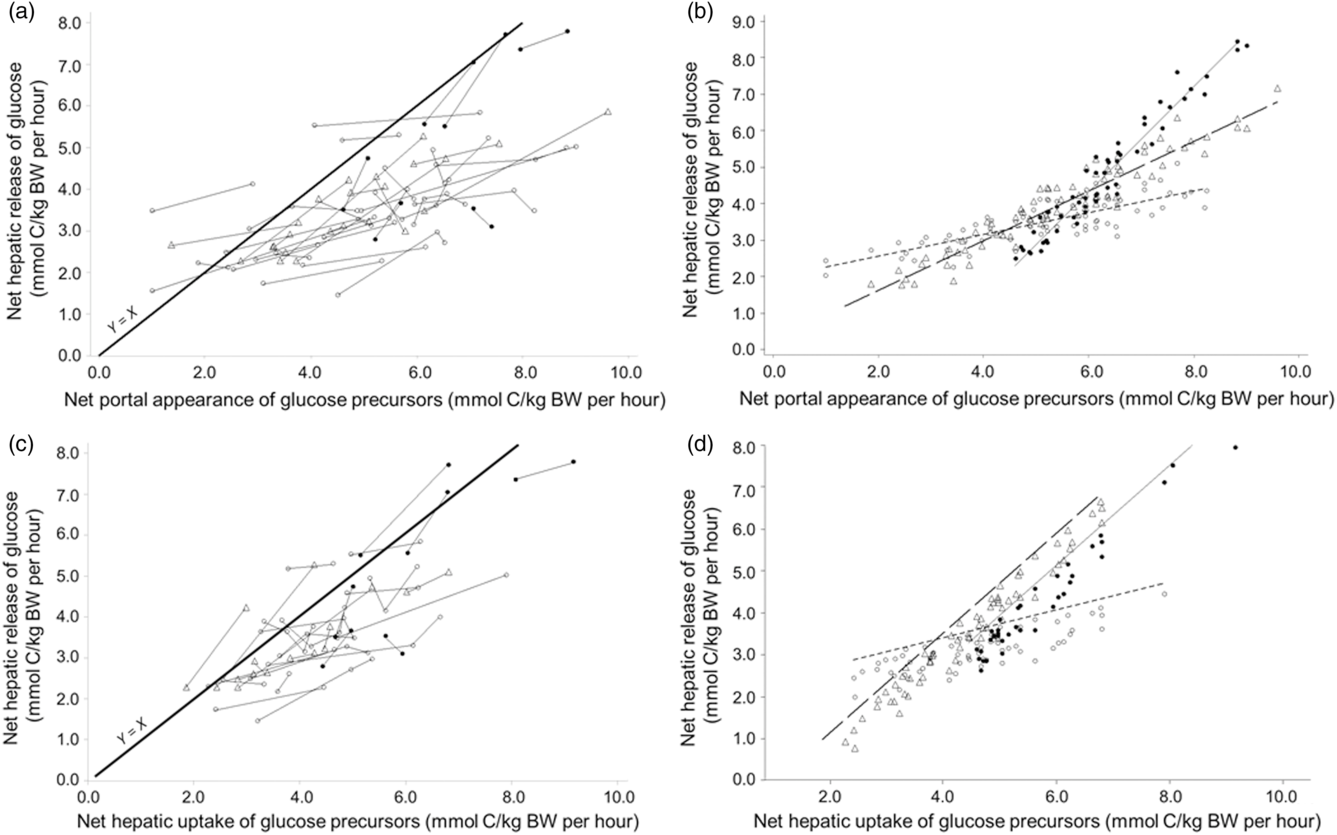
Figure 5 Within-study linear relationships between net hepatic release of glucose and availability of summed precursors expressed as net portal appearance (a for raw data, b for adjusted model) and as net hepatic uptake (c for raw data, d for adjusted model) in ruminants. The all-precursor dataset was used. Adjusted models are shown for non-productive adults (◯), growing animals (△), lactating cattle (•) and gestating animals (▴).
Net hepatic insulin fluxes
The insulin dataset was limited to n = 19 treatments. Arterial concentrations ranged from 6.3 to 71.9 μUI/ml and increased (intra-study slope) by 3.04 ± 0.36 μUI/ml per g DMI per kg BW per day (P = 0.004). The NPA of insulin also increased with intake (expressed in g/kg BW per day) by 1.31 ± 0.25 μUI/kg BW per h (P = 0.001, n t = 17) per g DM intake, by 9.81 ± 1.61 μUI/kg BW per h per g of starch digested in the small intestine (P = 0.01, n t = 8) and by 8.02 ± 1.43 μUI/kg BW per h per g NDF digested in the rumen (P = 0.001, n t = 17). Moreover, the NPA of insulin tended to increase with the portal – arterial concentration difference (in mM) of propionate (slope = 44.48 ± 20.16; P = 0.11, n t = 8) and acetate (slope = 10.82 ± 4.43; P = 0.09, n t = 8), but not glucose (P = 0.23). The net hepatic uptake of insulin increased with the NPA of insulin (slope = 0.49 ± 0.14, P = 0.01, n t = 17), the portal – arterial concentration difference of propionate (slope = 57.94 ± 6.60, P = 0.01, n t = 8) and with the NPA of glucose (slope = 27.65 ± 9.96, P = 0.05, n t = 16).
Discussion
The present work substantiates the use of the NPA, instead of total afferent fluxes, as the predictor for the net hepatic uptake of propionate, α-amino-N and l-lactate in a database like the one used in the current study where within-study variations were mainly caused by dietary changes and where lactating cow data were obtained at mid-lactation. The higher the contribution of NPA to the afferent flux, the lower the difference in fit between the two predictors. Obviously, the relevance of using the NPA as predictor depends on the nutrient and on the range of nutritional situations under study. As a result, for propionate, α-amino-N and to a lower extent for l-lactate their net hepatic uptakes follow mass action laws, with NPA as the main statistical driving force. The statistical driving force may differ from the biological one. This is especially the case for the amino acid fluxes, which are more accurate than the α-amino-N ones, and for animals that are not representative of this dataset. Indeed, when comparing cows pre- and post-calving, it was clear that increased net portal absorption of amino acids post-calving accompanying increased DMI was not related to increased hepatic net removal, the latter declining in response to decreased arterial amino acids concentrations related to the initiation of lactation (Doepel et al., Reference Doepel, Lobley, Bernier, Dubreuil and Lapierre2009). Also as a consequence of this statistical choice, endogenous l-lactate availability from mobilized tissues, as in early lactation, is not accounted for.
The within-study approach which was applied here focuses on incremental responses. It is testing the hypotheses that marginal changes in the X variables are inducing marginal changes in the Y variables of interest. This same strategy had also been applied to predict the net hepatic release of ketogenic nutrients by Loncke et al. (Reference Loncke, Nozière, Bahloul, Vernet, Lapierre, Sauvant and Ortigues-Marty2015). As a result, the study of the incremental supply of nutrients, which is primarily driven by daily intake and the related gut metabolism, is dissociated from the baseline levels of nutrient fluxes, which also depend on animal characteristics. It is compatible with the static models of feed evaluation systems which calculate daily rations for animals, irrespective of the amount of nutrients already circulating in the animal from previous rations as developed in Ortigues-Marty et al. (Reference Ortigues-Marty, Agabriel, Vernet, Sepchat, Al-Jammas and Nozière2019).
Domain of application of the models
Empirical prediction models apply to a strict range of validity. Because available data were balanced between cattle and sheep, models apply to both species. Species or physiological status significantly affected models of the present work, but as in Loncke et al. (Reference Loncke, Nozière, Bahloul, Vernet, Lapierre, Sauvant and Ortigues-Marty2015) it was not always possible to evaluate whether it was a strict species or physiological status effect, or if there was some confounding with nutritional conditions. These effects are discussed below for each nutrient. In all cases, using physiological status as a covariate was more discriminant than using species as in Loncke et al. (Reference Loncke, Nozière, Bahloul, Vernet, Lapierre, Sauvant and Ortigues-Marty2015) for ketogenic nutrients. This covariate also encompasses differences in the level of production. As for other models developed from the same Flora database (Loncke et al., Reference Loncke, Nozière, Vernet, Lapierre, Sauvant, Ortigues-Marty, Chilliard, Glasser, Faulconnier, Bocquier, Veissier and Doreau2009b and Reference Loncke, Nozière, Bahloul, Vernet, Lapierre, Sauvant and Ortigues-Marty2015), models apply to animals with intakes up to 41 g DMI/kg BW per day of diets varying from 0 to 100 g concentrate/100 g DM. They do not account for any feed additive effects (buffers, essential oils, ionophores, etc.) nor for lipid supplementation.
Out of the analytical methods considered, only pAH analysis and hence blood flow evaluation had a significant quantitative influence on the relationships (Supplementary Material S3). Acetylation of pAH was shown to result in overestimation of nutrient release and underestimation of nutrient uptake by Larsen and Kristensen (Reference Larsen and Kristensen2013) and Rodriguez-Lopez et al. (Reference Rodriguez-Lopez, Cantalapiedra-Hijar, Durand, Isserty-Thomas and Ortigues-Marty2014), except for amino acids uptake which was reduced. When considering marginal rates instead of absolute values, both release and uptake rates were overestimated by liver acetylation of pAH. Despite these effects, we decided not to correct nutrient fluxes in order not to introduce further uncertainties to the data besides those inherent to the measurements (Rodriguez-Lopez et al., Reference Rodriguez-Lopez, Feinberg, Durand, Cantalapiedra-Hijar, Thomas and Ortigues-Marty2016).
Hepatic uptake of individual precursors
Propionate
Results confirm the high hepatic uptake of propionate (Armentano, Reference Armentano1992). In the propionate dataset, no data exceeded the extraction capacity of the liver, propionate supply remained below levels obtained with infusions (e.g. Berthelot et al., Reference Berthelot, Pierzynowski, Sauvant and Kristensen2002) and portal propionate concentrations remained inferior to 1 mM. The intercept, not different from zero, was consistent with zero uptake in the absence of ruminal fermentations. The lowest hepatic uptake of propionate noted in growing animals was compatible with the known inhibitory effect of butyrate on propionate extraction (Berthelot et al., Reference Berthelot, Pierzynowski, Sauvant and Kristensen2002), as in the dataset hepatic supply and uptake of butyrate were elevated (Loncke et al., Reference Loncke, Nozière, Bahloul, Vernet, Lapierre, Sauvant and Ortigues-Marty2015).
l-Lactate
Hepatic uptake of l-lactate was related to two different types of predictors. First, amounts of l-lactate and propionate appearing in the portal vein, which reflect dietary nutrient supply and synthesis of l-lactate from glucose in gut tissues (van der Walt et al., Reference van der Walt, Baird and Bergman1983) that increases at high propionate levels (Harmon et al. Reference Harmon, Gross, Krehbiel, Kreikemeier, Bauer and Britton1991). Considering NPA of propionate as an additional predictor significantly improved the model (model 4 v. 3) and removed all interfering factors. We interpreted this improvement as the result of high propionate availability in the current dataset, and subsequently an increased hepatic conversion of propionate into l-lactate as shown in vitro by Demigné et al. (Reference Demigné, Yacoub, Morand and Rémésy1991).
Second, the energy balance which reflects the nutritional status of the animal and the recycling of C through the Cori cycle when animals are in tissue mobilization (Reynolds, Reference Reynolds2005). This predictor is relevant, even if there was no gain in precision probably because of uncertainties of estimations. It did not fully eliminate the effect of physiological status suggesting an effect of physiological status per se, as reported, for example, in transition cows with an increase in l-lactate removal by the liver and in its potential contribution to liver glucose synthesis immediately after calving (Benson et al., Reference Benson, Reynolds, Aikman, Lupoli and Beever2002; Reynolds et al., Reference Reynolds, Aikman, Lupoli, Humphries and Beever2003).
α-amino-N
The statistical mass action law which describes the impact of the portal appearance of α-amino-N on its net hepatic uptake (also observed by Lescoat et al. (Reference Lescoat, Danfaer and Sauvant1996) and Reynolds (Reference Reynolds, Sejrsen, Velplund and Nielsen2006)) strictly applies to α-amino-N as a proxy of the summed amino acids and does not apply to individual amino acids whose uptake is more related to their total afferent flux (Doepel et al., Reference Doepel, Lobley, Bernier, Dubreuil and Lapierre2009). Interestingly, the physiological and probably the underlying nutritional status of the animal (species, diet composition and intake, and level of production) influenced the baseline uptake (intercept) and not the marginal uptake rate (slope). Baseline net hepatic uptake (intercept) was higher in sheep than in cattle, probably reflecting lower production levels and lower tissue amino acid requirements (Blouin et al., Reference Blouin, Bernier, Reynolds, Lobley, Dubreuil and Lapierre2002; Reynolds, Reference Reynolds, Sejrsen, Velplund and Nielsen2006). In a meta-analysis with a different dataset from the same Flora database, Martineau et al. (Reference Martineau, Sauvant, Ouellet, Côrtes, Vernet, Ortigues-Marty and Lapierre2011) attributed the higher recovery of ingested nitrogen in the portal vein of sheep v. cattle to a strict species effect. It was assumed to result from lower amino acid losses through portal-drained viscera metabolism in sheep or from a more efficient nitrogen recycling at lower nitrogen intake (Martineau et al., Reference Martineau, Sauvant, Ouellet, Côrtes, Vernet, Ortigues-Marty and Lapierre2011 and Reference Martineau, Côrtes, Ortigues-Marty, Ouellet and Lapierre2014). Our results also showed that the average level of α-amino-N hepatic uptake (LSMeans) can be modified by the dietary N concentration, availability in propionate and hepatic glucose release. Direct experimental evidence was reported by Kraft et al. (Reference Kraft, Ortigues-Marty, Durand, Rémond, Jardé, Bequette and Savary-Auzeloux2011) who showed that a N deficient diet significantly limited the net hepatic uptake of α-amino-N, as a sparing mechanism, without modifying net glucose release (Loncke et al., Reference Loncke, Kraft, Savary-Auzeloux, Ortigues-Marty, Chilliard, Glasser, Faulconnier, Bocquier, Veissier and Doreau2009a).
Hepatic conversion of precursors into glucose
An interesting outcome of this work is to show that the net hepatic release of glucose increases linearly with the availability of summed precursors (portal appearance or hepatic uptake) up to approximately 6 mmol C/kg BW per h, beyond which the conversion rate decreases. In the present dataset, the highest levels of precursor supply were met by intra-gastric infusion of individual nutrient (e.g. Majdoub et al., Reference Majdoub, Vermorel and Ortigues-Marty2003). Whether it is the high level of precursor supply or the imbalanced nutrient supply (as in Kraft et al., Reference Kraft, Ortigues-Marty, Durand, Rémond, Jardé, Bequette and Savary-Auzeloux2011 with N deficient diets) which is responsible for this plateau would remain to be confirmed. This reduced efficiency of hepatic conversion of precursors into glucose suggests a supply of precursors in excess of glucose demand.
When considering a smaller range of summed precursor (i.e. excluding propionate infusion studies only) availability, the precursor C was converted to glucose at a rate (slope) ranging from 0. 64 to 0.81 fold its net portal supply or 0.91 fold its hepatic uptake. Conversion rates remained below 1 and were subject to the influence of physiological status probably indicating some regulation in the conversion of precursors into glucose by the demand for glucose as discussed by Lapierre et al. (Reference Lapierre, Galindo, Lemosquet, Ortigues-Marty, Doepel, Ouellet and Crovetto2010). At equal NPA of precursors (LSMean effect), the net release of glucose by the liver was higher for dairy cattle and lower for non-productive and growing animals, confirming the higher whole body glucose turnover rates observed for high v. low producing animals fed at similar metabolizable energy intake (Wilson et al., Reference Wilson, De Leuw and De Haan1983; Ortigues-Marty et al., Reference Ortigues-Marty, Vernet and Majdoub2003). The impact of physiological status was also noted on the conversion rate of propionate into glucose (slope) which was highest for dairy cattle and lowest for growing animals (effect on intercept) as previously pointed out (Reynolds et al., Reference Reynolds, Aikman, Lupoli, Humphries and Beever2003).
Our results showed that for a same supply of precursors, the conversion of precursor C into glucose (LSMeans effect on model 13) and the conversion of portally absorbed propionate into glucose (model 7) increase when β-hydroxybutyrate uptake increases. They suggest increased glucose release when body reserves are mobilized as suggested by Loncke et al. (Reference Loncke, Nozière, Vernet, Lapierre, Sauvant, Ortigues-Marty, Chilliard, Glasser, Faulconnier, Bocquier, Veissier and Doreau2009b), that is, animals in negative energy balance are more efficient in synthesizing glucose from precursors than when in positive energy balance. An increased conversion rate of precursors into glucose can be hypothesized because no increased contribution of endogenous precursors is expected as discussed above and reviewed by Larsen and Kristensen (Reference Larsen and Kristensen2013).
Current results clearly show that bypass starch will limit the hepatic release of glucose reducing the conversion of precursors into glucose. The general relationship with precursor supply as well as the curvilinear relationship with NPA of glucose clearly demonstrated it. The supply of 117 g of bypass starch, equivalent to an NPA of 100 mmol glucose, will decrease the net hepatic release of glucose by 61 mmol of glucose, implying a substitution rate of 61% (model 14). Two mechanisms may be considered. First, starch intake also provides additional propionate, and the higher the propionate supply, the lower the propionate conversion rate into glucose as discussed above and the lower the net hepatic uptake of other precursors. Second, insulin/glucagon regulations might be involved. At negative NPA of glucose, that is, when bypass starch intake is null or low (lower than ≈1.7 g/kg BW per day, or lower than ≈200 g starch/kg DM, Loncke et al., Reference Loncke, Ortigues-Marty, Vernet, Lapierre, Sauvant and Nozière2009c), precursor (mostly propionate; Majdoub et al., Reference Majdoub, Vermorel and Ortigues-Marty2003) absorption enhances hepatic insulin clearance and thereby the inhibitory effect of insulin on gluconeogenesis, possibly by reducing the entry of precursors in the gluconeogenesis pathway (Aschenbach et al., Reference Aschenbach, Kristensen, Donkin, Hammon and Penner2010). At positive NPA of glucose, direct effects of insulin at hepatic level are unlikely because hepatic extraction of insulin was not modified by the NPA of glucose. Instead regulations may involve changes in the insulin/glucagon ratio (Brown and Allen, Reference Brown and Allen2013). This ratio is curvilinearly affected by starch intake, and it decreases as a result of increased glucagonemia when the dietary starch concentration is higher than 160 g/kg DM (Garnsworthy et al., Reference Garnsworthy, Lock, Mann, Sinclair and Webb2008). In lactating dairy cows, glucose supply to the animal will indeed increase with glucose absorption (Reynolds, Reference Reynolds2005).
Insulin
Insulin is an important regulator of hepatic metabolism of glucose and its precursors. Unfortunately, insulin net flux data were scarce, and it was a deliberate choice not to fully develop quantitative response models. It was also not possible to include it as additional covariate. However, the within-study response equations were sufficiently reproducible to draw useful conclusions. Individual nutrients have different insulino-secretory effects. Insulin secretion, reflected by its NPA, increased with the intake level and absorption (portal – arterial concentration difference) of propionate and acetate. The insulino-secretory effect of propionate shown experimentally by intra-abomasal (Casse et al., Reference Casse, Rulquin and Huntington1994) or intra-ruminal (Majdoub et al., Reference Majdoub, Vermorel and Ortigues-Marty2003) infusions was almost seven times higher than that of acetate. The latter may not be a physiological regulator (Harmon, Reference Harmon1992). Furthermore, the sites of action of insulin may vary in relative terms with the nature of absorbed nutrients. On average, 49 ± 14% of the NPA of insulin was taken up by the liver. But the hepatic clearance of insulin increased with the availability in volatile fatty acids (NPA), more specifically in propionate and butyrate (portal – arterial concentration difference), confirming experimental evidence for propionate (Majdoub et al., Reference Majdoub, Vermorel and Ortigues-Marty2003). This phenomenon is specific to the ruminants (Harmon et al., Reference Harmon, Gross, Krehbiel, Kreikemeier, Bauer and Britton1991; Harmon, Reference Harmon1992). It suggests a proportionally greater action of insulin on liver functions, as compared to other tissues, when propionate and butyrate availability is high. By contrast, a positive NPA of glucose had no influence on the hepatic clearance of insulin, explaining why peripheral insulinaemia is more responsive to glucose than to volatile fatty acids (propionate) absorption and suggesting a proportionally greater action of insulin on tissues such as the adipose tissues and the muscles, as compared to the liver. This confirms that physiological levels of volatile fatty acids, especially propionate, and glucose differentially regulate insulin secretion, hepatic clearance and peripheral insulinaemia (Harmon, Reference Harmon1992; Gualdron-Duarte and Allen, Reference Gualdron-Duarte and Allen2018).
In conclusion, glucose synthesis in the ruminant liver is tightly regulated. It does not strictly respond to precursor availability according to a single mass action law. Individual precursors are taken up by the liver in proportion of their availability but their uptake varies with the availability of other precursors. Also the rate of conversion of precursors into glucose is not fixed. Net glucose release varies curvilinearly with supply and uptake of precursors by the liver, suggesting a law of diminishing returns when precursor availability is in excess of glucose requirements. The linear portion of the response provides quantitative indications of the impacts of glucose demand, net portal absorption of glucose and negative energy balance on the net hepatic glucose release. These relationships can be linked with the predictions of portal absorption of nutrients from intake and dietary characteristics, and thereby provide indications of glucose synthesis from dietary and animal characteristics.
Acknowledgements
The authors thank Neovia and Limagrain as well as the Association Nationale de la Recherche et de la Technologie for partly funding this project. This work was part of the Ph.D. thesis of the first author, C. Loncke.
C. Loncke 0000-0001-5551-8542
Declaration of interest
None.
Ethics statement
This meta-analysis study on published data did not require ethical approval.
Software and data repository resources
The Flora database has been deposited at the Agence pour la Protection des Programmes, 249 rue de Crimée, 75019 Paris, France, IDDN.FR.001.380017.000.R.P.2010.000.10300. Authors are open to collaborations.
Supplementary material
To view supplementary material for this article, please visit https://doi.org/10.1017/S1751731119003410


 Open access