


Implications
Here we show that an increase in herbage allowance during the gestation–lactation cycle improves the cows’ metabolic status, liveweight, body condition score, calves’ weight, changes cows’ grazing and ruminating behaviours and results in greater cow–calf attachment, linking cows’ nutritional status with grazing and maternal behaviour. Policymakers and cow–calf systems managers can integrate these findings into grazing management practices to improve animal production, welfare and resilience to climatic variability.
Introduction
Cow–calf systems of the Campos region base their production in native grasslands (Ministerio de Ganadería Agricualtura y Pesca, 2013; Asociación Argentina de Consorcios Regionales de Experimentación Agrícola, 2015). The high variability in herbage production in addition to a low herbage allowance (HA; DM herbage mass/ha to stocking rate in liveweight (LW)/ha relationship) management (Do Carmo et al., Reference Do Carmo, Claramunt, Carriquiry and Soca2016) results in prolonged periods of low energy intake, which explains the historically low pregnancy rates (65%; MGAP, 2013; AACREA, 2015) and calves’ weight records (140 kg; Berretta et al., Reference Berretta, Risso, Montossi, Pigurina, Lemaire, Hodgson, de Moraes, Nabinger and Carvalho2000).
An appropriate HA management might help attenuate the negative energy balance that takes place primarily during the final third of gestation and early lactation in beef cows (Claramunt et al., Reference Claramunt, Fernández-Foren and Soca2018; Do Carmo et al., Reference Do Carmo, Sollenberger, Carriquiry and Soca2018). The increase in HA from 2.5 to 4.5 kg DM/kg LW during the gestation–lactation cycle increased pregnancy rates and calves’ weaning weight and was associated with greater body condition score (BCS) and metabolic status (Laporta et al., Reference Laporta, Astessiano, López-Mazz, Soca, Espasandin and Carriquiry2014). It has also been shown that temporary suckling restriction (TSR) with nose plates and dietary flushing (2 kg/day of whole-rice bran for 22 days), a low-cost and easily implementable technique, at the start of the breeding season improved pregnancy rates during the first month of the breeding season in primiparous cows (Soca et al., Reference Soca, Carriquiry, Keisler, Claramunt, Do Carmo, Olivera, Rodriguez and Meikle2013).
Herbage allowance management affected grazing behaviours via changes in herbage structure in beef heifers (Da Trindade et al., Reference Da Trindade, Pinto, Neves, Mezzalira, Bremm, Genro and Carvalho2012 and Reference Da Trindade, Neves, Pinto, Bremm, Mezzalira, Nadin and Carvalho2016). The latter studies showed that an increase in HA from 4 to 12 kg DM/100 kg LW per day (≈1.1 to 3.4 kg DM/kg LW) was associated with an increase in DM intake, reduction in grazing time and consequent LW gains. In beef cows, there is scarce information regarding HA effects on ingestive behaviour. An increase in HA from 2.5 to 5 kg DM/kg LW in multiparous beef cows reduced daily grazing time and increased ruminating time, which were associated with a better energy status, BCS and productive and reproductive response (Do Carmo et al., Reference Do Carmo, Claramunt, Carriquiry and Soca2016).
The cow’s energy status might be reflected in maternal behaviour changes, which in turn might explain calves’ LW gains. Several parameters have been proposed to determine maternal behaviour; the mother–offspring physical distance has been associated with their attachment (Price et al., Reference Price, Martinez and Coe1985; Vitale et al., Reference Vitale, Tenucci, Papini and Lovari1986). A greater physical distance is indicative of a weak mother–offspring attachment; the time spent by the calves ≈15 m away from their dam increased with calves’ age, reflecting independence from their mothers (Vitale et al., Reference Vitale, Tenucci, Papini and Lovari1986). To our knowledge, no prior studies have evaluated the effect of beef cows’ nutritional status on maternal behaviour.
The objective of this study was to evaluate the effect of HA during an annual cycle on primiparous beef cows’ nutritional status, endocrine signals and grazing and maternal behaviour achieved through TSR and flushing at the beginning of the breeding season. Temporary suckling restriction and flushing at the beginning of the breeding season change cows’ nutritional and metabolic status, increasing insulin and IGF-1 (Soca et al., Reference Soca, Carriquiry, Claramunt, Ruprechter and Meikle2014), and might change grazing and maternal behaviour. Primiparous beef cows were used as they have additional energy requirements for growth compared to multiparous cows. Thus, regarding energy use, primiparous beef cows give relatively greater priority to maternal survival. We expected that an increase in HA would improve metabolic status, reduce grazing and cow–calf physical distance and increase ruminating and idling.
Material and methods
The study covered 76 to 150 days post-calving period (−10 to 70 days from the initiation of TSR) of a grazing experiment, which evaluated the effect of two HA from the second trimester of gestation until weaning (−150 to 195 days relative to calving) in primiparous beef cows. The experiment was conducted on 92 ha of Campos grassland (Berretta, Reference Berretta2006) at Facultad de Agronomía Salto, Universidad de la República (31°23’ S, 57°18′ W). The soils and botanical composition of the experimental site, details on weather parameters and aboveground net primary production (ANPP) during the studied period, as well as the experimental design, treatments and cow management have been previously reported (Claramunt et al., Reference Claramunt, Fernández-Foren and Soca2018). Briefly, 45% of the experimental area had soil depths <30 cm, which results in low rainfall retention that affects ANPP during spring and summer droughts. Monthly rainfall and ANPP during the current study were 45% and 35% below the historical averages (120 mm/month and 17 kg DM/ha per day) from spring up to the last summer month respectively, while the daily average temperatures were above (37.5°C v. 35°C) historical averages.
Experimental design and treatments
A completely randomized block design study was conducted in two blocks, where two HA treatments were applied. The blocks were a spatial replication and took into account differences in the proportion of shallow soils. Herbage allowance was calculated as the DM herbage mass/ha to stocking rate in LW/ha relationship (Sollenberger et al., Reference Sollenberger, Moore, Allen and Pedreira2005), and fluctuated throughout the seasons, as follows: autumn 5 and 3 kg DM/kg LW; winter 3 and 3 kg DM/kg LW; spring and summer 4 and 2 kg DM/kg LW, for high and low HA, respectively (high = 4 and low = 2.5 kg DM/kg LW of annual mean). To simulate the winter conditions of low HA in Campos, treatments were adjusted to an equal and low HA during winter. The put-and-take method (Mott and Lucas, Reference Mott and Lucas1952) was used monthly to change the stocking rate to adjust the HA, based on the cows’ LW, paddock herbage mass, plus the estimated herbage production obtained from previous local records (Berretta, Reference Berretta2006). Herbage production was not included in the HA adjustment during the drought period. Cows of the same breed, physiological status and similar LW as the experimental cows were added or removed to change the stocking rate and adjust the HA. These cows and their calves were not used in the animal measurements. Changes in stocking rates for the HA adjustments were carried out 10 days before behavioural observations, thereby avoiding short-term interferences via animal interactions.
Animals and management
Thirty-three pregnant Hereford cows (high HA, n = 20; low HA, n = 13) were blocked by initial LW, BCS and gestational age and allocated to HA treatments. Cows entered in autumn (−150 ± 12 days relative to calving) and were maintained in the experimental paddocks throughout the year until weaning (195 ± 12 days relative to calving) in a continuous grazing system. Calves’ gender and LW were registered the morning following birth. Cows were exposed to tested bulls for 80 days at 96 ± 12 days postpartum. Temporary suckling restriction and flushing were applied as was previously described by Claramunt et al. (Reference Claramunt, Fernández-Foren and Soca2018). Briefly, 10 days prior to the introduction of the bulls, TSR was applied using nose plates (Walmur Ltda, Montevideo, Uruguay) on calves for 12 days (Soca et al., Reference Soca, Carriquiry, Keisler, Claramunt, Do Carmo, Olivera, Rodriguez and Meikle2013). A nose plate is a physical barrier that prevents nursing but does not interfere with grazing, eating or drinking. During the first 22 days of the breeding season, cows were supplemented (dietary flushing) each morning with 2 kg (fresh basis) per cow per day of whole-rice bran (86.5% DM, 13.5% CP, 44% neutral detergent fibre, 13.5% ether extract). A trained observer verified that the cows ingested the supplements each day. The day of initiation of TSR was considered day 0 of the experiment (86 ± 12 days relative to calving). Figure 1 presents a schematic representation of measurements throughout the experiment related to TSR and flushing.
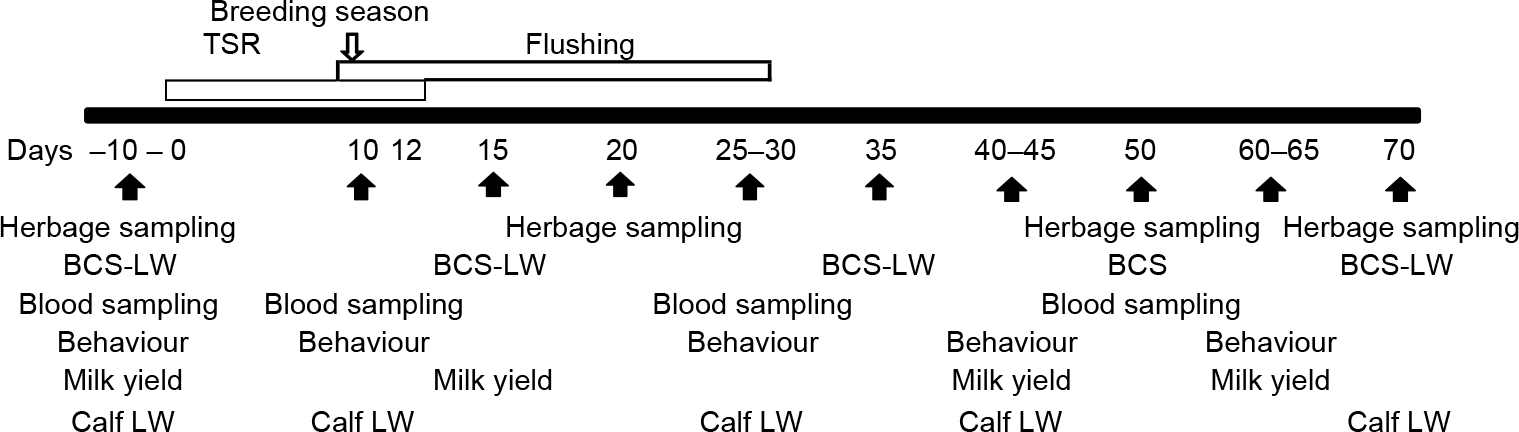
Figure 1 A schematic representation of measurements throughout the experiment related to temporary suckling restriction (TSR) and flushing applied on primiparous beef cows. The black horizontal bar represents the days relative to the initiation of TSR. Calves’ TSR and flushing (open rectangle) with whole-rice bran were applied from 0 to 32 days relative to the initiation of TSR. BCS = body condition score; LW = liveweight.
Herbage measurements
Herbage mass (kg DM/ha) was assessed at −10, 20, 50 and 70 days relative to the initiation of TSR via the comparative yield method (Haydock and Shaw, Reference Haydock and Shaw1975). A five-point visual scale was established, and three similar 0.3 × 0.3 m quadrats per each point of scale were selected, as was described by Claramunt et al. (Reference Claramunt, Fernández-Foren and Soca2018). In each quadrat, herbage height was measured as the average height of five random measurements, and then herbage was cut at ground level. Herbage samples were dried in a forced air oven at 60°C to obtain the DM of herbage mass. The DM of herbage mass and height was related to the visual scale. One hundred or 150 visual estimations of herbage mass were assessed based on the visual scale for low and high HA, respectively. The proportion of dead herbage mass and bare soil was determined visually by a trained observer. In a previous study (Claramunt et al., Reference Claramunt, Fernández-Foren and Soca2018), we analysed herbage metabolizable energy, neutral detergent fibre and CP of a composited sample of the present study. Herbage allowance did not affect herbage metabolizable energy (8.5 MJ/kg), neutral detergent fibre (61.3%) and CP (10.7%) during this period.
Cows’ body condition score and liveweight
Cows’ BCS were assessed on days −10, 0, 15, 35, 50 and 70 relative to the initiation of TSR by one trained observer throughout the study using a 1–8 unit visual score for Hereford beef cows (Vizcarra et al., Reference Vizcarra, Ibañez and Orcasberro1986). Cows’ LW was assessed on days −10, 0, 15, 35 and 70 using an electronic weighing scale and was determined early in the morning without fasting.
Cows’ blood sampling and hormone determination
Sixteen and 13 of the high and low HA cows were selected, respectively, and blood samples were taken prior to TSR (day 0 = 86 ± 12 days relative to calving), at TSR (day 10), during flushing (day 30) and at day 52 relative to calving. The samples were collected via jugular venipuncture using heparinized tubes and centrifuged (2000×g for 15 min at 4°C) within 3 h after collection. The plasma was stored at −20°C until assayed. Plasma samples were assayed in the Laboratory of Animal Endocrinology and Metabolism, Veterinary Faculty (Montevideo, Uruguay). Insulin was determined using a commercial immunoradiometric assay kit (DIAsource ImmunoAssays S.A., Nivelles, Belgium). The assay sensitivity was 5.3 µUI/ml. Intra-assay CVs for control 1 (18.0 µUI/ml) and control 2 (63.5 µUI/ml) were 6.9% and 5.9%, respectively. Inter-assay CVs for the same controls were 7.0% and 7.3%, respectively. Insulin-like growth factor-1 was determined using an immunoradiometric assay of a commercial kit (IGF1-RIACT Cis Bio International, Gif-sur-Yvette Cedex, France). Sensitivity of the assay was 0.41 ng/ml. Intra-assay CVs for control 1 (55 ng/ml) and control 2 (370 ng/ml) were 6.0% and 5.7%, respectively. Inter-assay CVs for the same controls were 6.4% and 7.7%, respectively. Leptin concentrations were determined via a liquid-phase radioimmunoassay using a commercial Multi-Species Leptin kit (RIA kit; Millipore, Cat XL-85K) previously reported in bovines. Sensitivity of the assay was 4.2 ng/ml. Intra-assay coefficients of variation for low (7.4 ng/ml) and medium (26.9 ng/ml) controls were 19.8% and 9.6%, respectively. Inter-assay coefficients of variation for low and medium controls were 22.0% and 9.2%, respectively.
Cows’ grazing behaviour
A subsample of 16 cow–calf pairs (n = 4 per HA × block) with similar initial (−150 days relative to calving) BCS (high HA = 5.6 ± 0.55; low HA = 5.5 ± 0.4 units of BCS), LW (high HA = 402 ± 34; low HA = 398 ± 34 kg), calving date (high HA = 20-august ± 6 days; low HA = 21-august ± 4 days) and equal calf gender ratio (male : female = 5 : 3) were selected for behaviour assessment and milk yield measurements.
Cow–calf pairs were observed individually during two consecutive days at −5, 10 (corresponding to TSR), 28 (corresponding to flushing), 45 and 60 days from the initiation of TSR from 0715 h to 2000 h (period in which sunlight enabled the identification of behaviours) at 10-min intervals. Observations were made by two trained observers who switched between treatments in each observation day. Binoculars were utilized, and cow–calf pairs were numbered individually in the flanks with painted colours to facilitate individual recognition. The following behaviours were recorded in cows: grazing (biting or chewing the herbage, and walking searching for herbage), ruminating, idling (lying or standing without any activity) and walking (Gibb, Reference Gibb, Keane and O’Riordan1998). A visual observation did not allow the measurement of activities during the night. However, it was reported that diurnal grazing represents a percentage between 65 and 100 of total daily grazing time in beef cattle (Krysl and Hess, Reference Krysl and Hess1993). Moreover, studies in beef cows during summer nights in Campos region reported that night grazing represents 16%–19% of daily time and was not affected by HA in a 3-year study (Scarlato, Reference Scarlato2011).
Milk yield, cow–calf physical distance and calves’ liveweight
On days −10, 15, 45 and 65, milk yield via the suckle weight method was determined. Calves were isolated from their dams at 2000 h. At 0700 h and 1600 h of the following day, calves were weighed prior to and after they were allowed to suckle their dam until satiety or for 30 min (Neville, Reference Neville1962). The AM and PM records were extrapolated to a 12-h basis and averaged to estimate daily milk yield. In each grazing behaviour observation, the cow–calf pair physical distance was determined by recording when the distance was greater than six cows’ body length (BL; adapted from Vitale et al., Reference Vitale, Tenucci, Papini and Lovari1986; Hötzel et al., Reference Hötzel, Ungerfeld and Quintans2010).
Calves’ LW was assessed on days −10, 0, 10, 25, 40 and 70 relative to the initiation of TSR. It was determined early in the morning without fasting.
Statistical analysis
All data were analysed using the SAS Systems program (SAS Institute Inc., Cary, NC, USA). Herbage variables, cows’ and calves’ LW, BCS, milk yield and endocrine profiles were analysed by repeated measures using the MIXED procedure with days (days from the initiation of TSR) as the repeated effect. The statistical model included HA and day as fixed effects, block as a random effect, and the HA × day interaction. The analysis of cows’ response variables included calving date as covariates.
The daily proportion (number of daily observations of each behaviour/total number of daily observations) of each behaviour variable (grazing, ruminating, idling, walking and cow–calf physical distance) was fit based on a general linear model using the GLIMMIX procedure. The analysis assumed a binomial distribution, and Logit was used as the link function. The models included HA and day as fixed effects, block and day of observation as a random effect, and the HA × day interaction.
The experimental unit was the paddock and the cow–calf pair for herbage and animal parameters, respectively. The covariance matrix for each response variable was selected based on the lowest Akaike information criterion in the MIXED procedure and Pearson χ2/degrees of freedom in GLIMMIX. Initial analyses included all factors and interactions, but non-significant interactions were not presented. Effects were considered statistically significant at P ≤ 0.05 and P values between >0.05 and ≤0.10 as a trend. Data were expressed as least square means ± SE and compared using the Tukey–Kramer test.
Results
Herbage mass and height, dead herbage and bare soil
Herbage mass was affected by day and HA × day interaction (Table 1), as a steeper decay at day 50 after the initiation of TSR could be observed in low HA compared than high HA (Figure 2a). Herbage height and dead herbage were affected by days, while bare soil was not affected by HA, days, or HA × day (Table 1). Herbage height declined from −10 to 50 days and then increased at 70 days (Figure 2b), while dead herbage reflected the inverse pattern (15.2%, 22%, 5.5% ± 3% dead herbage for −10, 50 and 70 days, respectively).
Table 1 Effects of herbage allowance (HA); day and their interactions with herbage mass, height, dead and bare soil; cows’ liveweight (LW); body condition score (BCS); insulin; IGF-1 and leptin concentrations; proportion (prop.) of diurnal time allocated to grazing, ruminating, walking and idling; milk yield; prop. of diurnal observations of cow–calf pairs at a physical distance greater than six cows’ body length; and calves’ LW
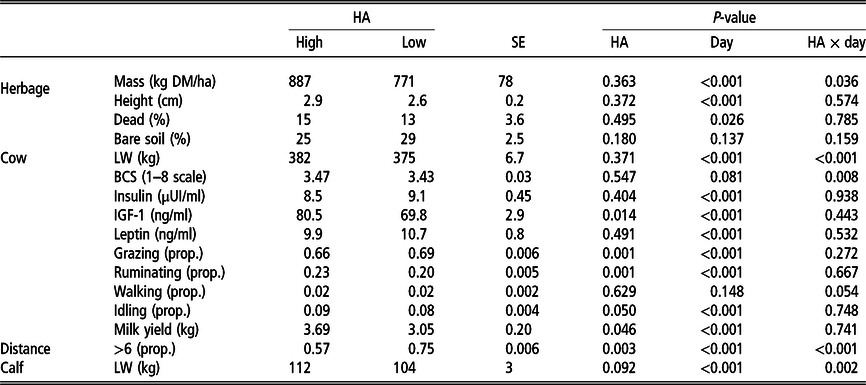
Least square means ± pooled SEs of the study period are presented. High and low HA corresponded to 4 and 2.5 kg DM/kg LW annual HA, respectively.
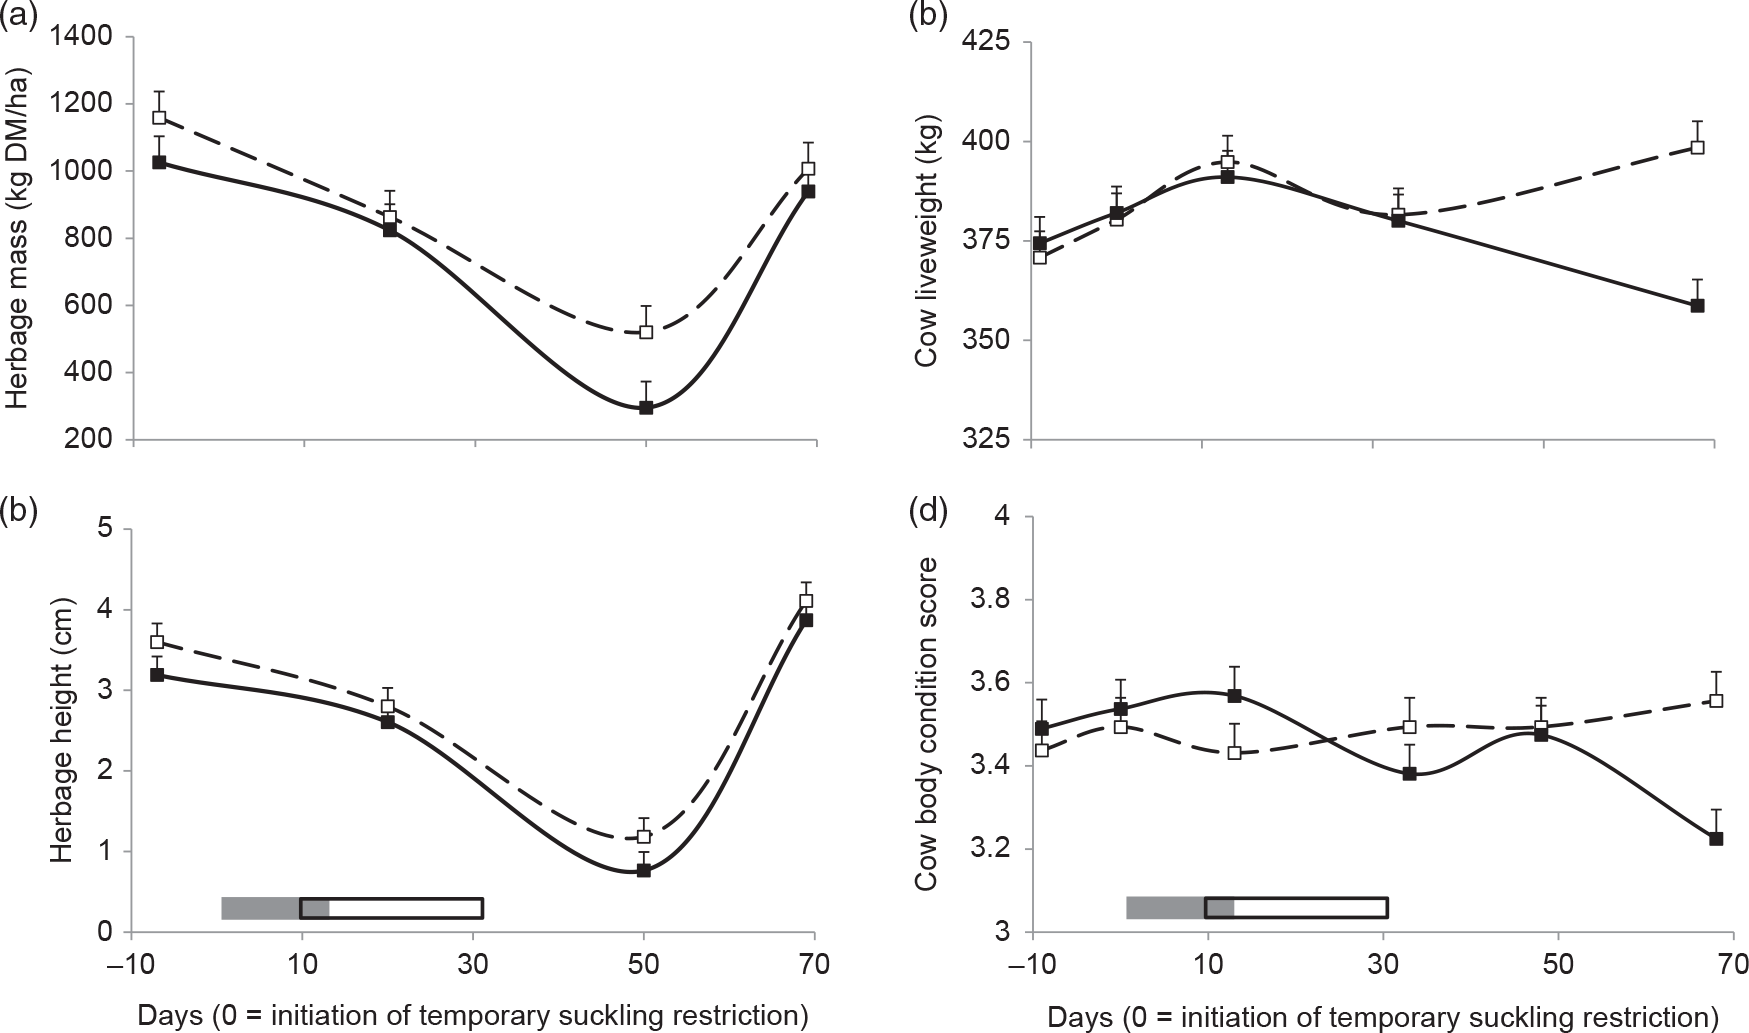
Figure 2 Herbage mass (a), height (b), and cows’ liveweight (LW) (c) and body condition score (BCS) (d) for high (dashed lines and open squares) and low (solid lines and black squares) herbage allowance (4 and 2.5 kg DM/kg LW annual average, respectively). Least square means ± SEs are presented. Calves’ temporary suckling restrictions (grey rectangle) and flushing (open rectangle) with whole-rice bran were applied from 0 to 32 days relative to the initiation of suckling restriction.
Cows’ liveweight, body condition score and metabolic hormones
Cows’ LW and BCS were affected by HA × day (Table 1). Liveweight increased from −10 to 15 days and decreased at 35 days in both treatments, and then increased in high HA cows at 70 days, while decreasing in low HA (Figure 2c). Body condition score reflected a similar pattern than LW (Figure 2d).
Insulin concentrations were affected by day (Table 1), increasing throughout the period of 10 to 50 days (Figure 3a). Insulin-like growth factor-1 was greater in high HA compared to low HA and was affected by day (Table 1). Its concentrations increased during TSR, decreased at 30 days and then remained stable until the end of sampling (Figure 3b). Leptin concentrations were only affected by day (Table 1) and decreased at 50 days (Figure 3c).
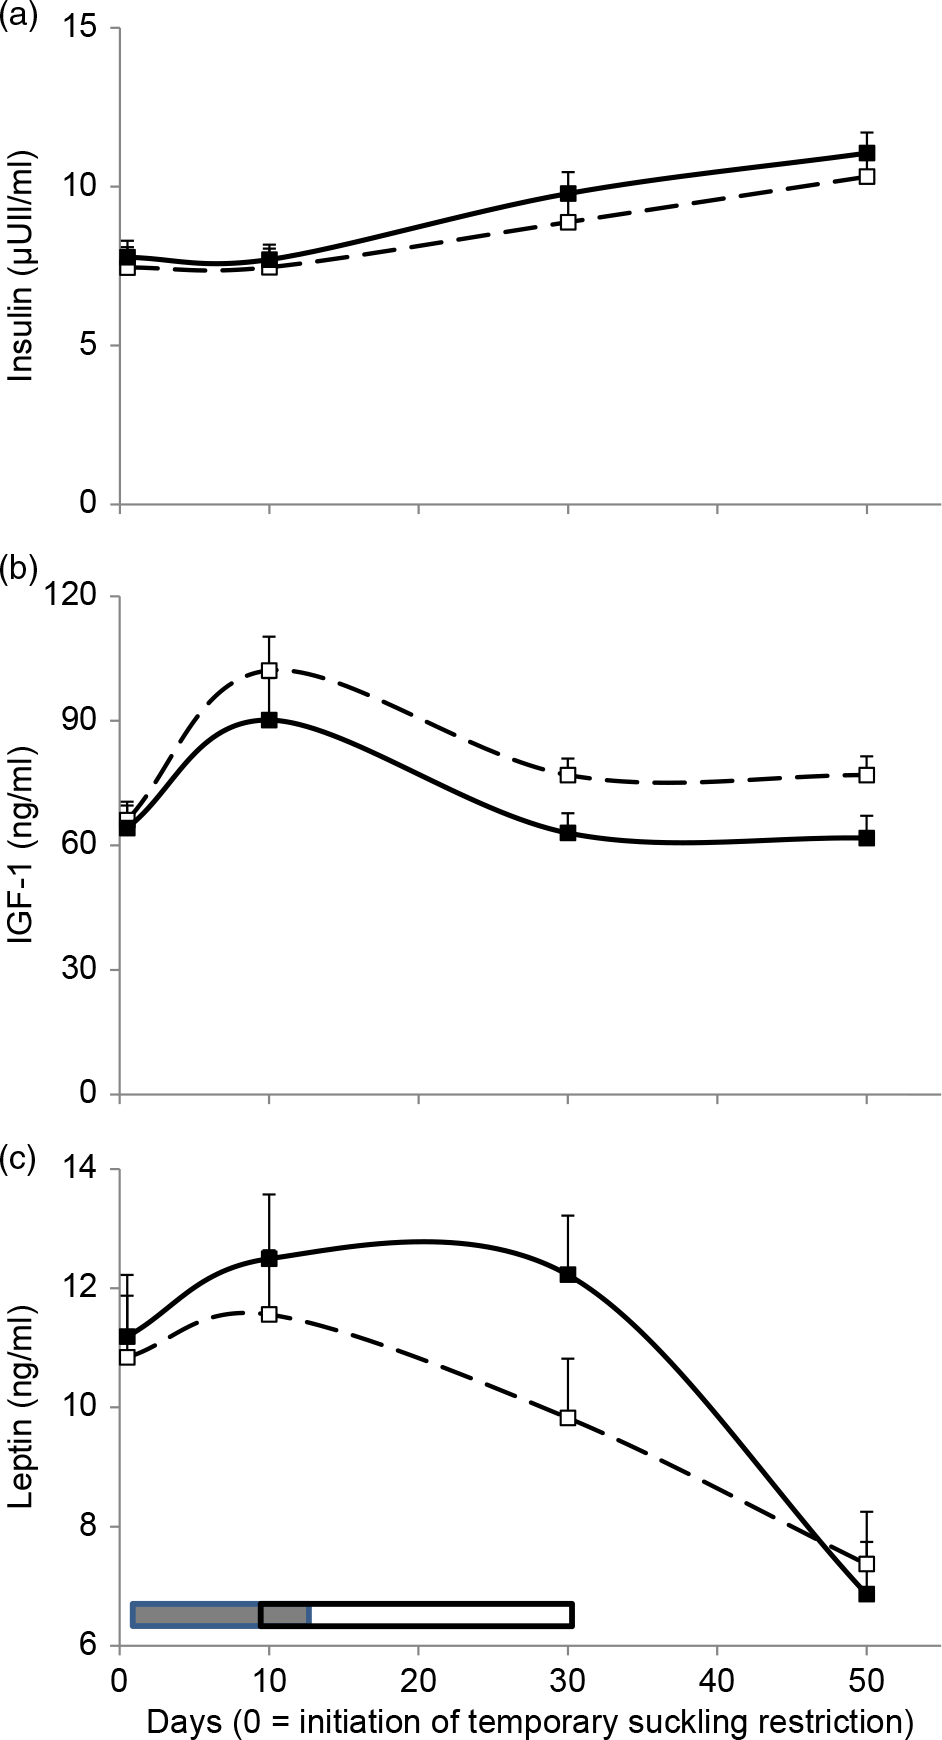
Figure 3 Cows’ insulin (a), IGF-1 (b) and leptin (c) concentrations for high (dashed lines and open squares) and low (solid lines and black squares) herbage allowance (4 and 2.5 kg DM/kg liveweight annual average, respectively). Least square means ± SEs are presented. Calves’ temporary suckling restrictions (grey rectangle) and flushing (open rectangle) with whole-rice bran were applied from 0 to 32 days relative to the initiation of suckling restriction.
Grazing behaviour
Grazing, ruminating and idling proportions were affected by HA and days (Table 1).
Grazing proportion was lower in high HA compared to low HA (Table 1) and, in both groups, decreased from −5 to 30 days after the initiation of TSR and then increased from 30 to 60 days (Figure 4a). When Tukey–Kramer tests were conducted, a significant difference was found at day 30, in which high HA cows presented lower grazing proportion than low HA cows (P < 0.05).
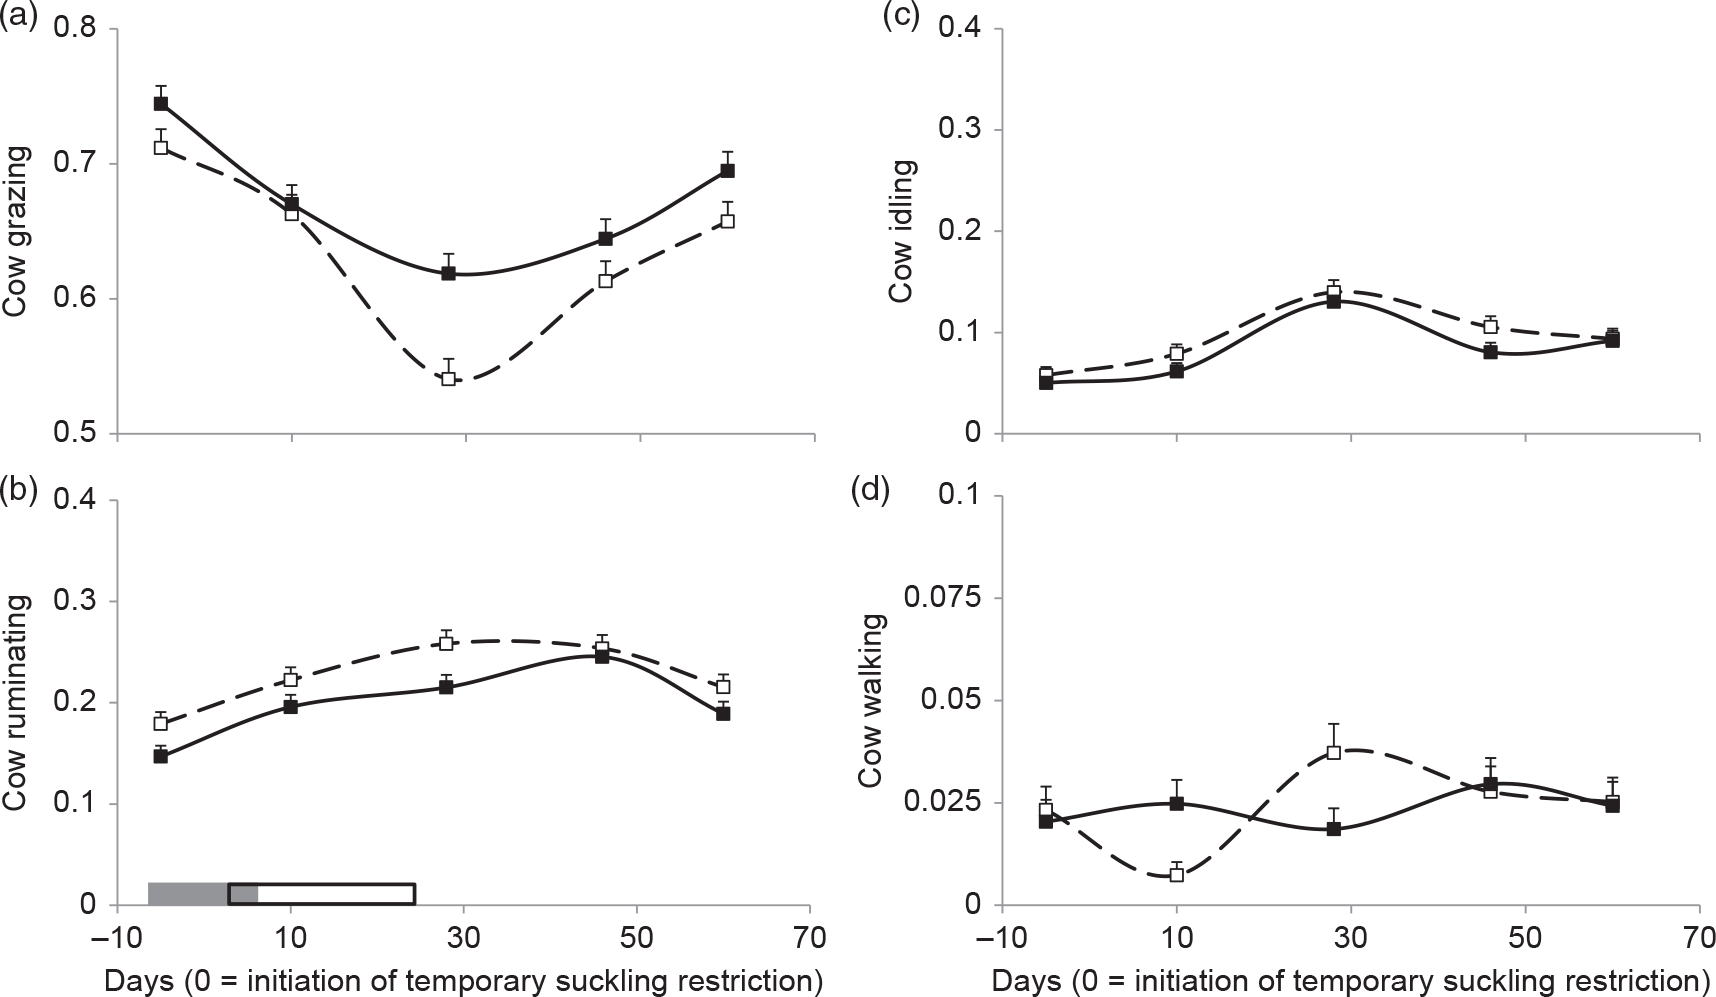
Figure 4 Cows’ (a) grazing, (b) ruminating, (c) idling and (d) walking proportion for high (dashed lines and open squares) and low (solid lines and black squares) herbage allowance (4 and 2.5 kg DM/kg liveweight annual average, respectively). Least square means ± SEs are presented. Calves’ temporary suckling restrictions (grey rectangle) and flushing (open rectangle) with whole-rice bran were applied from 0 to 32 days relative to the initiation of suckling restriction (prior to temporary suckling restriction (day −5), temporary suckling restriction (day 10), flushing (day 30) and after flushing (days 45 and 60)).
Ruminating proportion was greater in high HA compared to low HA cows (Table 1). Ruminating increased from −5 until 30 days, remained stable at day 45 and then decreased at 60 days (Figure 4b).
An increase in idling behaviour was observed 30 days after the initiation of treatment (Figure 4c).
A tendency of HA × days interaction was found for walking (Table 1) as it decreased between −5 and 10 days and then increased at 30 days in high HA cows, while it remained stable in low HA cows (Figure 4d).
Milk yield, cow–calf physical distance and calves’ liveweight
Milk yield was affected by HA (Table 1), which was greater in high HA cows compared to low HA cows. Milk yield decreased from −1 to 20 days and then increased at 45 days (Figure 5a).
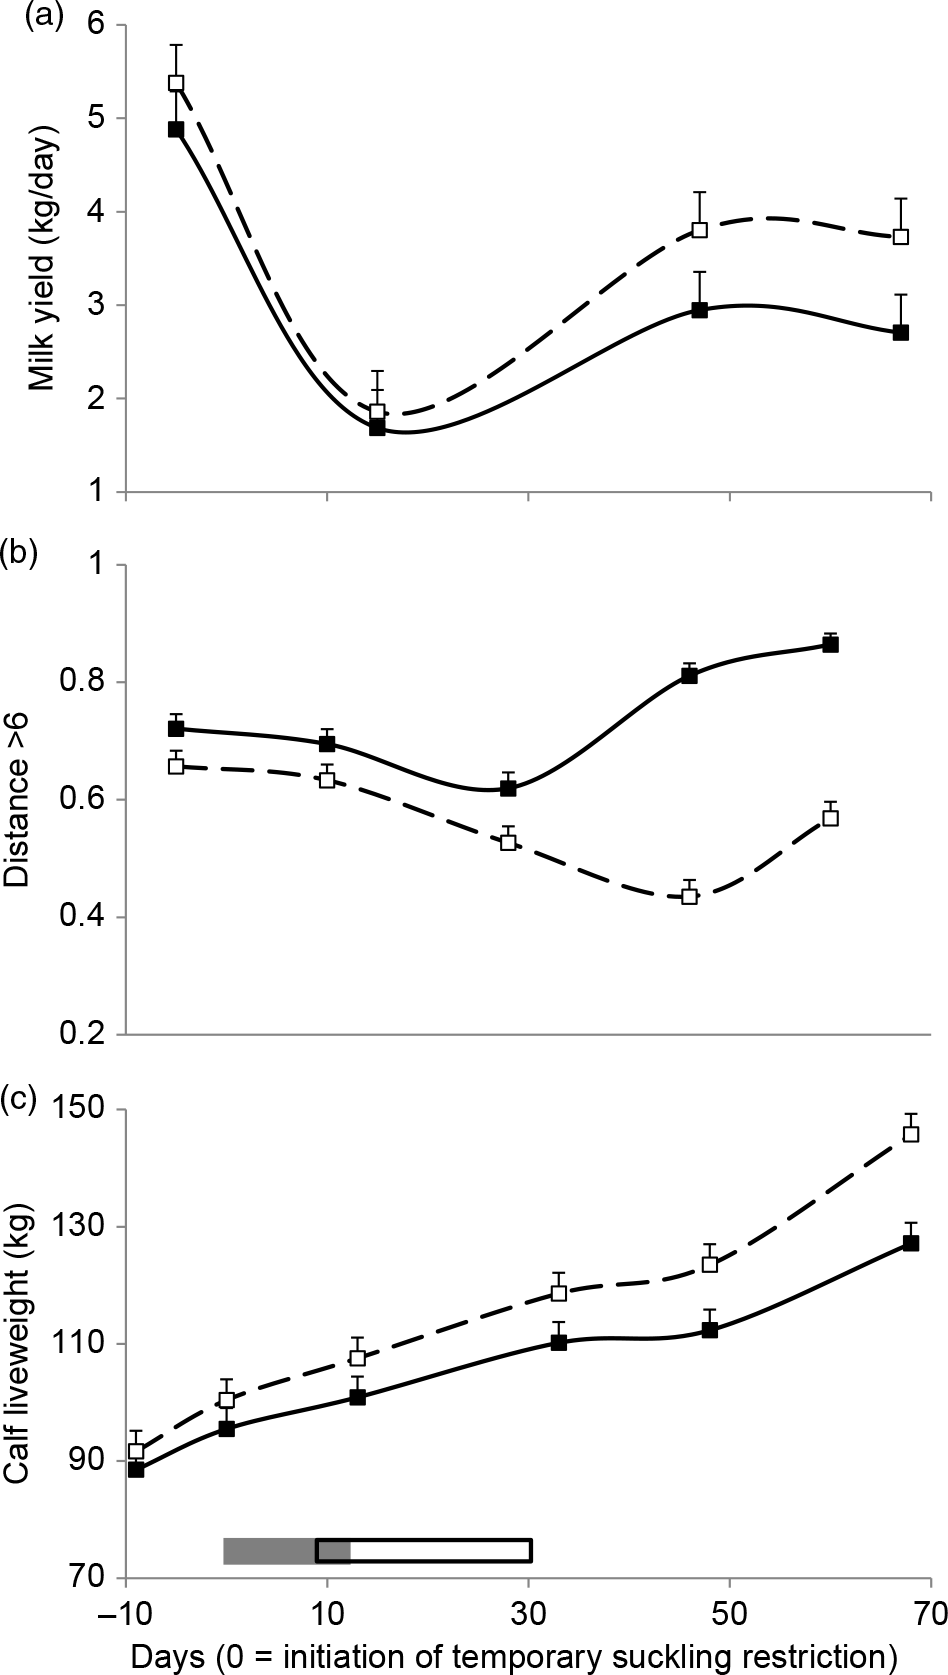
Figure 5 Milk yield (a), proportion of observations of cow–calf pairs at a distance greater than six cows’ body length (b), and calves’ liveweight (LW) (c) for high (dashed lines and open squares) and low (solid lines and black squares) herbage allowance (4 and 2.5 kg DM/kg LW annual average, respectively). Least square means ± SEs are presented. Calves’ temporary suckling restrictions (grey rectangle) and flushing (open rectangle) with whole-rice bran were applied from 0 to 32 days relative to the initiation of suckling restriction.
Cow–calf physical distance was affected by HA, days and their interaction (Table 1). The probability of observing the cow–calf pairs at a distance greater than six cows’ BL was lower in each observation in high HA compared to low HA (Table 1). In high HA, this distance decreased during 10 to 45 days and then increased at 60 days, while in low HA it decreased from 10 to 30 days and increased during 30 to 60 days (Figure 5b).
Calves’ LW along the trial tended to be affected by HA and was affected by day and HA × day interaction (Table 1). It did not differ between treatments from days −10 to 35 and was greater from 45 days in high HA compared to low HA calves until the end of the study (Figure 3c).
Discussion
To our knowledge, this is the first study to report the effect of HA on cows’ nutritional status, endocrine signals, grazing and maternal behaviour. High HA was associated with greater IGF-1 concentrations, cows’ and calves’ LW at the end of study, lower grazing and greater ruminating probabilities, and lower cow–calf physical distance.
Values of herbage mass, height, dead proportion and bare soil in both treatments describe a herbage structure that severely limits herbage intake, as reported previously for beef heifers grazing Campos grasslands (Da Trindade et al., Reference Da Trindade, Neves, Pinto, Bremm, Mezzalira, Nadin and Carvalho2016). Despite this, HA treatment and the differential herbage mass profile might explain the greater LW and BCS found in high HA cows at the end of study. These data are consistent with the anabolic role of IGF-1 (Etherton et al., Reference Etherton2004) and the greater IGF-1 concentrations found in high HA cows compared to low HA cows. As reported previously (Soca et al., Reference Soca, Carriquiry, Claramunt, Ruprechter and Meikle2014), IGF-1 concentrations increased during TSR as a result of a decrease in energy demands for milk production. The differential IGF-1 concentrations found among the groups might be the result of the ‘metabolic memory’ exerted by high HA during the second third of gestation (e.g., greater BCS in high HA cows; Claramunt et al., Reference Claramunt, Fernández-Foren and Soca2018). Similarly, Soca et al. (Reference Soca, Carriquiry, Claramunt, Ruprechter and Meikle2014) showed that IGF-1 response to TSR and flushing of primiparous beef cows was greater in those cows with greater BCS at calving. No treatment differences were found in insulin and leptin concentrations, suggesting reduced differences in energy intake between treatments. Insulin increase throughout the study might be a response to the milk yield reduction caused by TSR and an increase in energy intake via flushing (Soca et al., Reference Soca, Carriquiry, Claramunt, Ruprechter and Meikle2014).
Grazing proportion decreased during TSR, which was probably due to the reduction in energy requirements as a result of the reduction in milk yield. The even greater reduction in grazing during flushing is consistent with grazing behaviour studies of supplementation in beef steers and cows that showed a reduction in grazing time compared to unsupplemented animals (Krysl and Hess, Reference Krysl and Hess1993; Gekara et al., Reference Gekara, Prigge, Bryan, Schettini, Nestor and Townsend2001). The reduction in grazing proportion in our study might reflect the impact of metabolic status on cows’ ingestive behaviours. The reduction in grazing proportion could result in an attenuation of energy costs associated with locomotion and stress under conditions of low herbage mass and height (Cañas et al., Reference Cañas, Quiroz, León-Velarde, Posadas and Osorio2003). Also, the reduction in grazing proportion could allow an increase in rumination and idling, activities subordinated to grazing (Rook et al., Reference Rook, Huckle and Penning1994). For instance, the recorded values of rumination and idling proportion previous to TSR were lower compared to the nine studies in beef cows reviewed by Kilgour (Reference Kilgour2012), but increased from −10 to 30 days as grazing proportion was reduced. After 30 days, the grazing proportion increased probably as a result of restoration of milk yield after TSR, ending supplement intake during flushing and deterioration of herbage conditions. Overall, we propose that TSR and flushing exerted changes in cows’ grazing behaviour strategy and that such changes helped attenuate the restrictions imposed by the herbage structure.
A reduction in grazing proportion was more pronounced in high HA compared to low HA cows during flushing, while walking increased only in high HA cows, indicating that HA altered the cows’ grazing strategy when TSR and flushing were applied. Walking corresponded to breaks in the foraging sequence to change orientation to new grazing locations or to areas where the animals drink and rest between the main daily grazing bouts (Bailey and Provenza, Reference Bailey, Provenza, Prins and Van Langevelde2008). Therefore, the grazing strategy of lower grazing proportion and greater walking on day 30 might reflect a greater selection of grazing locations. Aharoni et al. (Reference Aharoni, Dolev, Henkin, Yehuda, Ezra, Ungar, Shabtay and Brosh2013) found a positive association of general activity, including walking, with diet quality in conditions of low herbage quantity and quality, as in our experiment. It is possible that high HA cows invested more in herbage selection behaviours compared with low HA cows by their better metabolic status and greater herbage mass and height. Furthermore, the lower grazing proportion might reduce grazing energy cost, while the increase in walking proportion did not compensate for the magnitude of reduction in grazing, and is an activity of lower energy cost per unit of time (Aharoni et al., Reference Aharoni, Dolev, Henkin, Yehuda, Ezra, Ungar, Shabtay and Brosh2013). Therefore, changes in grazing strategy might explain better energy status, greater IGF-1 concentrations and LW and BCS found in high HA cows at the end of the study.
To our knowledge, this is the first study reporting the effect of cows’ nutritional status on maternal behaviour of beef cows. Cow–calf distance greater than six cows’ BL (≈15 m) was higher in low HA than high HA in all observations, suggesting a greater cow–calf attachment in high HA. Accordingly, Price et al. (Reference Price, Martinez and Coe1985) and Vitale et al. (Reference Vitale, Tenucci, Papini and Lovari1986) reported an increase in cow–calf distance under a reduction in cow–calf attachment. During −5 to 30 days, we observed a decrease in cow–calf physical distance, a similar response when suckling restriction with nose plates was used in 6-month-old calves (Haley et al., Reference Haley, Bailey and Stookey2005; Hötzel et al., Reference Hötzel, Ungerfeld and Quintans2010). After flushing, cow–calf physical distance greatly increased in the low HA group, suggesting a weakening in cow–calf attachment that might be explained by a lower milk yield recovery and a lower nutritional status in cows. In addition to the lower milk yield, the weakening of cow–calf attachment could reduce other maternal provisions that improve the welfare of their offspring, such as allogrooming, information transfer, learning about food sources and protection (Ralphs and Provenza, Reference Ralphs and Provenza1999; Newberry and Swanson, Reference Newberry and Swanson2008). Therefore, low HA calves were under worse conditions to compensate milk intake reduction and constrains for herbage intake imposed via pasture characteristics.
A lower grazing proportion in high HA compared to low HA cows could be another factor contributing to a reduction in cow–calf physical distance, as greater grazing is positively associated with distance travelled and area explored by cows (Aharoni et al., Reference Aharoni, Dolev, Henkin, Yehuda, Ezra, Ungar, Shabtay and Brosh2013; Sawalhah et al., Reference Sawalhah, Cibils, Maladi, Cao, Vanleeuwen, Holechek, Black Rubio, Wesley, Endecott, Mulliniks and Petersen2016). Cow–calf distance increased after 30 days in low HA, while the increase in high HA started after 45 days. Cows in high HA had lower grazing proportion and better nutritional status during this period, together with greater milk yield, BCS and LW compared to low HA, resulting in differences in cow–calf attachment. These results indicate that HA affects cow–calf relationships via changes in grazing proportion and nutritional status, which likely contribute to differences between HA in calves’ weight gains.
Conclusions
High HA in primiparous beef cows with TSR and flushing increased IGF-1 concentrations, reduced grazing, increased rumination and idling proportions, and reduced cow–calf physical distance. Thus, a modification of nutritional status and endocrine signals in cows via HA management might result in a differential grazing and maternal behaviour that might contribute to milk yield and cows’ and calves’ productive responses.
Acknowledgements
The authors thank the staff of the Facultad de Agronomía in Salto, Carolina Martinicorena, Renzo Mazilli, Carlos Armand Ugon and Alvaro Villafán for animal care and assistance throughout the field stage of the study, and the staff of Laboratory of Animal Endocrinology and Metabolism of Facultad de Veterinaria for hormone analyses. This work was partially supported by FONTAGRO (FTG-RF-15461-RG).
Declaration of interest
Authors do not have any actual or potential conflict of interest – financial, personal or other relationships – with other people or organizations.
Ethics statement
This experiment received ethical approval from the Animal Experimentation Committee of the Universidad de la República, Uruguay.
Software and data repository resources
None of the data were deposited in an official repository


