


Across the globe, the shift from hunting and gathering to agriculture led to population growth. A developing literature characterizes that shift as a demographic transition comparable in certain respects to the current “industrial” demographic transition that began in Western Europe around AD 1800 (Bocquet-Appel Reference Bocquet-Appel2002, Reference Bocquet-Appel, Bocquet-Appel and Bar-Yosef2008, Reference Bocquet-Appel2011a, Reference Bocquet-Appel2011b; Gage and DeWitte Reference Gage and DeWitte2009). By the time the latter transition plays itself out in approximately AD 2100, it will have led to an expansion of the world's population from 1 billion to perhaps 9.5 billion over the course of 300 years (Lee Reference Lee2003:185). The Agricultural Demographic Transition (ADT)—also referred to as the Neolithic Demographic Transition (NDT)—likewise led to substantial population expansion during the Holocene. In terms of the sequence of change in demographic parameters, however, the ADT is envisioned as a mirror image of the Industrial Demographic Transition (IDT; Bocquet-Appel Reference Bocquet-Appel2011a). The trajectory of the IDT is a decrease in mortality followed by a decrease in fertility. The ADT is postulated instead to have involved an increase in fertility, followed by increased mortality.
The IDT has been a complex process—global in scope but fundamentally historical. Different societies have moved through a similar series of stages at different times. Yet, the stages have varied in character at different points in the overall historical trajectory—as suggested, for instance, by higher peak growth rates in less developed countries (where the demographic transition is more recent) than in more developed countries (where it started earlier) (Lee Reference Lee2003:Figure 4). The concept of the IDT originates in a descriptive model of observed trends in mortality, fertility, and population growth (Gage and DeWitte Reference Gage and DeWitte2009:650). Although it has proven to have considerable predictive power, it is fundamentally a synthesis of patterns rather than an explanation. Lee (Reference Lee2003:167–168) notes continuing uncertainties about the relevance and effects of different factors.
It is not self-evident that the ADT should be conceived of as a coherent global process. Worldwide, it unfolded over a much longer time than the IDT (~10,000 years compared to 300). The relevant crops varied considerably, as did the availability and use of domestic animals. Bocquet-Appel (Reference Bocquet-Appel2002, Reference Bocquet-Appel, Bocquet-Appel and Bar-Yosef2008, Reference Bocquet-Appel2011a, Reference Bocquet-Appel2011b) nevertheless argues that the ADT was a global process, repeated at different times in different world regions. His empirical case is based on distributions of ages at death in prehistoric human skeletal assemblages. Bandy (Reference Bandy2005, Reference Bandy, Bocquet-Appel and Bar-Yosef2008) adapted the approach for application to settlement pattern data from regional surveys. Our empirical focus in this article is on that alternative source of evidence.
We accept, as a working hypothesis, claims for the ADT as a global process, although we suspect that it unfolded in distinct ways in different times and places. In this article, we examine spatiotemporal variation in episodes of rapid population growth during the ADT of Mesoamerica and southwestern North America (including the U.S. Southwest and northwestern Mexico [henceforth “the Southwest”]; Figure 1). For understanding spatiotemporal patterns within these quasi-continental bounds, a crucial scale of analysis proves to be the “macroregion”—a unit that, although still quite large, is considerably smaller than the continental. “Regions” are valleys or other physiographically defined areas typically in the range of 100–2,000 km2, the range in scale of larger archaeological survey projects. “Macroregions” are bigger: areas of approximately 10,000–40,000 km2 consisting of several contiguous, historically connected regions (Balkansky Reference Balkansky2006; Kowalewski Reference Kowalewski2004; Schachner Reference Schachner2015).
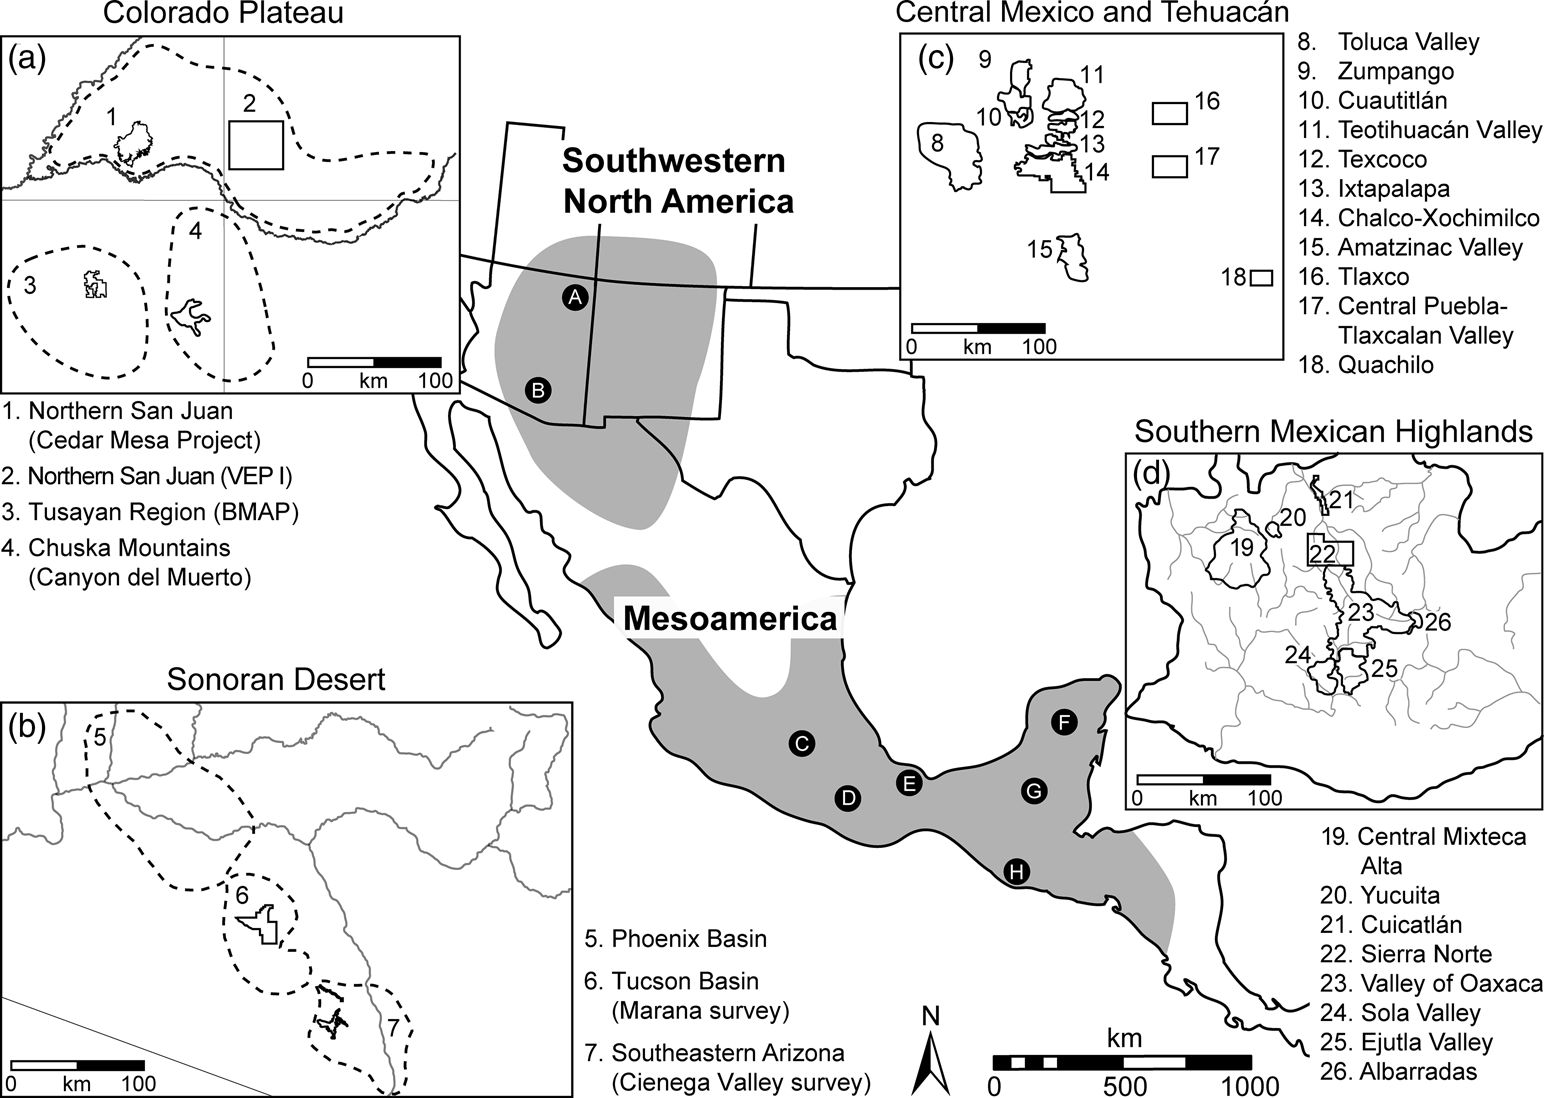
Figure 1. Mesoamerica and southwestern North America, with insets showing the locations of survey regions considered in this article. Macroregions mentioned in the text are identified by letter as follows: (A) Colorado Plateau; (B) Sonoran Desert; (C) Central Mexico; (D) Southern Mexican Highlands; (E) Southern Gulf Coast; (F) Northern Maya Lowlands; (G) Southern Maya Lowlands; (H) Southeastern Pacific Coast.
For exploring spatial patterns, the work of Peter Bellwood (Reference Bellwood2005, Reference Bellwood2013) provides a helpful point of departure. His work is less useful on the issue of temporal structure, however. Indeed, temporal patterning in the ADT needs to be discovered through empirical analysis. An analysis of published data from regional surveys suggests that in some parts of Mesoamerica and the Southwest there were two phases to the ADT, with different consequences in terms of the spatial distribution of population. We propose an idealized model of demographic history at the macroregional scale, consider its relevance for making sense of variation, and close with what we consider an important causal factor: the changing productivity of maize.
Spatial Structure
Based primarily on the European case, Bocquet-Appel (Reference Bocquet-Appel2002) hypothesized the large-scale spatial pattern of the ADT as a wave of advance. Such a scenario is not appropriate for cases in the Americas. Our starting point is instead Bellwood's (Reference Bellwood2005, Reference Bellwood2013) model of early farming dispersals.
Bellwood argues that the demographic success of subsistence systems oriented to food production converted regions of early agriculture into heartlands from which farmers migrated radially, pushing aside or incorporating surrounding hunter-gatherers. Expanding farmers brought their languages with them, leading to a global occurrence of language families with extensive distributions surrounding the original agricultural heartlands. The language distributions mark the persistent traces of expansions by farmers thousands of years before. Although Bellwood has focused on possible cases of very large-scale (quasi-continental) expansions, the model itself does not specify the spatial scale of these processes.
At first glance, the model seems difficult to apply to the Americas, but for Mesoamerica, at least, Bellwood (Reference Bellwood2005:237–244, Reference Bellwood2013:230–234) builds a plausible case. He acknowledges several steps in the development of food production and a mosaic pattern in the transition to the Formative, as documented by regional specialists (Rosenswig Reference Rosenswig2015). Crucially, Bellwood posits multiple agricultural heartlands within Mesoamerica—although he does not identify them precisely. Early farmers expanded from each of those but soon ran up against each other. It was mainly at the extremes of this network of interacting early farmers that there was potential for large-scale expansion. Based on the linguistic map, Bellwood identifies as candidates the broad distribution of Mayan languages across the Yucatán Peninsula and, much more dramatically, the extension of Uto-Aztecan languages from Central Mexico to the Southwest.
Both of those cases remain controversial. In the Maya area, specialists have debated whether the rapid appearance of pottery-using farming communities across the Northern Lowlands during the Middle Preclassic (1000–400 BC) was the result of in situ development or migrations of farmers from the Southern Lowlands (summarized by Bey Reference Bey, Matthews and Morrison2006:19–23; see also Supplemental Text 1, Note 1). Kaufman (Reference Kaufman, Aissen, England and Maldonado2017) thinks migrations played a role in the diversification of Mayan languages, but his glottochronological reconstructions place those during the preceramic second millennium BC—a scenario consistent with a recent isotopic study of human remains from southern Belize that found increasing dietary dependence on maize from 2700 to 2000 BC and full reliance on maize as a staple after 2000 BC (Kennett et al. Reference Kennett, Prufer, Culleton, George, Robinson, Trask, Buckley, Moes, Kate, Harper, O'Donnell, Ray, Hill, Alsgaard, Merriman, Meredith, Edgar, Awe and Gutierrez2020). Bellwood's idea that migrating farmers from western Mexico brought maize to the Southwest has rekindled a debate on the evolution of the Uto-Aztecan language family (e.g., Hill Reference Hill2012; Merrill Reference Merrill2012; Shaul Reference Shaul2014). We think that demic expansions of farmers did take place during the ADT in both Mesoamerica and the Southwest at scales at least up to that of the macroregion, but it is not our purpose here to enter into the linguistic debate.
Within Mesoamerica, an attractive aspect of Bellwood's model is that it envisions multiple, simultaneous expansions by early farmers speaking diverse languages. It is therefore consistent with both the complex subsequent linguistic map and the widely scattered appearance of ceramic-using villages from around 1900 BCFootnote 1 (Clark and Cheetham Reference Clark, Cheetham and Parkinson2002; Lesure Reference Lesure, Bocquet-Appel and Bar-Yosef2008)—the moment traditionally defined as the beginning of the Formative. Although there is no simple correspondence between Formative-era material culture and the conquest-era linguistic map, the scale at which languages of the same family cluster together is similar to macroregional patterns of coherence in material culture such as the area of Central Mexico to which Vaillant's figurine typology applies (Reyna Robles Reference Reyna Robles1971; Vaillant Reference Vaillant1930). Furthermore, it is at the macroregional scale that specialists have for decades discussed possible cases of demic expansion of agriculturalists during the Formative—for example, the expansion of farming villages to the north across Central Mexico from heartlands in present-day Morelos and the southern Basin of Mexico (Lesure et al. Reference Lesure, Wake, Borejsza, Carballo, Carballo, López and Guzmán2013; Sanders et al. Reference Sanders, Parsons and Santley1979:95–97). Such arguments have parallels in the Southwest with the movement of farmers from the southern deserts to the Colorado Plateau (Coltrain and Janetski Reference Coltrain and Janetski2019; Matson Reference Matson1991). In sum, at macroregional scales, we find evidence consistent with the processes postulated in Bellwood's model—including, in some cases, possible instances of demic expansion.
Temporal Structure
The simultaneity of postulated population expansions within Mesoamerica is one of the more attractive features of Bellwood's model. Yet, the most convincing archaeological cases for radial expansions of farmers (such as the Central Mexico case) date from 1000 BC and thereafter, whereas an expansion from the northern fringes of Mesoamerica to the Southwest would have occurred much earlier: maize farmers were present in the Sonoran Desert by 3000 BC (Vint Reference Vint and Vierra2018:79).
Instead of drawing on any existing model, we propose to develop an understanding of temporal structure through a review of evidence. A fundamentally descriptive model, the IDT was developed with information on demographic parameters that remain hypothetical constructs in prehistoric cases, prompting Gage and DeWitte (Reference Gage and DeWitte2009) to recommend caution concerning the ADT. We focus here on changes in the rate of population growth by phase, calculated on the basis of settlement pattern data. We first consider when the ADT began in Mesoamerica and the Southwest. Then, we describe the approach used to derive growth rates from settlement pattern data.
The Beginning of the ADT
Bocquet-Appel (Reference Bocquet-Appel2011a:S502) argues that both sedentism and a shift toward high-calorie/high-carbohydrate foods are necessary to initiate the ADT. Supporting that claim is a study of 47 ethnographically documented populations in which the mean fertility for horticulturalists was virtually identical to that of hunter-gatherers, whereas that for agriculturalists was significantly higher (Gage and DeWitte Reference Gage and DeWitte2009:652). Those observations cast doubt on one of multiple possible moments for the beginning of the ADT in Mesoamerica: the initial spread of maize from the tropical lowlands (reaching highland central and southern Mexico by at least 4000 BC). That spread does not seem to have been accompanied by dramatic demographic consequences, perhaps because maize was only partially domesticated when it spread beyond the tropics, and key allelic changes conferring the domesticated phenotype took place beyond the center of domestication (Kennett et al. Reference Kennett, Thakar, VanDerwarker, Webster, Culleton, Harper, Kistler, Scheffler and Hirth2017; Kistler et al. Reference Kistler, Maezumi, de Souza, Przelomska, Costa, Smith, Loiselle, Ramos-Madrigal, Wales, Ribeiro, Morrison, Grimaldo, Prous, Arriaza, Gilbert, Freitas and Allaby2018).
In Mesoamerica, there are two more likely candidates: the transition from Archaic to Formative (1900 BC) or the transition from Early to Middle Formative (~1000 BC). We favor the first of these. The initial Formative witnessed the appearance of pottery and numerous attributes of sedentism (long-lasting villages, earthen platforms, more permanent residences, large storage pits). Although the social value ascribed to maize may have shifted after 1000 BC (Rosenswig et al. Reference Rosenswig, VanDerwarker, Culleton and Kennett2015; VanDerwarker and Kruger Reference VanDerwarker and Kruger2012), during what we refer to as the high-productivity phase of the ADT, it is clear that maize was a significant component of the diet from the beginning of the Formative (Bérubé et al. Reference Bérubé, Hepp and Morell-Hart2020; Hepp et al. Reference Hepp, Sandberg and Aguilar2017; Kennett et al. Reference Kennett, Prufer, Culleton, George, Robinson, Trask, Buckley, Moes, Kate, Harper, O'Donnell, Ray, Hill, Alsgaard, Merriman, Meredith, Edgar, Awe and Gutierrez2020; Lesure et al. Reference Lesure, Sinensky, Wake and Hoffmeister2021). An analysis of proportions of young individuals in human skeletal assemblages is also consistent with a long Mesoamerican ADT beginning at 1900 BC and extending throughout the Formative (Lesure et al. Reference Lesure, Martin, Bishop, Jackson and Chykerda2014).
Here, we treat 1900 BC as the beginning of the ADT in Mesoamerica. There is, however, one more possibility: the mid-second millennium BC, coinciding with evidence of extensive forest clearing, the appearance of more productive varieties of maize, and isotopic evidence that at least some individuals were relying on maize as a staple (Kennett et al. Reference Kennett, Piperno, Jones, Neff, Voorhies, Walsh and Culleton2010, Reference Kennett, Thakar, VanDerwarker, Webster, Culleton, Harper, Kistler, Scheffler and Hirth2017, Reference Kennett, Prufer, Culleton, George, Robinson, Trask, Buckley, Moes, Kate, Harper, O'Donnell, Ray, Hill, Alsgaard, Merriman, Meredith, Edgar, Awe and Gutierrez2020). Settlement pattern data to examine population growth prior to 1900 BC are not available.
In the Southwest, there are also multiple candidates for the start of the ADT. The initial appearance of maize in the late fourth and third millennia BC seems unlikely given a lack of evidence for marked behavioral or demographic consequences. More promising candidates would be the start of the San Pedro phase (~1200 BC) in the Sonoran Desert and the Basketmaker II period (~400 BC) on the Colorado Plateau. Both of these transitions are marked by changes similar to that of the Mesoamerican Formative—larger and longer-lasting settlements with more substantial architecture, abundant maize in the macrobotanical record, and 13C-enriched bone collagen consistent with the consumption of C4 plants (Carpenter et al. Reference Carpenter, Sánchez, Watson and Villalpando2015; Coltrain and Janetski Reference Coltrain and Janetski2013; Geib Reference Geib2011; Vint Reference Vint and Vierra2018). In this case, pottery appeared later, around the last few centuries of the first millennium BC in the Sonoran Desert (Garraty Reference Garraty2011) and a few hundred years later on the Colorado Plateau (Skibo and Blinman Reference Skibo, Blinman, Skibo and Feinman1999).
Kohler and colleagues (Reference Kohler, Glaude, Bocquet-Appel and Kemp2008) examined the ADT of the Southwest based on the percentages of juveniles in burial populations. Using a relative chronology (see Supplemental Text 1, Note 2), they identified a strong ADT signal in cases primarily dating to the first millennium AD, several millennia after the appearance of maize (Kohler et al. Reference Kohler, Glaude, Bocquet-Appel and Kemp2008). A shift to an absolute chronology (Kohler and Reese Reference Kohler and Reese2014) preserves that strong, comparatively late signal but reveals considerable regional variation—including a much longer and more gradual ADT in the Sonoran Desert and a sharp, late ADT on the Colorado Plateau.
Temporal Patterns of the ADT
The central concern here is patterning in the length or form of the ADT. In each region, we look for evidence of shifts to higher fertility based on rates of population growth. Relatively small populations can exhibit high growth rates, a point illustrated for the Valley of Oaxaca, Mexico in Figure 2 (based on population estimates provided by Kowalewski et al. Reference Kowalewski, Feinman, Finsten, Blanton and Nicholas1989:Tables A.III.2 and A.III.3). In the raw population curve (Figure 2a), the most dramatic features are the steep population rise after AD 1 and the high overall population late in the sequence. A shift to a logarithmic scale (Figure 2b) calls attention instead to earlier periods of growth. In Figure 2c, raw population figures are converted into changing growth rates by phase, using a formula introduced below. There were two episodes of high growth during the Formative—a more modest one (reaching 0.4% per year) during the second millennium BC, followed by a period of more rapid growth (reaching 1.4% per year) in the middle of the first millennium BC. The argument developed in this article is that these are, respectively, the signatures of the first and second phases of a two-phase ADT that is identifiable in data from both Mesoamerica and the Southwest.
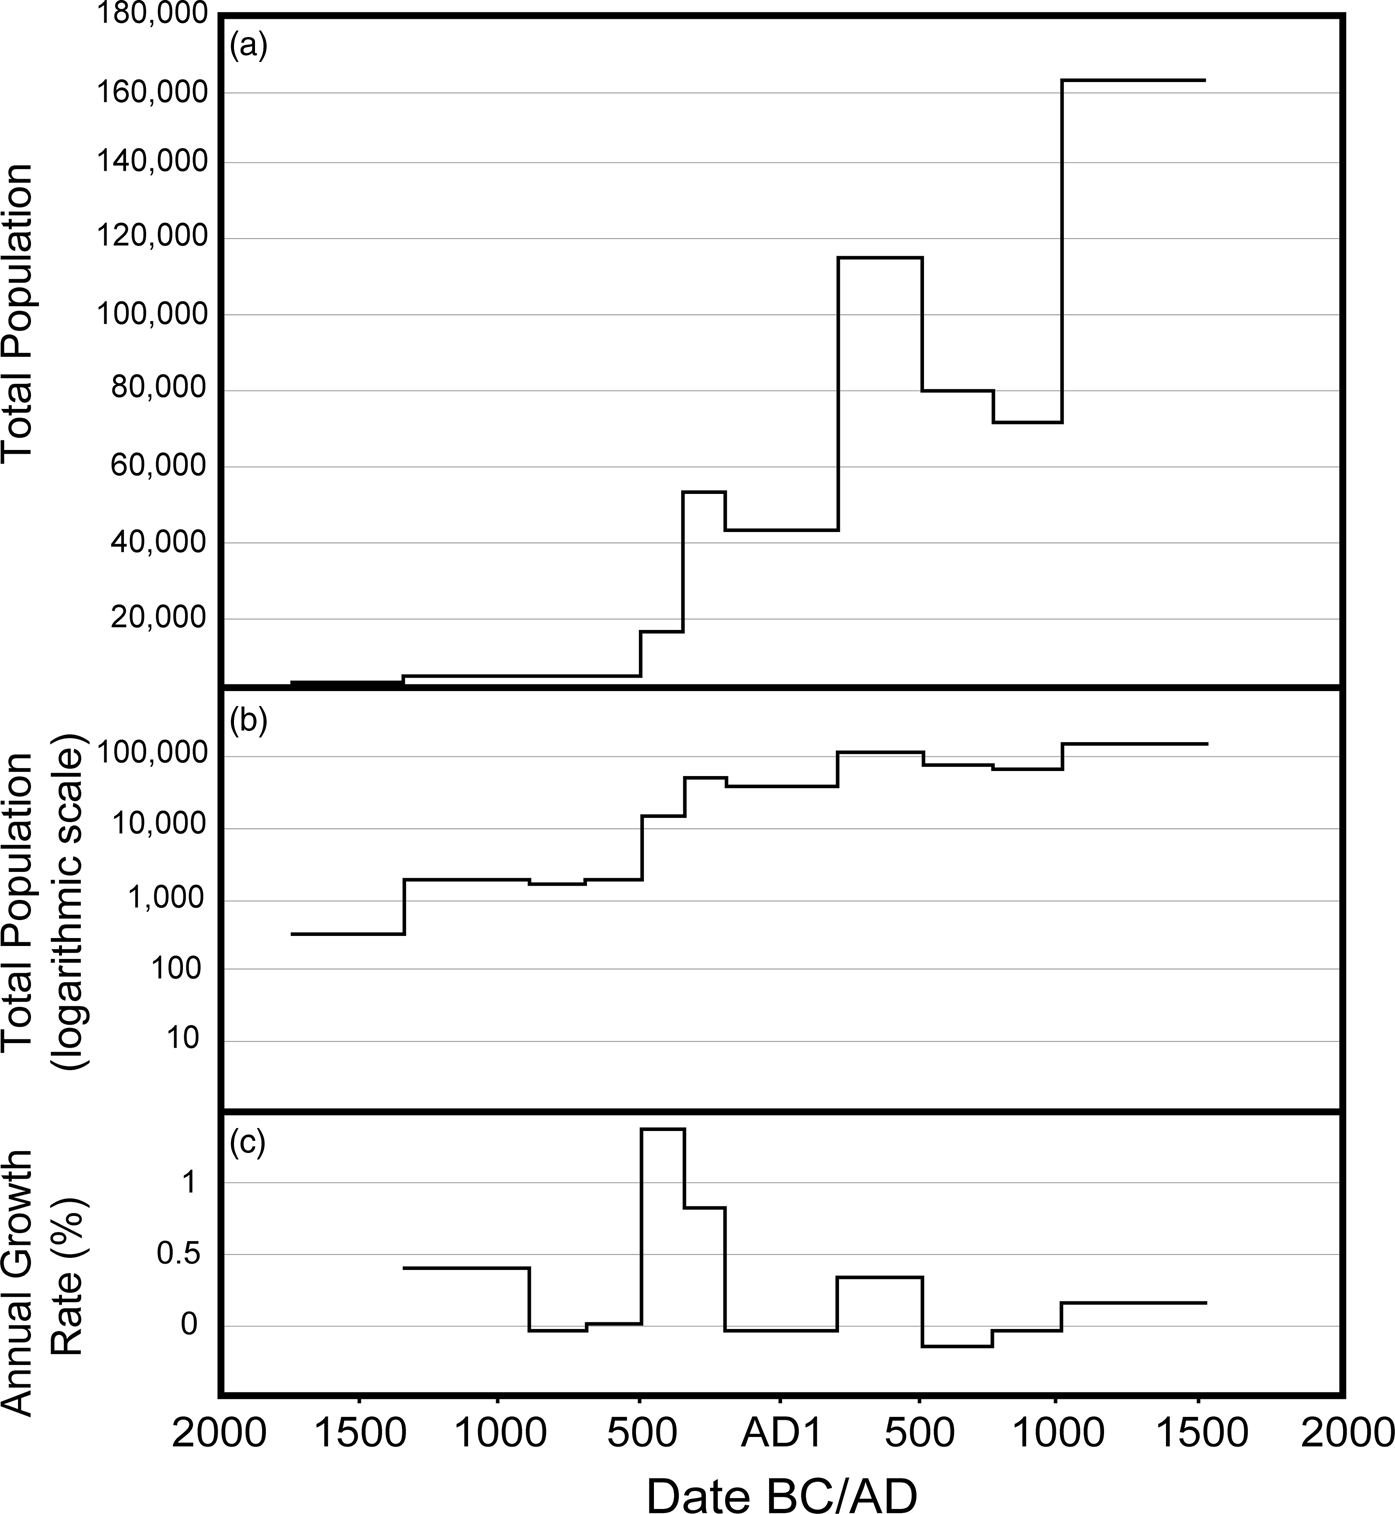
Figure 2. Prehispanic demographic history of the Valley of Oaxaca, Mexico: (a–b) total population on regular and logarithmic scales; (c) annual growth rate by phase. Based on data from Kowalewski and colleagues (Reference Kowalewski, Feinman, Finsten, Blanton and Nicholas1989:Tables A.III.2 and A.III.3).
Bandy (Reference Bandy2005) calculated growth by ceramic phase using the following formula for annual growth rate from Hassan (Reference Hassan1981):

This formula calculates the annual rate of population change (r), where T is the length (in years) of the phase, Pf is the estimated population of the phase in question, and Pi is the population of the previous phase (Bandy Reference Bandy2005:S111). Because the population for the phase of interest is compared to that of the previous phase, the growth rate for the first phase in any given region remains unknown. Consequently, for the Valley of Oaxaca, population estimates are available beginning from 1750 BC, but growth rate can be estimated only from 1350 BC (Figure 2c).
Bandy (Reference Bandy2005, Reference Bandy, Bocquet-Appel and Bar-Yosef2008) compared settlement data from the Valley of Oaxaca, the Basin of Mexico, and the Titicaca Basin. He identified an ADT of two “stages”: a period of 800 years or so of rapid population growth (0.5%–1.0% per year) followed by a decline in growth to 0%–0.2% per year. The decline in growth rate could signal stabilization of population at a new carrying capacity or, perhaps, the rise in mortality postulated as the second stage of the ADT (Bandy Reference Bandy, Bocquet-Appel and Bar-Yosef2008:334). Following Bandy, we treat this pattern of a period of high growth rate (stage 1) followed by a decline in growth (stage 2) as the signature of an ADT episode in settlement pattern data. We go farther than Bandy, however, when we argue that the ADT of a given region may be composed of multiple episodes—we call them “phases”—each with a stage 1 and stage 2.
Data
As raw data for the figures in the next few sections, we have used the best available population estimates (in numbers of people) from published archaeological surveys. These of course are estimates (Drennan et al. Reference Drennan, Berrey and Peterson2015:99–123). We have not tried to correct for any of the potential pitfalls of survey evidence beyond adjustments already in the original publications. The goal of our analysis was to (1) distinguish periods of rapid growth from periods of low growth or decline within individual regions and (2) identify patterns in the timing of periods of rapid growth among adjacent regions. An important assumption is that the procedures used to estimate population in any given study are consistently applicable throughout the sequence. We avoid directly comparing estimated rates of growth from different sequences.
Raw data and references are provided in Supplemental Tables 1 and 2 (see also Supplemental Text 1, Notes 3 and 4). Where the publication consulted provided a range in the population per phase, we computed an average of the high and low value and used that as the basis of our calculations. In Mesoamerica, the original population estimates are based fundamentally on total hectares occupied, translated into numbers of people using formulas for people/ha that usually take into account the density of occupation (Supplemental Text 1, Note 5). In a few cases, we have used hectares occupied when no population estimates were provided (Supplemental Table 1).
In the Southwest, estimating population growth rates was more complicated because the period of interest includes both preceramic and ceramic eras. Although published population estimates for the ceramic era are common and usually based on structure counts, estimates for the preceramic era have rarely been made due to the paucity of architecture visible on survey and the difficulty of translating surface artifact distributions into population. There is also less consistency in how site sizes in the Southwest are reported compared to those in Mesoamerica. For example, ceramic-era site size is often reported as a structure count, and site areas are infrequently reported in published reports even though this information likely exists on the original forms or site cards. In the discussion that follows, we calculate growth rates using (1) changes in the total site area occupied per period for preceramic- and ceramic-era sites, and (2) published population estimates derived from structure counts and expected use life for the ceramic era. The former is parallel to how Mesoamerican population estimates are made, albeit without the use of intermediary conversion factors.
Because of the different types of data underlying our growth rate estimates, we avoid directly comparing estimates derived from different methods, but we note that even for the preceramic estimates based on site area, there should be a robust relationship between site size and the intensity and longevity of occupation (Hamilton et al. Reference Hamilton, Buchanan and Walker2018). We also note that in the few cases where we were able to determine growth rates using site area across the preceramic and ceramic periods, the overall patterns of population change track previous estimates based on structure counts (Supplemental Text 1, Note 4). Regardless, we are focused here on changes in rates of growth, not absolute population counts.
A central point in the argument developed here is that the spatial manifestations of rapid growth differed between the two phases of the ADT. That point emerges in our comparisons of adjacent regions. The first phase is observed only in a few “heartland” regions, whereas many regions experienced the second phase of rapid growth. The first phase led to a heterogeneous population distribution at the macroregional scale. Populations remained concentrated in heartland regions, some with substantial communities extending over dozens of hectares, whereas surrounding regions remained sparsely populated by widely dispersed people living in small villages and hamlets. In figures presented in the following sections, we track that heterogeneity by noting the initial appearance in each region of villages of 10+ ha.
The Agricultural Demographic Transition in Two Macroregions
This section brings the notion of an ADT of two phases, with differential impacts at the macroregional scale, to a consideration of concrete cases—(1) the Southern Highlands of Mexico and (2) the Sonoran Desert of southern Arizona (USA) and northern Sonora (Mexico; Figure 1). For each of these areas, we examine population growth rates by phase in multiple constituent regions. Similarities between the two cases provide the basis for an idealized model of macroregional demographic history during the ADT.
The Southern Highlands of Mexico
The Southern Highlands of Mexico is a rugged, semiarid area in which the Valley of Oaxaca constitutes the largest expanse of arable land (rainfall 400–800 mm per year). Preceramic occupation is known from this heartland area (Flannery Reference Flannery1986), but population estimates are not available. Survey evidence begins from approximately 1800/1750 BC (Supplemental Text 1, Note 3).
Growth rates by phase from the Early Formative to the Late Postclassic are shown in Figure 3a. A single region—the Valley of Oaxaca—experienced a period of rapid growth during the second millennium BC (San José phase), concentrated in the Etla arm of the valley (e.g., Feinman and Nicholas Reference Feinman and Nicholas2013:Figure 4.5). San José Mogote was persistently the largest site: perhaps 7 ha in the early second millennium BC and between 20 and 70 ha by the late second millennium (Flannery and Marcus Reference Flannery and Marcus2005:7, 11). Yet, regions surrounding the Valley of Oaxaca remained virtually unpopulated. The overall scarcity of population across the macroregion changed dramatically in the mid-first millennium BC, when farming communities appeared everywhere. In most regions, the highest growth rates of the entire sequence (2000 BC–AD 1500) occurred at this time (Figure 3a). Although these high growth rates were associated with urbanization, including the founding and territorial expansion of Monte Albán, we propose that the ADT was still in progress. At this time, some areas of the Southern Mexican Highlands likely experienced dispersals of farmers comparable to those envisioned in Bellwood's model. Sorting out the details is difficult: there were likely both in situ expansions from small initial farming populations and radial movements of farmers from the heartland.
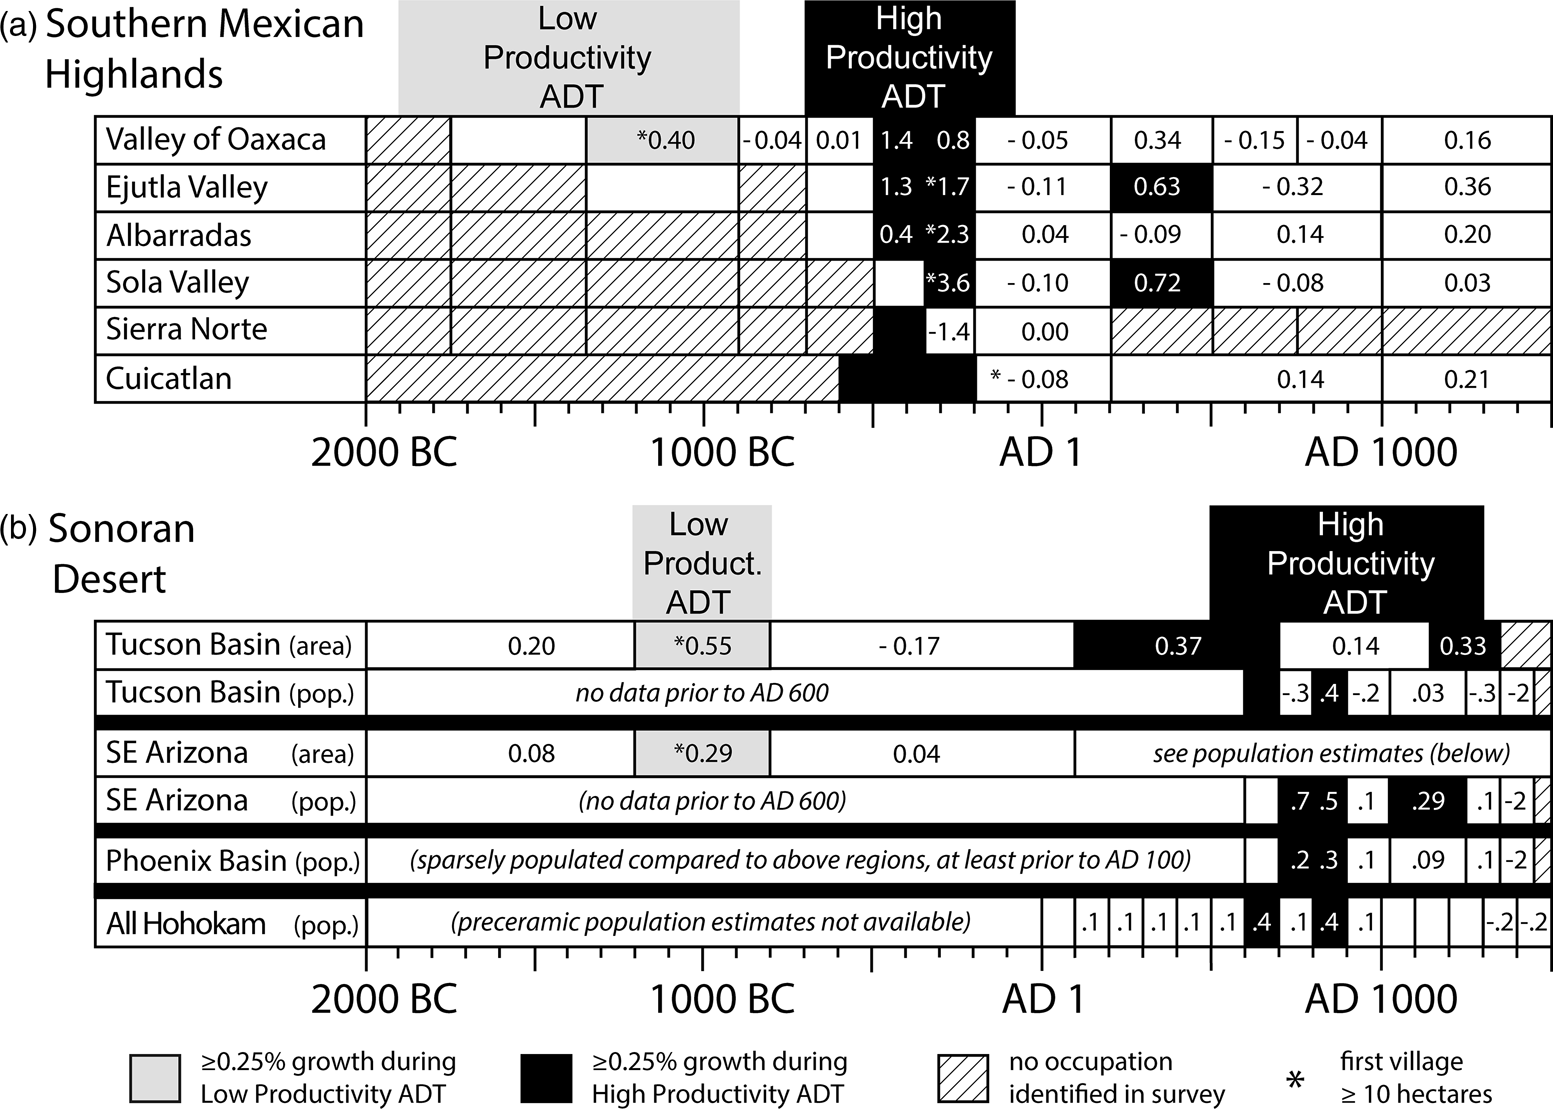
Figure 3. Population growth data from two macroregions—(a) the Southern Highlands of Mexico and (b) the Sonoran Desert—showing in each area an ADT with two phases of rapid growth: an initial “low productivity” phase and a subsequent “high productivity” phase. For constituent regions of each macroregion, estimated annual population growth rates by phase are shown from 2000 BC through AD 1500. An asterisk marks the first phase in each region in which at least one site of 10 ha or more is reported. Shaded phases are those in which growth rates were particularly high (≥0.25%, a value selected arbitrarily and used in this and subsequent figures to make patterns more readily visible). Because growth rates for initial phases cannot be calculated, we have left those blank. In a few cases, we have blackened initial phases of occupation because a high growth rate seems likely given the raw population estimate in relation to the overall length of the phase. For instance, the Sierra Norte of the Southern Mexican Highlands was registered as unoccupied prior to 500 BC; the initial phase of occupation is Early Monte Albán I (500–350 BC), when the population is estimated at 700 to 1,825 people. Further notes by macroregion: For the Southern Mexican Highlands, note how the low-productivity ADT unfolded in a single region (the Valley of Oaxaca) while other regions remained unoccupied; the subsequent high-productivity phase occurred simultaneously throughout the macroregion. For the Sonoran Desert, note that for the Tucson Basin and Southeastern Arizona regions, we draw on data from two sources (summed site areas and published population estimates). The “All Hohokam” row is based on pooled population estimates that include peripheral regions other than the Tucson and Phoenix Basins and Southeastern Arizona (phases left blank in that row due to space limitations all had growth rates of less than 0.1). For configuration of regional survey boundaries, see Figure 1. For raw data and references, see Supplemental Tables 1 and 2 as well as Supplemental Text 1.
The ADT of this macroregion consisted of two phases with distinct spatial manifestations. An initial period of rapid growth during the second millennium BC was confined to one “heartland” region, the Valley of Oaxaca. A second, more dramatic phase of rapid growth during the first millennium BC was registered across the macroregion, including in the original heartland.
The Sonoran Desert
The Sonoran Desert is substantially drier than Oaxaca, with arable river valleys receiving 200–300 mm of annual rainfall. Irrigation was consequently an important component of farming practices from the second millennium BC forward. Settlement data derived from survey are available for several locations in southern Arizona (Supplemental Text 1, Note 4). For the Tucson Basin and southeastern Arizona, we present two versions of growth rates by phase: one derived from total site area and the other from population estimates (Figure 3b).
We again find two discrete periods of population growth. The first occurred in the Tucson Basin and immediately adjacent regions of southeastern Arizona with perennial river systems during the San Pedro phase (1200–800 BC), in both cases registered clearly in the site area data. Accompanying the population surge were increases in the number of habitation sites, the complexity of sites, and average site size. This initial period of growth overlapped in time with the first ADT signal in the Valley of Oaxaca. As in Oaxaca, sites of 10 ha or more appeared for the first time (although all 10+ ha were not necessarily occupied simultaneously). The largest of these, Las Capas (1220–730 BC), is 40 ha in extent, and it includes a complex network of canals and irrigated fields that required a level of suprahousehold coordination previously unknown in the region (Vint Reference Vint and Vierra2018). By the Cienega phase (800 BC–AD 50), most people in the Tucson Basin occupied large floodplain sites ranging up to 80 ha. The numerous but ephemeral structures were likely only occupied for several years before being abandoned. Still, these large San Pedro and Cienega phase sites represent a dramatic population increase compared to the preceding Silverbell interval (2100–1200 BC), and they present clear evidence for a commitment to maize agriculture. Some well-watered locations in northern Sonora also experienced rapid population growth during the San Pedro phase and hosted sites covering well over 100 ha during the Cienega phase (Carpenter et al. Reference Carpenter, Sánchez, Sánchez and Vierra2018:113, 117). Much of the rest of the Sonoran Desert, however, remained sparsely occupied by more mobile groups less invested in maize agriculture (Hall Reference Hall and Viera2018).Footnote 2
As in the Southern Mexican Highlands—although after a considerably longer interval—a second phase of rapid growth occurred in all regions of the Sonoran Desert beginning in the first millennium AD (Figure 3b). In calculations based on site area, the second period of growth in the Tucson Basin appears to be spread over a long period (AD 100–1350) due to difficulty in assigning sites dominated by undecorated ceramics to specific intervals. Most of the growth likely occurred after AD 500 (see Wallace and Lindeman Reference Wallace, Lindeman, Young and Herr2012:38), as registered in published population estimates for the Tucson Basin and in the other regions considered in the figure (see Supplemental Text 1, Note 4 for additional commentary).
This second period of growth coincided with the rise of the previously sparsely settled Phoenix Basin as the demographic center of the macroregion. Although in the past this expansion has sometimes been linked to migration from outside the microregion—even from Mesoamerica (Haury Reference Haury1976; Wallace et al. Reference Wallace, Heidke and Doelle1995)—we suggest that it was instead the product of processes within the macroregion during the second phase of the ADT. Hohokam archaeologists have highlighted the late Pioneer and early Preclassic periods around AD 500–900 as an era of substantial growth in village size that coincided with more intensive craft specialization, the expansion of canal systems, the rise of ballcourt ritual, and increasingly complex exchange systems (Craig et al. Reference Craig, Wallace, Lindeman, Young and Herr2012; Wallace and Lindeman Reference Wallace, Lindeman, Young and Herr2012). Again, we see a two-phase ADT with an initial phase confined to specific portions of the macroregion followed by substantial and widespread expansion that coincides with extensive sociopolitical change.
A Model of Macroregional Demographic History
Similarities between these two macroregions prompt the following preliminary, idealized model of macroregional population history during the ADT in Mesoamerica and the Southwest. The demographic transition began in widely dispersed heartland regions surrounded by less favorable areas. In the less favorable areas, population remained low throughout the first phase of demographic expansion. In these secondary regions, there were small agricultural settlements or continued low-density occupation by hunter-gatherers with or without supplemental domesticates. An initial period of high growth followed by a decline in growth occurred in the heartland region. The resulting population expansion was at this point mainly accommodated within the heartland, often yielding sizable communities. This initial episode of growth was likely fueled by a relatively low-productivity agricultural package—a topic that we return to below.
At some point, a second phase of rapid growth occurred. The second episode was more dramatic than the first in terms of macroregional impact. This is the period in which farming villages, previously scarce, suddenly appeared in most regions. Notwithstanding its association with major sociopolitical transformations—urbanism and state formation in the Southern Highlands of Mexico, and the rise of the Hohokam regional system in the Sonoran Desert—this second episode was part of the ADT still in progress. We refer to this as the “high productivity” phase of the ADT—again, a point revisited below.
A Look at Other Macroregions
We think that the preceding model can help make sense of population history in other macroregions of both Mesoamerica and the Southwest, even if only a handful of cases match it in detail. The macroregional scale is crucial here. Most regions experienced a single phase of rapid growth, during the high-productivity phase of the ADT (the first millennium BC in Mexico and the second half of the first millennium AD in the Southwest), yet they were part of a larger system in which some regions had already experienced an initial phase of rapid growth. Teasing out that initial phase from survey data can be difficult. In the Southwest, it is preceramic. In Mesoamerica, phase divisions of the earlier Formative are often too coarse to pick up an initial spike in growth, and demographic events prior to the appearance of pottery are undetectable in available settlement pattern evidence. In both Mesoamerica and the Southwest, many surveys do not yield data amenable to the sort of analysis presented in Figure 3.
We perceive several variants among macroregional population histories. Some areas other than the Southern Highlands and the Sonoran Desert did experience a two-phase ADT with identifiable heartlands emerging in the first phase. In other cases, multiple, contiguous regions may have experienced gradual growth such that they were all thinly populated by agriculturalists on the eve of the high-productivity phase of the ADT, when villages suddenly proliferated across the macroregion. In some cases, the trajectory of the ADT was complicated by regional-scale instabilities. People moved en masse, apparently due to political, economic, and/or ecological factors beyond the simple set of processes posited for the ADT. The following paragraphs provide examples.
Variability in Mesoamerica
In Mesoamerica, highland Central Mexico appears to have undergone a two-phase ADT, with multiple heartlands in Morelos, southern Puebla, the southern Basin of Mexico, and possibly the Toluca Valley (Figure 4). An early rise and decline of population growth is not clearly detectable in the survey data, probably due, in part, to coarse temporal subdivision of the crucial era as well as the fact that the second phase followed closely on the heels of the first. To support our claim for a separate, initial episode of high growth, we note the emergence of large settlements (10+ ha) during the later second millennium BC in regions that were settled from 1400 BC or before. The site of Tlapacoya, for instance, in the southern Basin of Mexico, reached 70 ha (Niederberger Reference Niederberger, Clark and Pye2000). Such sites indicate considerable buildup of population in heartland zones even while the larger macroregional landscape remained sparsely populated. This heterogeneous population distribution with concentrations in several heartlands is similar to what we observed during the second millennium BC in the Southern Highlands (Figure 3a).
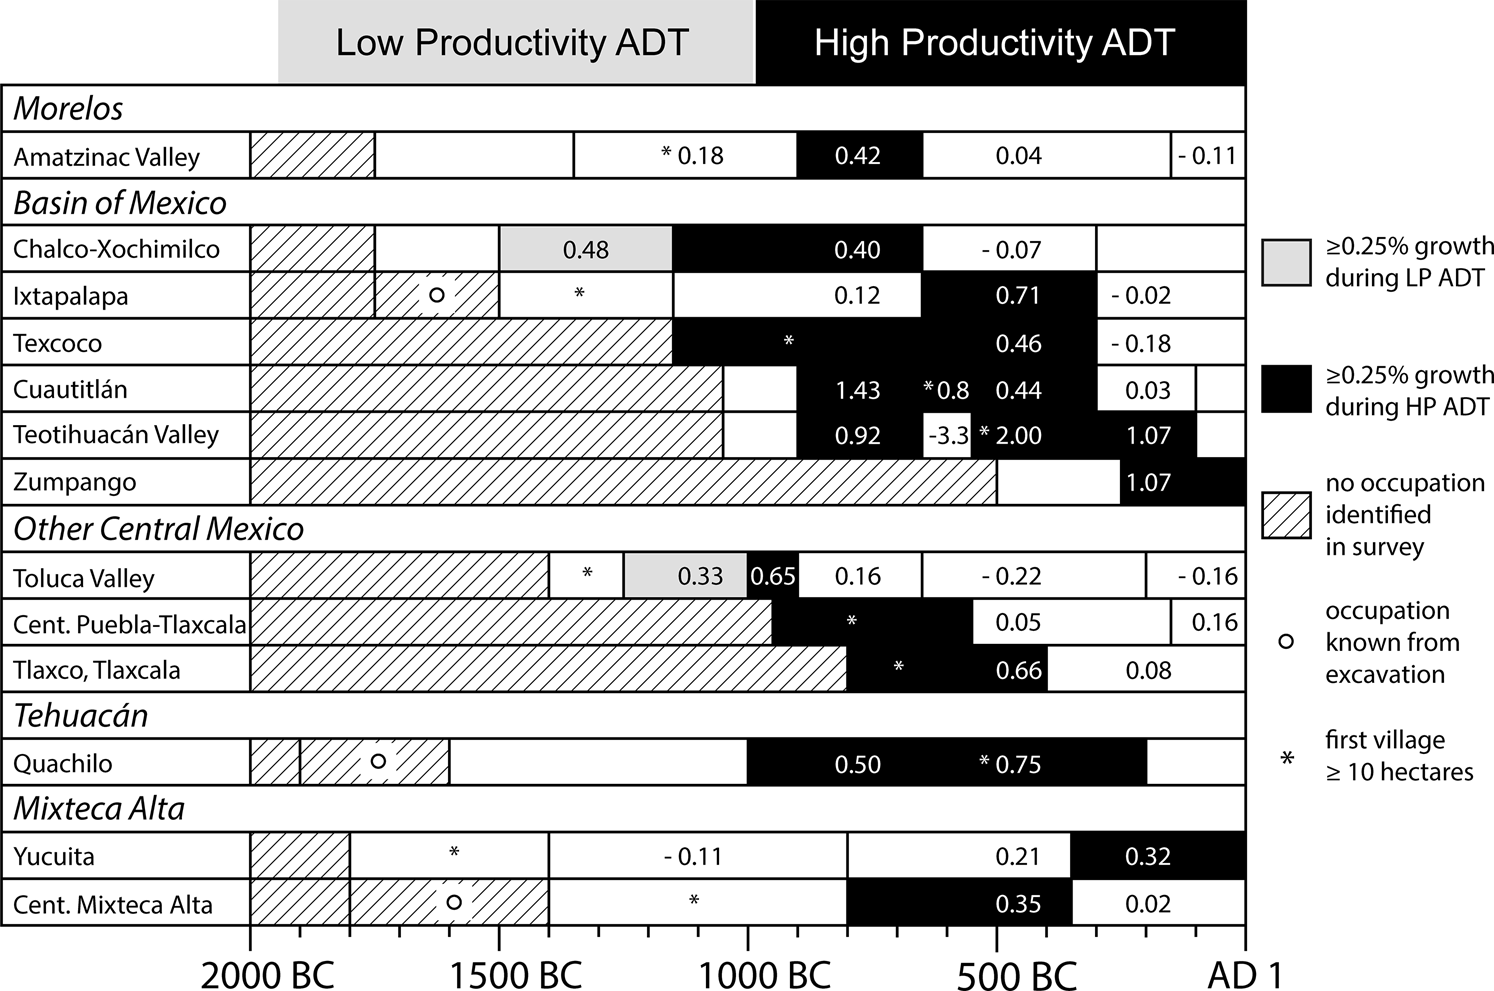
Figure 4. Growth rates between 2000 BC and AD 1 in 13 additional regions of Mesoamerica. Note the shorter interval than in Figure 3. Most cases are from the macroregion of Central Mexico. Also included are a single case from the Tehuacán Valley and two additional cases from the Southern Highlands (Mixteca Alta). Again, phases with particularly high (≥0.25%) growth rates are shaded. In these cases, it is also crucial to note the asterisks, which mark the first phase in each region in which at least one site of 10 ha or more is reported. As before, initial phases are blank because growth rates cannot be calculated. In three cases, we have blackened initial phases of occupation because a high growth rate seems likely given the raw population estimate in relation to the overall length of the phase. For configuration of regional survey boundaries, see Figure 1. For raw data and references, see Supplemental Table 1 and Supplemental Text 1.
Indeed, expanding coverage of the Southern Highlands to the Mixteca Alta (bottom of Figure 4) reveals additional probable heartland areas. In both Yucuita and the Central Mixteca Alta, villages of 10 ha or more appeared before 1000 BC. In those cases along with Quachilo (a small area with full coverage survey in the Tehuacán Valley), there is a subsequent spike in the growth rate during the first millennium BC, which corresponds to the high-productivity phase of the ADT.
Population instability involving abandonments of entire regions complicated the ADTs of both the southeastern Pacific coast and the southern Gulf coast. In both areas, heartland zones with large centers and substantial concentrations of people emerged during the second millennium BC in an otherwise sparsely populated landscape (Mazatán on the Pacific coast [Pye et al. Reference Pye, Hodgson, Clark and Lesure2011:Table 10.1] and Middle Coatzacoalcos on the Gulf [Symonds et al. Reference Symonds, Cyphers and Lunagómez2002:Figure 4.4]). Those are important elements of the two-phase model for the ADT. Yet, both those regions experienced dramatic population declines around 1000 BC. Although overall population on the Gulf coast grew during the Middle and/or Late Formative, surveys reveal continuing instability at the regional scale (see Supplemental Text 1, Note 6).
Based on the available settlement pattern evidence, the Maya Lowlands would appear to be a case of gradual population expansion preceding a dramatic, single-phase ADT (Supplemental Text 1, Note 1). Ceramics were adopted late compared to the rest of Mesoamerica (1200–1000 BC), and shortly thereafter, villages proliferated in the manner of the high-productivity phase of the ADT unfolding contemporaneously elsewhere in Mesoamerica. Kaufman (Reference Kaufman, Aissen, England and Maldonado2017:65–67) and Kennett and colleagues (Reference Kennett, Prufer, Culleton, George, Robinson, Trask, Buckley, Moes, Kate, Harper, O'Donnell, Ray, Hill, Alsgaard, Merriman, Meredith, Edgar, Awe and Gutierrez2020) envision an earlier demic expansion from the Guatemalan Highlands during the second millennium BC. That expansion would have been coeval with the low-productivity phase of the ADT observed elsewhere, but it was different in character because population growth was not bottled up in heartland regions but instead led to a radial expansion of farmers. If further research bears out that scenario, it might be accommodated to our model by recognizing the significance of mobility in the adaptations of these preceramic Maya farmers. We note that the early farming adaptation in the Sonoran Desert was also comparatively mobile (Carpenter et al. Reference Carpenter, Sánchez, Watson and Villalpando2015:247–248; Vint Reference Vint and Vierra2018:81). A heartland pattern was retained in that case because areas suitable for irrigation agriculture were spatially restricted and highly contested.
Variability in the Southwest
There is evidence of a two-phase ADT in western portions of the Colorado Plateau, with an initial period of increased growth rates in the late first millennium BC in portions of what is now Utah and Arizona (e.g., Cedar Mesa, northern Black Mesa, and Canyon del Muerto). All regions experienced an even more dramatic period of growth beginning around AD 600 (Figure 5). The second period of rapid growth corresponds with the ADT identified by Kohler and Reese (Reference Kohler and Reese2014) via mortuary data. In some areas, exemplified in Figure 5 by the Village Ecodynamics Project (VEP) data from the central portion of the northern San Juan, we see little or no agricultural population preceding massive growth during the high-productivity phase of the ADT. This variability in the timing of regional population growth and potential effects of agricultural expansions on the Colorado Plateau have been noted by other researchers (e.g., Vierra and Carvalho Reference Vierra and Carvalho2019). Western portions of the plateau, such as the Tusayan and Chuska Mountains regions, are better candidates for a two-phase ADT, with the first phase beginning during the Basketmaker II period (Coltrain et al. Reference Coltrain, Janetski and Carlyle2007; Geib Reference Geib2011). Eastern areas, especially in the Rio Grande Valley (Vierra and Carvalho Reference Vierra and Carvalho2019:12–13), experienced a mix of in situ expansion and farming dispersals during a single phase of rapid growth restricted to the high-productivity phase of the ADT. Although the western Colorado Plateau is often not considered a favorable location for agriculture due to its aridity, its geographic proximity to the populations involved in the first phase of the ADT in the Sonoran Desert may have spurred earlier experimentation with agriculture and a two-phase ADT (see Coltrain and Janetski Reference Coltrain and Janetski2019; Matson Reference Matson1991).
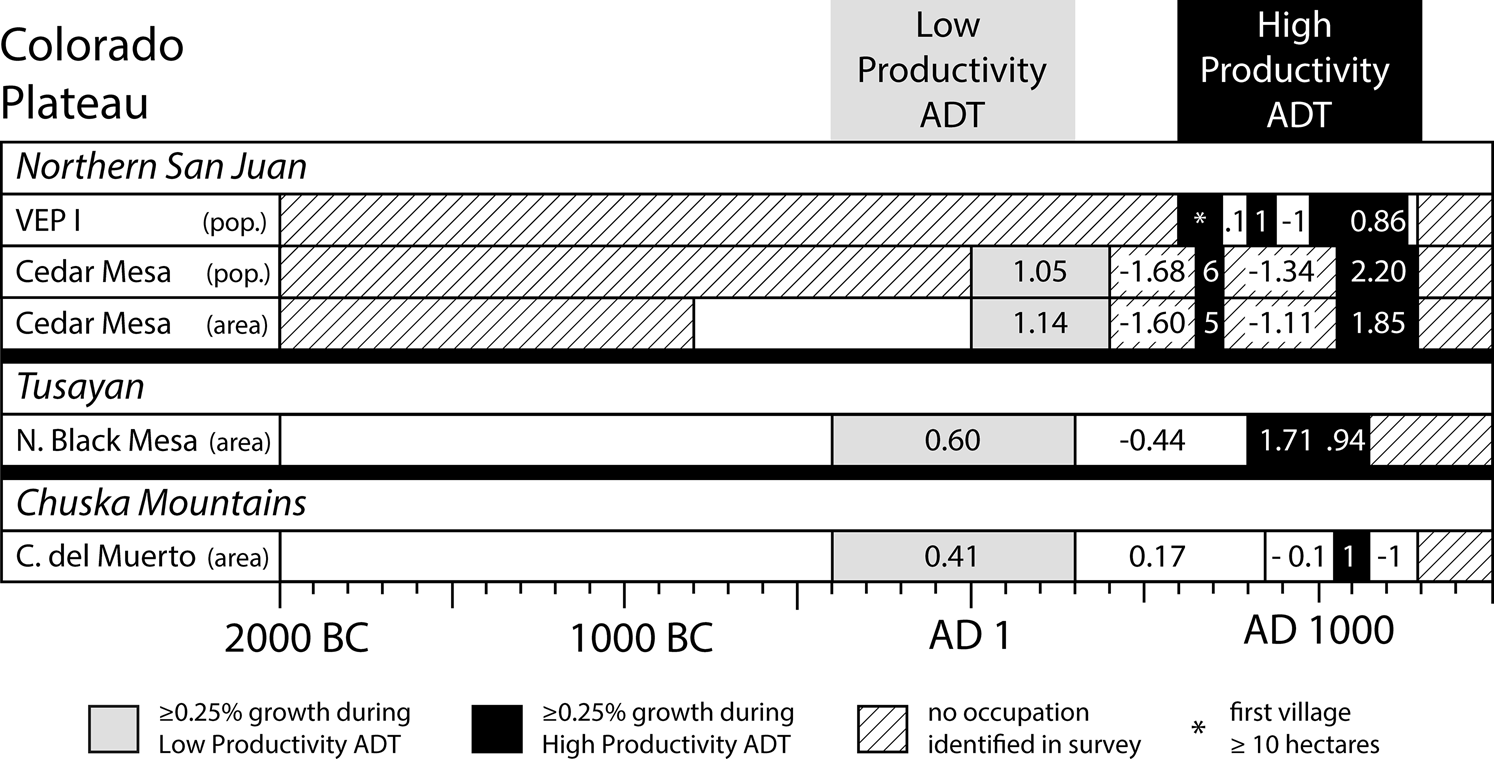
Figure 5. Growth rates between 2000 BC and AD 1500 on the Colorado Plateau. Individual rows are based either on previously published population estimates or summed site areas, as indicated on the figure; both are available for Cedar Mesa and yield a similar picture (see Supplemental Text 1, Note 4 for details, including how we calculated a growth rate for the initial phase in the population estimate row for Cedar Mesa). As before, phases with particularly high (≥0.25%) growth rates are shaded. For the Village Ecodynamics Project (VEP) survey area in the Northern San Juan, we have blackened the initial phase of occupation because the rapid appearance of significant population (estimated at 1,826 people) during a short phase makes a high annual growth rate likely. For configuration of regions, see Figure 1. For data and references, see Supplemental Table 2 and Supplemental Text 1.
Population instability at a regional scale was a widespread phenomenon in the Southwest. In the Sonoran Desert, although individual communities were often long-lasting compared to those on the Colorado Plateau, the second phase of the ADT included a dramatic shift in the demographic pole of the region, with the Phoenix Basin far outstripping the population of the Tucson Basin. On the Colorado Plateau, there was marked population instability even during periods of overall population growth. Population swung wildly on both northern Black Mesa and in the northern San Juan regions (Figure 5). Although we are able to better track these changes and identify regional variation during the ceramic era, it is possible this instability was also characteristic of the first phase of the ADT in the Southwest—albeit masked by a much coarser chronology.
The Changing Productivity of Maize and the Two-Phase ADT
The changing productivity of maize was an important causal factor behind the two-phase ADT. We support this idea by placing evidence of maize productivity and consumption alongside the results of the foregoing analysis of demographic data. The question is, Do periods of rapid population growth—the “low productivity” and “high productivity” phases of the ADT—correspond to morphological or genetic changes in maize, or to evidence of intensifying production or consumption?
Figure 6 compiles relevant evidence for Mesoamerica and two parts of the Southwest—the Sonoran Desert and the Colorado Plateau. We are able to consider macroregions separately for the Southwest because of the greater availability of data. We anticipate that future work will show variability also between macroregions within Mesoamerica. The timing for the low-productivity and high-productivity phases of the ADT is based on Figures 3, 4, and 5, and associated discussion. Direct evidence derived from ancient maize includes genetic data (Table 1), attributes of cob and kernel morphology (Table 2), and 14C measurements. In order to assess the timing of the initial appearance of maize varieties with important genetic and phenotypic changes in each region, we present kernel density estimation (KDE) models using 14C measurements derived primarily from maize. Similar to summed probability distributions, KDE models summarize a group of 14C measurements by pooling probability, but they differ in assuming a coherent relationship between measurements within a group, and they are less susceptible to the high-frequency noise introduced by the calibration curve (Bronk Ramsey Reference Bronk Ramsey2017; McLaughlin Reference McLaughlin2019). Also considered are significant advances in agricultural technologies, the appearance of standardized grinding tools suitable for intensive flour production, and isotopic data from human bones (e.g., Adams Reference Adams1999; Coltrain and Janetski Reference Coltrain and Janetski2013; Kennett et al. Reference Kennett, Prufer, Culleton, George, Robinson, Trask, Buckley, Moes, Kate, Harper, O'Donnell, Ray, Hill, Alsgaard, Merriman, Meredith, Edgar, Awe and Gutierrez2020; Lesure et al. Reference Lesure, Sinensky, Wake and Hoffmeister2021).
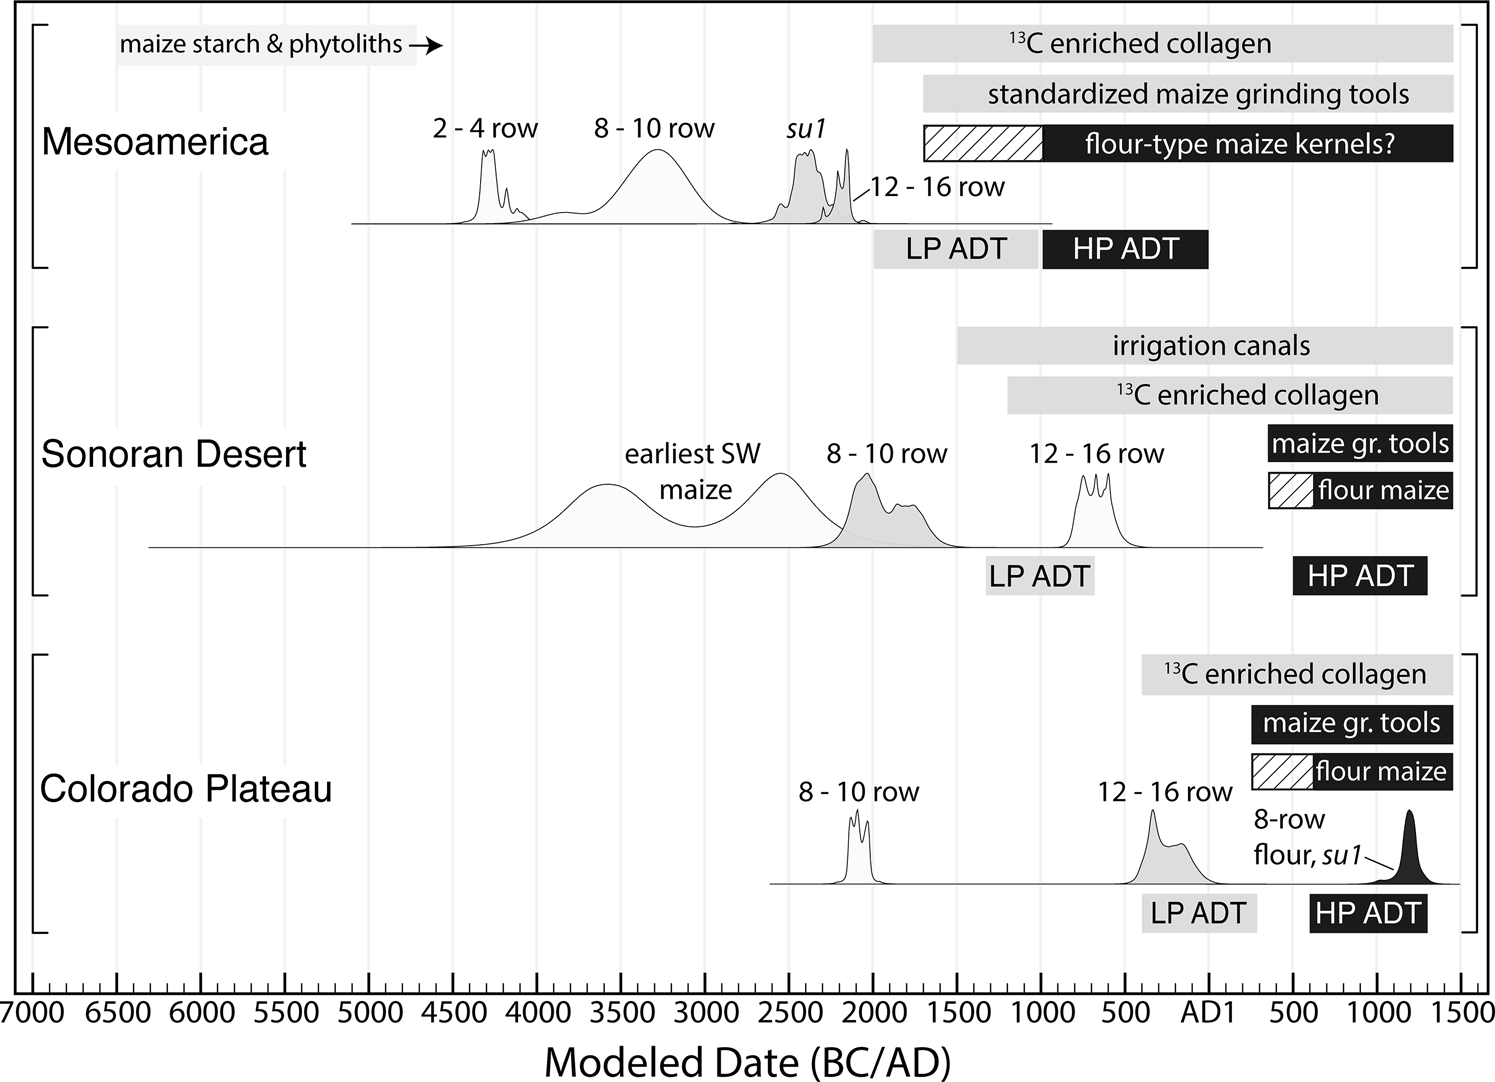
Figure 6. Timing of the low-productivity (LP) and high-productivity (HP) phases of the ADT compared to lines of evidence for the changing productivity, dietary importance, and processing strategies of maize. Probability distributions for the initial appearance of maize varieties with important genetic and phenotypic changes are derived from kernel density estimation models (Bronk Ramsey Reference Bronk Ramsey2017). Other information (13C enriched human bone collagen, standardized maize-grinding tools, the appearance of flour maize varieties, and use of irrigation canals) is based on published sources. The left-most side of the shaded box for each of those other sources of information marks the local appearance of that trait: light-gray shading indicates that the trait appeared in association with the low-productivity phase of the ADT; black shading with the high-productivity ADT. For the appearance of flour-rich maize varieties in Mesoamerica and on the Colorado Plateau, the hatched area represents the potential initial appearance based on the adoption of ground stone technology used to process flour-rich kernels in each region. References, further explanations, and model descriptions are provided in Supplemental Text 2. Radiocarbon data and model code are provided in Supplemental Table 3.
Table 1. Genes Associated with Maize Domestication and Improvement.
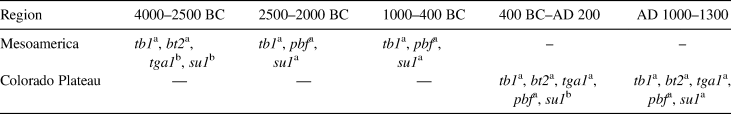
Notes: An annotated version of this table is available in Supplemental Text 2. tb1=teosinte branched1 (plant architecture); bt2=brittle endosperm2 (glycogen biosynthesis); tga1=teosinte glume architecture1 (glume hardness and morphology); pbf=prolamin box binding (protein storage in kernels); su1=sugary1 (starch debranching in kernels).
a Nucleotide variability similar to modern maize land races.
b Nucleotide variability intermediate between modern maize and teosinte (Zea mays ssp. parviglumis).
Table 2. Kernel Row Counts Observed on Archaeological Maize Cobs.
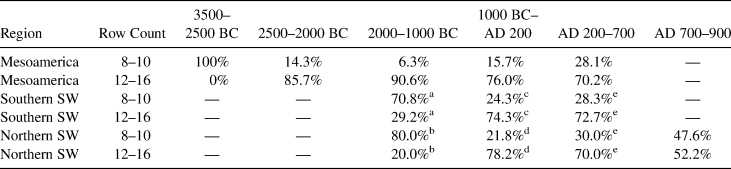
Notes: An annotated version of this table is presented in Supplemental Text 2. Row count data are provided in Supplemental Table 3.
a 2100–800 BC
b 2100–400 BC
c 800 BC–AD 50
d 400 BC–AD 300
e AD 400–700
The patterns presented in Figure 6 and summarized in Table 3 support our suggestion that the two-phase nature of the ADT in Mesoamerica and the Southwest was at least in part related to changes in the productivity of maize. In each of the cases examined, the onset of the low-productivity phase of the ADT corresponded with an era of increased dietary importance of maize, as registered by 13C enriched human bone collagen consistent with the consumption of C4 plants. In Mesoamerica and on the Colorado Plateau, the low-productivity phase followed or accompanied the development or introduction of more productive maize with 12–16 rows of kernels per cob. In the Sonoran Desert, maize with lower kernel row counts (Table 2) fueled the initial phase of the ADT, a point to which we return below. In Mesoamerica, the development or introduction of 12–16 row maize also coincides with the initial appearance of standardized maize grinding equipment—shallow, flat, or concave metates and elongated manos used with a reciprocal stroke (Figure 7).
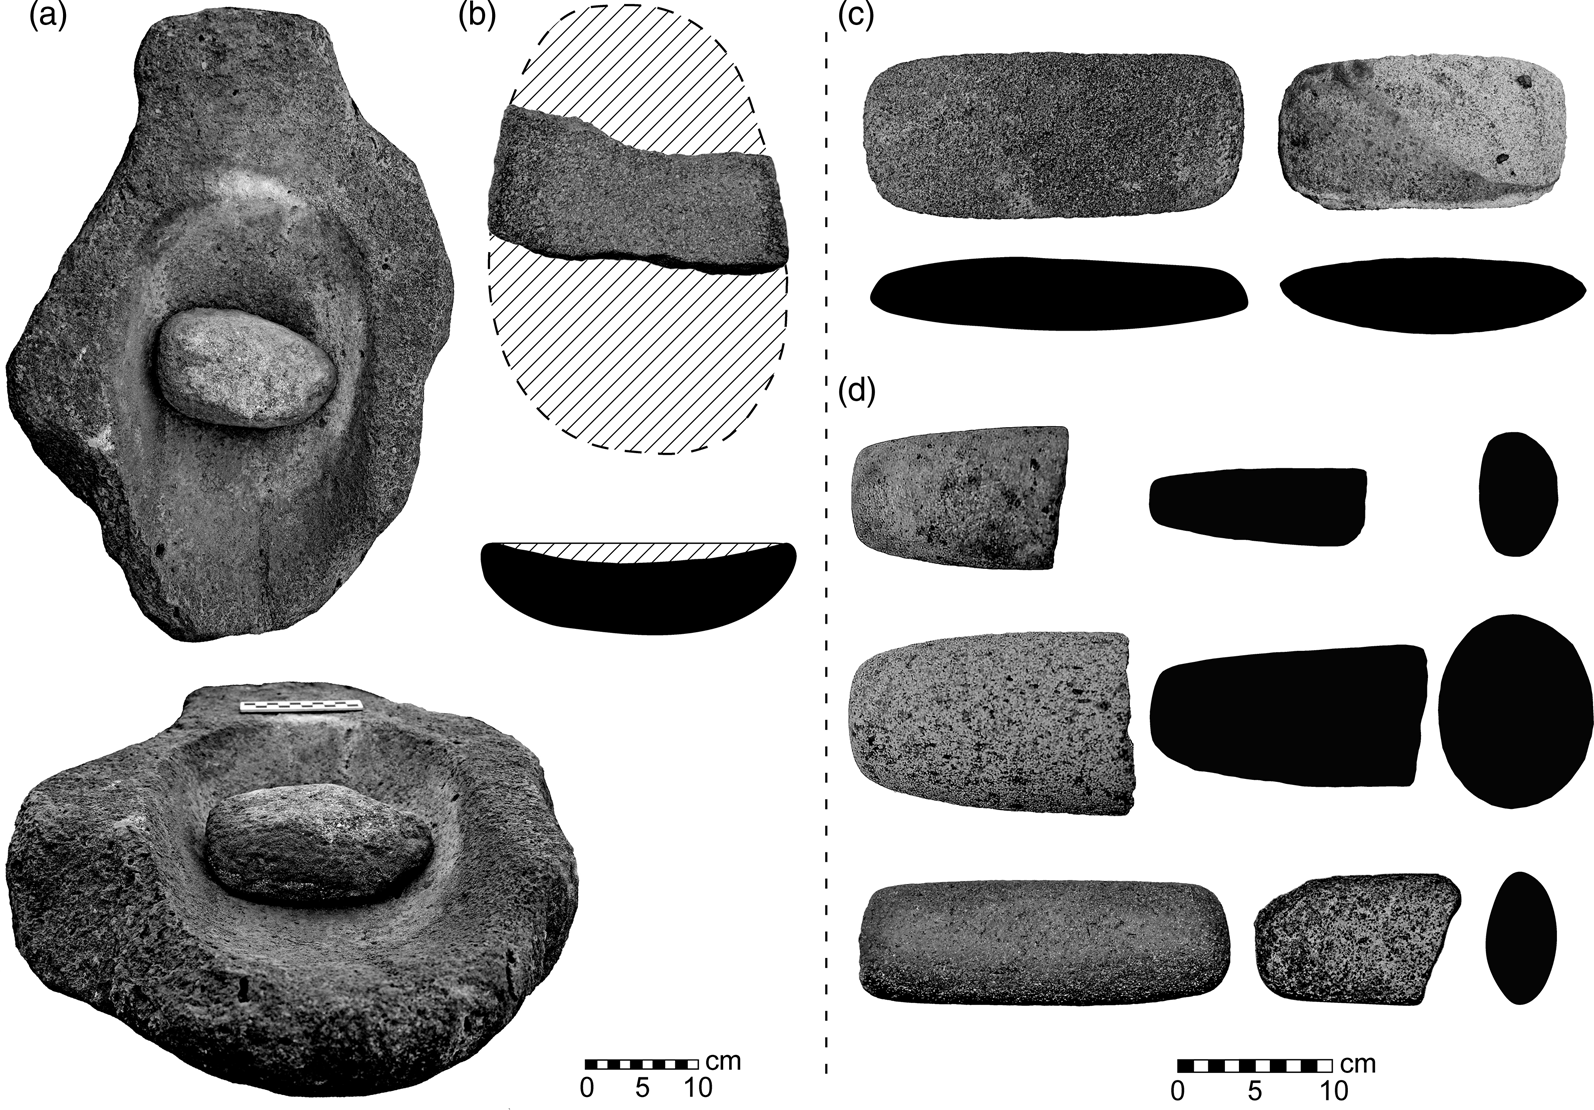
Figure 7. Early formalized maize-grinding tools associated with the dry-grinding technological tradition in the Southwest and the wet-grinding technological tradition in Mesoamerica: (a) plan and profile views of a ¾ trough metate and paired mano, northern Arizona, USA, AD 400–550 (PEFO-00029 [NPS] / PF-42 [Reed Reference Reed1947]); (b) plan and profile views of a flat/concave metate fragment (width intact) from Paso de la Amada, Chiapas, Mexico, 1700–1300 BC (304041); (c) plan and profile views of manos used with reciprocal strokes on only ventral surfaces, northern Arizona, USA, AD 250–550 (AZ Q:1:114 [ASM]); (d) plan, longitudinal, and transverse profile views of manos used with reciprocal strokes on dorsal and ventral surfaces from Paso de la Amada, Chiapas, Mexico, 1700–1500 BC (catalog numbers from top left to bottom right: 304321, 305055, 305060, 305054). (Photographs and drawings by R. J. Sinensky.)
Table 3. Proposed Dates for Changes to Maize Productivity, Dietary Importance, and Preparation Strategies.
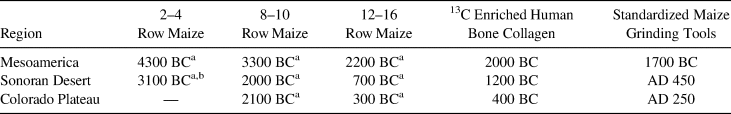
Note: Supplemental Text 2 contains detailed discussions of radiocarbon models and the proposed date ranges for dietary indicators.
a Kernel Density Estimate (KDE) Model derived median rounded to the nearest 100 years.
b Earliest directly dated maize cupules (n = 4); morphology of cobs (including row counts) is not known.
The high-productivity phase of the ADT appears to have been associated with further improvements in the agricultural package—in particular the widespread availability of maize with larger, flour-rich kernels. This relationship is evident in the Southwest by a reversal in the trajectory of increasing kernel row counts (Table 2), the widespread adoption of tools optimal for dry-grinding flour-rich kernels, and fixation of the su1 allele (associated with starch quality in kernels).Footnote 3 In Mesoamerica, some similar developments were in place well before the late ADT: the modern su1 allele was likely genetically fixed by 2400 BC, and as previously noted, a standardized maize-grinding tool kit became widespread during the second millennium BC (Supplemental Text 2). Our proposed relationship between flour-rich maize varieties and the high-productivity ADT in Mesoamerica remains speculative, but we note a similar reversal in the trajectory of kernel row counts (Table 2), the potential appearance of new maize varieties (McClung de Tapia Reference McClung de Tapia1979:188–189; Miksicek et al. Reference Miksicek, McK, Bird, Donaghey, Cartwright and Hammond1981; however, see VanDerwarker and Kruger Reference VanDerwarker and Kruger2012:511–512), evidence of alkali-treating kernels (Cheetham Reference Cheetham, Staller and Carrasco2010), and recent suggestions that 1000 BC represents an important threshold in the development of maize as a staple (Rosenswig et al. Reference Rosenswig, VanDerwarker, Culleton and Kennett2015).Footnote 4
One significant point of variability among the three cases considered is that the development of early 8- to 10-row maize in Mesoamerica and initial introduction of 8- to 10-row maize on the Colorado Plateau did not initiate the ADT in either case. In the Sonoran Desert, by contrast, the low-productivity phase of the ADT was fueled by still relatively unproductive maize and increasing investment in irrigation infrastructure. The subsequent development of more productive 12- to 16-row maize did not generate a new era of rapid population growth in the Sonoran Desert, but it had a profound impact when introduced onto the Colorado Plateau. The differences between the Sonoran Desert and the Colorado Plateau lead us to also expect variability among macroregions within Mesoamerica. Documentation of those differences will require additional data.
Conclusions
We have examined large-scale spatial and temporal patterns in the Agricultural Demographic Transition of Mesoamerica and southwestern North America. One temporal pattern revealed in the analysis of settlement data is that, overall, the ADT was very long—as much as 2,000 years or more. That point emerged in previous analyses based on human skeletal remains (Kohler and Reese Reference Kohler and Reese2014; Lesure et al. Reference Lesure, Martin, Bishop, Jackson and Chykerda2014). The settlement data reveal that regions with very long ADTs tended to experience two phases of rapid growth. Sometimes, the second phase closely followed the first (as in Central Mexico). In other cases, hundreds of years intervened between the two (as in the Sonoran Desert).
To understand the ADT in Mesoamerica and the Southwest, it is important to also consider large-scale spatial patterns. Taking “regions” as the basic unit of analysis, one might conclude that there were no spatial patterns to the ADT. In one region, a long, two-phase ADT is observed, whereas neighboring regions experienced short ADTs with a single phase of rapid growth. We have argued that this apparent chaos at the regional scale can be resolved by shifting to a larger, macroregional scale that takes clusters of historically connected regions as a unit of analysis. The second, high-productivity phase of the ADT was relatively uniform, exhibited throughout most macroregions. The first, low-productivity phase of the ADT was more variable in occurrence. Many regions and some entire macroregions do not exhibit any clear period of rapid population growth that can be identified as the first phase of the ADT.
That first phase was restricted to certain favorable “heartland” regions such as the Valley of Oaxaca, Morelos, the southern Basin of Mexico, and the Tucson Basin. In this phase, larger populations were mostly accommodated within the heartland. In such areas, communities of 10–100+ hectares appeared. Adjacent regions remained sparsely populated, although in some cases there was a gradual infilling of agricultural populations. Some macroregions lacked any clear heartland during this era; populations grew gradually without an identifiable period of rapid growth. As noted above, mobile farming adaptations in the Maya Lowlands may have generated a more homogeneous distribution of population during this era.
The second phase of the ADT involved explosive population growth in all regions, both heartland zones and their peripheries. Possible instances of demic expansion of populations from heartland zones are more common, although individual cases are often debated. The important point is that the large-scale spatial pattern of the second phase is distinct from that of the first. Instead of clumps of relatively dense population in an overall landscape still sparsely populated, the second phase was characterized by rapid and roughly synchronous growth in most regions, and it was often accompanied by substantial sociopolitical change, including urbanism, the rise of archaic states, and the development of extensive regional systems.
We conclude with a few reflections on Bellwood's (Reference Bellwood2005) model for Mesoamerica, a significant source of inspiration for the research presented here. We noted at the outset that the simultaneity in expansions of farmers speaking different languages was an attractive feature of the model. Yet, there was also a significant problem: demographic events postulated in Bellwood's model or observed archaeologically were not simultaneous. For instance, if farmers migrating from the northern fringes of Mesoamerica brought maize to the Southwest, this would have occurred during the third millennium BC, whereas the best evidence within Mesoamerica for possible demic expansions of farmers dates to the first millennium BC. For Mesoamerica, our results point to a partial resolution of these incongruities in what might be called “serial simultaneity.” The first and second phases of the ADT each unfolded approximately simultaneously during the second and first millennia BC, respectively. Still, to preserve the potential viability of Bellwood's postulated expansion of agriculturalists to the Southwest, we would need to push the beginning of the low-productivity phase of the ADT back into the third millennium BC, and there we reach the limits of the settlement data for Mesoamerica. We do not expect that situation to change soon. A next step for Mesoamerica might instead be work on more detailed data on macroregional variability in the changing productivity of maize such as that presented here for the Southwestern cases.
Acknowledgments
We thank Tim Kohler and Scott Ortman for lively discussion of our ongoing work during their visits to UCLA, and Karime Castillo for translating the abstract. Lana Martin assisted with earlier iterations of this project. Matthew Pailes provided suggestions for surveys in the Sonoran and Chihuahuan Deserts. Kyle Woodson shared survey reports from the Gila River Indian Community, and John Hall—then with Statistical Research Inc.—shared a draft of the Falcon Landing excavation report. We thank several anonymous reviewers for suggestions that improved the quality of this article.
Data Availability Statement
Supplemental Tables 1 and 2 provide the data used in Figures 3, 4, and 5. Supplemental Table 3 provides the radiocarbon data and code used in Figure 6 and the maize row-count data presented in Table 2.
Supplemental Materials
For supplemental material accompanying this article, visit https://doi.org/10.1017/aaq.2021.23.
Supplemental Text 1. Notes 1–6, with References Cited for Supplemental Tables 1 and 2.
Supplemental Text 2. Bibliographic Discussion for Figure 6, Tables 1–3, and References Cited for Supplemental Table 3.
Supplemental Table 1. Mesoamerica Survey Data.
Supplemental Table 2. Southwest Survey Data.
Supplemental Table 3. Radiocarbon Data, Model Code, and Maize Row Count Data.


 Open access